
|
|
|
QCEW Workforce Analysis Solutions -- integrating employment, establistments & wages into planning & operations .. updates section; quarterly census of employment and wages; frequent changes
From March 2025 to March 2026, employment increased in 151 of the 376 largest U.S. counties. Licking, Ohio (in the Columbus metropolitan area),
had the largest over-the-year increase in employment, with a gain of 3.6 percent.
Washington, DC, and Arlington, Virginia, had the largest over-the-year percentage decreases in employment (-4.5 percent each). Within Washington,
the largest employment decrease occurred in government, while in Arlington, the largest employment decrease was in professional and business services. In Montgomery, Maryland (also in the Washington metropolitan area), employment decreased 4.0 percent.
The QCEW data are released quarterly. The County Employment and Wages release for second quarter 2026 is scheduled to be released on Wednesday, December 2, 2026 at 10:00 am ET. Installer last updated 08/22/26 .. register here Using the QCEW Workforce Solutions The start-up view of the QCEW Workforce Analysis program is shown below. The user selects a county in left panel and the profile is shown in the grid at right. Click graphic for actual view. 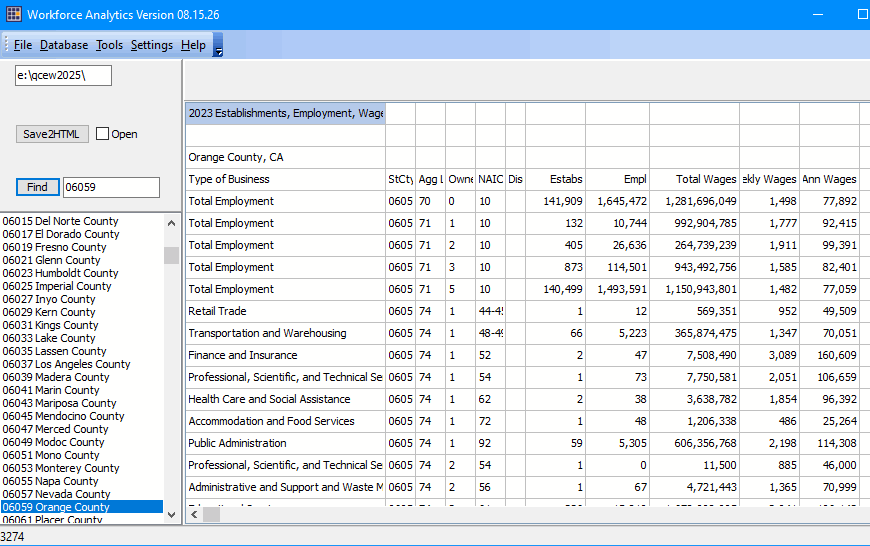
Web Sessions The state of development of the QCEW Workforce Analysis is presented at each web session conducted Tuesday, Wednesday and Thursday. Examples • Cowley County, KS HTML Winfield & Arkansas • Sedgwick County, KS HTML Wichita Related Sections • QCEW Interactive Table • County Business Patterns data by county, ZIP code & Congressional District • NAICS Codes .. NAICS Codes lists About QCEW The Quarterly Census of Employment and Wages (QCEW) program publishes a quarterly count of employment and wages reported by employers covering more than 95 percent of U.S. jobs, available at the county, MSA, state and national levels by industry. QCEW is a comprehensive statistical program administered by the U.S. Bureau of Labor Statistics (BLS) that provides a near-census count of employment and wages across the United States. Key details about the QCEW program include:
Patterns of QCEW This graphic shows 4th quarter 2025 QCEW average weekly wage data for the finanicial sector for the U.S. by state. 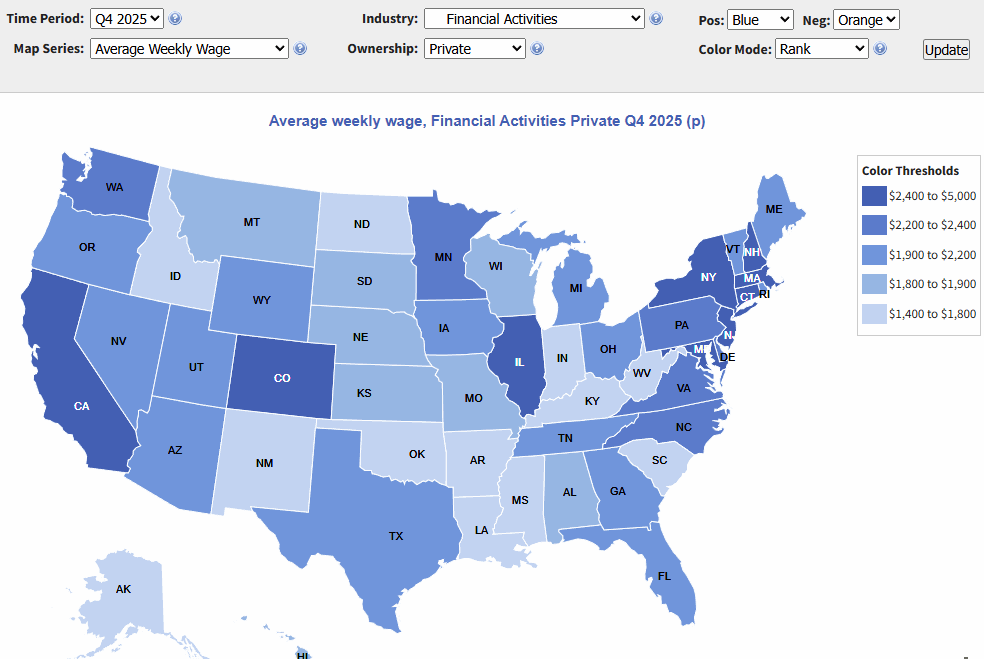
Support Using these Resources .. goto top Learn more about demographic economic data and related analytical tools. Join us in a web session. Each informal session is focused on a specific topic. The open structure also provides for Q&A and discussion of application issues of interest to participants. ProximityOne User Group Join the ProximityOne User Group to keep up-to-date with new developments relating to geographic-demographic-economic decision-making information resources. Receive updates and access to tools and resources available only to members. Use this form to join the User Group. Additional Information ProximityOne develops geographic-demographic-economic data and analytical tools and helps organizations knit together and use diverse data in a decision-making and analytical framework. We develop custom demographic/economic estimates and projections, develop geographic and geocoded address files, and assist with impact and geospatial analyses. Wide-ranging organizations use our tools (software, data, methodologies) to analyze their own data integrated with other data. Contact ProximityOne (888-364-7656) with questions about data covered in this section or to discuss custom estimates, projections or analyses for your areas of interest. |
|
|
