
|
|
County Age-Race/Ethnicity-Gender Demographic Characteristics
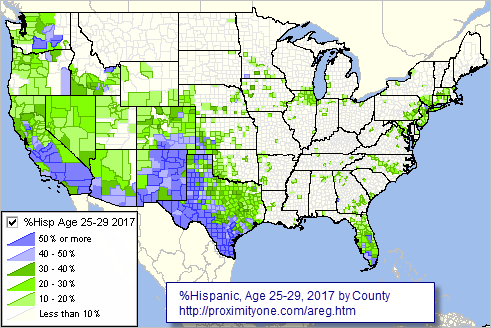
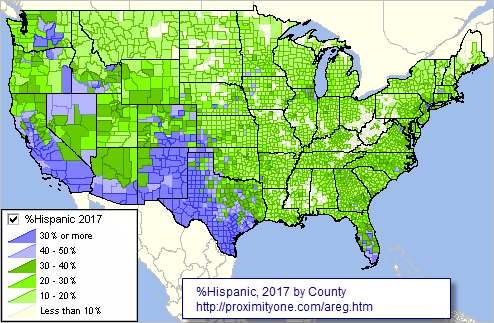
Focus of this section. The Census Bureau develops annual U.S. by county population estimates by population group. The 2010-2019 estimates were released in June 2020 and update with the 2020 estimates released in May 2021. With each annual release, the estimates are available annually for the period starting with 2010. ProximityOne uses these data, in part, to develop current estimates and projections to 2060. Use the interactive table below to examine patterns of age-race/origin-gender demographics by county annually, 2010-2019, This section is a companion to the State & County Population & Components of Change section. The interactive table below includes annual data 2010-2019 for the following population groups for the total population and by 5-year age group: • Population by major race groups alone • Population by major race groups alone or in combination • Hispanic Population by major race groups alone • Hispanic Population by major race groups alone or in combination Analyzing Population Diversity These data provide an important resource for analyzing population diversity. See more about population diversity analytics via these links. • States .. Counties .. Neighborhoods View illustrative reports and applications below. Visual Analysis of County AREG Population Patterns The following graphics illustrate how how the AREG data may be used to visually analyze the population by age-race/ethnicity-gender or the total population by race/ethnicity. The Hispanic population group is used to illustrate; similar views for any age-race/ethnicity-gender can be developed using the AREG GIS project - details below. The graphic below shows patterns of the Hispanic population, age 25-29, as a percent of total population age 25-29 based on the 2017 estimate for the U.S. by county. Use the AREG GIS project, see below in this section, to create similar views for any combination of 5-year age group by race/origin by gender.  - Click graphic for larger view. View developed with CV XE GIS software. The graphic below shows patterns of the total Hispanic population as a percent of total population based on the 2017 estimate for the U.S. by county. Use the AREG GIS project, see below in this section, to create similar views for any combination of 5-year age group by race/origin by gender.  - Click graphic for larger view. View developed with CV XE GIS software. Augmenting the Census-Sourced Data Census releases these more detailed estimates by population group by county. It is left to the user to aggregate these data into various county groups and regions. Current Estimates & Projections ProximityOne restructures the data and develops current estimates and annual projections to 2060, providing several ways to access and use the data. Current estimates refers to data for the current and previous years; projections are data for future years. Data for 2021, for example, are current estimates; current estimates are available from the ProximityOne database but not from the Census Bureau. County Age-Race/Origin-Gender Demographics Interactive Table .. goto top Click column header to sort; again to sort other direction. The table may take some time to load due to the file size (596,981 rows) Click ShowAll button between queries to refresh. Usage notes below table. See related Interactive Tables Main Page Usage Notes Click ShowAll button below table bewteen queries. Otherwise the table may show empty; nothing found. The table is organized in county sorted on state+county FIPS code, then year, then age group. The start up view shows 19 data rows: the data for the first county, in 2010 (year column), for the total population (AgeGrp 00), followed by 18 age cohorts (0..4, 5-9, 10-14, ... 80-84, 85 up). Select a county of interest by entering the state+county (5 numeric character FIPS code) in the Find StCty edit box below the table and clicking the Find StCty. The table refreshes with the 19 start-up data rows for that county. The start-up default county is 06059 Orange County, CA. To view total population (AgeGrp 00) for all counties for a selected year, use the AgeGrp and Year combination button below the table. Demographic Columns Shown in Table
Notes about these categories. "In combination" -- refers to a population of one race in combination with one or more other races. Hispanic origin is considered an ethnicity, not a race. Hispanics may be of any race. Year Iteration 10 = 2010 11 = 2011 12 = 2012 13 = 2013 14 = 2014 15 = 2015 16 = 2016 17 = 2017 18 = 2018 19 = 2019 Age Iteration 00 = Total 01 = Age 0 to 4 years 02 = Age 5 to 9 years 03 = Age 10 to 14 years 04 = Age 15 to 19 years 05 = Age 20 to 24 years 06 = Age 25 to 29 years 07 = Age 30 to 34 years 08 = Age 35 to 39 years 09 = Age 40 to 44 years 10 = Age 45 to 49 years 11 = Age 50 to 54 years 12 = Age 55 to 59 years 13 = Age 60 to 64 years 14 = Age 65 to 69 years 15 = Age 70 to 74 years 16 = Age 75 to 79 years 17 = Age 80 to 84 years 18 = Age 85 years or older ProximityOne User Group Join the ProximityOne User Group to keep up-to-date with new developments relating to metros and component geography decision-making information resources. Receive updates and access to tools and resources available only to members. Use this form to join the User Group. Support Using these Resources Learn more about census tract demographic economic data and related analytical tools. Join us in a Data Analytics Lab session. There is no fee for these one-hour Web sessions. Each informal session is focused on a specific topic. The open structure also provides for Q&A and discussion of application issues of interest to participants. Additional Information ProximityOne develops geographic-demographic-economic data and analytical tools and helps organizations knit together and use diverse data in a decision-making and analytical framework. We develop custom demographic/economic estimates and projections, develop geographic and geocoded address files, and assist with impact and geospatial analyses. Wide-ranging organizations use our tools (software, data, methodologies) to analyze their own data integrated with other data. Follow ProximityOne on Twitter at www.twitter.com/proximityone. Contact ProximityOne (888-364-7656) with questions about data covered in this section or to discuss custom estimates, projections or analyses for your areas of interest. | ||||||||||||||||||||||||||||||||||||||||||||||||||||||||||||||||||
|
|