
| Decision-Making Information |
|
ProximityOne information resources & solutions (888) DMI-SOLN (888) 364-7656 Put data to work more effectively. Certificate in Data Analytics Power of Combining Maps with Data Support & Technical Assistance help using these resources Metro in Regional Context 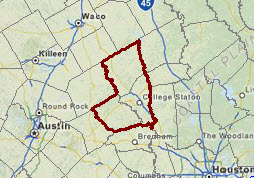 |
Situation & Outlook Report
College Station-Bryan, TX MSA (17780)
- Geographic-Demographic-Economic Characteristics -- access other areas
- access this document via http://proximityone.com/cbsa/1/cbsa17780.htm
- Updated: 05/06/19 .. see about topic updates.
Use this frequently updated document to examine geographic, demographic, economic & business characteristics and trends for this metro. Links are provided throughout to compare this metro to other metros and areas using interactive tables. Examine, for example, this metro in context of a peer group set of metros based on population size using this metros interactive table.
Metros implicitly compete among themselves for market share and business/economic development. Compare metros of interest using the ProximityOne MetroDynamics tool, integrating data presented here with other data, to assess how two or more metros/areas compare side-by-side ... now and into the future.
Contents of this Report
This document is organized into these sections:
Core-Based Statistical Areas (CBSAs) - MSAs and MISAs The nation's 933 CBSAs (August 2017 CBSA vintage) contained approximately 308.9 million people in 2018, representing approximately 94.4 percent of the nation's 327.2 population.
Metropolitan Statistical Areas (MSAs) - larger metros
The nation's 383 Metropolitan Statistical Areas contained approximately 281.1 million people in 2018, representing approximately 85.9 percent of the nation's population.
Micropolitan Statistical Areas (MISAs) - smaller metros
The nation�s 550 Micropolitan Statistical Areas contained approximately 27.7 million people in 2018, representing approximately 8.5 percent of the nation�s population.
Use the county interactive table to examine metro by county demographic change 2010-2018, the how and why of change and what these patterns suggest about the future.
Use the CBSA/metro interactive table to examine metro demographic change 2010-2017, the how and why of change and what these patterns suggest about the future.
• Housing Price Index (section 5.4) quarterly/annual
• Establishments, employment & earnings (section 6.6) quarterly/annual
• Employment Situation (section 6.7) monthly/quarterly/annual
• Construction (section 5.3) monthly/quarterly/annual
Recent Updates
... this report updates frequently. Selected updates are listed below. Register to receive update notifications.
• 05.05.18 2018 Population & Components of Change; annual 2010-2018
.. sections updated: 2. Overview .. 4. CBSA Components of Change .. 4.2. CBSA County Components
• 03.06.18 Quarterly Establishments, Employment & Wages (QCEW) by Type of Business (NAICS)
.. 2018Q3 .. see section 6.2.2. QCEW Quarterly downloadable files
• 01.09.19 Overview Section
.. see section 2. Overview
.. Personal Income subscetion updated with one year more/most recent data.
• 01.09.19 General Demographic Characteristics; 2016-2017
.. see section 4.3 General Demographic Characteristics
.. updated with one year more/most recent data.
• 01.09.19 General Housing Characteristics; 2016-2017
.. see section 5.2 General Housing Characteristics
.. updated with one year more/most recent data.
• 01.09.19 Economic Profile
.. see section 6.1 Economic Profile
.. updated/extended with one year more/most recent data.
• 01.09.19 General Economic Characteristics; 2016-2017
.. see section 6.4 General Economic Characteristics
.. updated with one year more/most recent data.
• 01.09.19 General Social Characteristics; 2016-2017
.. see section 7.1 General Social Characteristics
.. updated with one year more/most recent data.
• 10.10.18 Vintage 2018 Metro GIS Projects now available for each MSA
.. see section 3. GIS & Visual Analysis -- Reference & Thematic Pattern Maps
.. integrating data shown in this report
.. create custom maps, view custom reports, visually/geospatially analyze data
• 09.27.18 County Detailed Demographic Trend Profiles; 2010-2017
.. see section 4.2 Component Counties
.. click county link in section to view new county demographic profile
• 09.18.18 Gross Domestic Product & Related Measures
.. see section 6.5. Metro GDP Annual Update - time series 2001-2017; updates with 2018 data December 2019
• 09.18.18 Quarterly Establishments, Employment & Wages (QCEW) by Type of Business (NAICS)
.. see section 6.2.2. QCEW Quarterly downloadable files
• 09.14.18 New 2018 Vintage CBSA/Metro Delineations
.. View 2018 MSAs and component counties
• 09.03.18 City population annual estimates updated through 2017 .. 4.1 Component Cities
.. Housing Unit annual estimates updated through 2017 .. 5.1. Housing Units
.. Cost of Living .. feature added for MSAs .. 6.8. Cost of Living
• 04.26.18 New 2016 County Business Patterns/Establishment attributes; section 6.3
• 03.01.18 New 2017 Housing Price Index; new, extended structure; section 5.4
• 01.19.18 New 2016 Metro/CBSA demographic-economic interactive tables; rank/compare metros
.. General demographics .. Social .. Economic .. Housing
• Economic profile and personal income; section 6.1; annual/November.
• Census tracts overview section; annual/December.
• General Demographics section updated/extended; annual/December.
• Higher education institutions; annual/February.
• Overview lead narrative on population components of change; annual/March.
• Metro & county demographic component detailed annual estimates; annual/March.
• School districts in metro & K-12 enrollment; annual/August.
More about schedule and upcoming events ... Calendar ... Upcoming Events ... Find Event
This section provides a summary of recent business, demographic, economic trends; year-ahead & outlook to 2030.
The Recent Trends & Outlook section narrative is updated quarterly and is published in the subscriber edition. The narrative covers topics about this metro such as .. assessing the implications of next jobs report, impact of the Fed's action on the interest rate, which sectors are expanding or contracting, how housing market conditions are changing and more on insights to help your planning and decision-making.
Projections to 2030. The following table presents the most recent ProximityOne population projections to 2030 by metro county and and the metro overall. ProximityOne develops annual population estimates and projections by single year of age by county to 2030. We also develop custom estimates and projections. Contact us for further information (leave message in text box). Or call us at 888.364.7656. These projections are updated periodically and make use of other demographic-economic data presented in this document. See terms of use.
| College Station-Bryan, TX [17780] CBSA by County Population Estimates & Projections to 2030 | http://proximityone.com/outlook2030.htm | -- Vintage: 01/09/18 -- Model: 1.0.2 -- Report: 1.1 -- Run: 01/22/18 | -- County -- | 7/1/2010 | 2010% | 7/1/2020 | 2020% | 7/1/2030 | 2030% | 2010-30 | 2010-30% |
| Brazos, TX [48041] | 195,695 | 85.28 | 238,130 | 87.11 | 287,861 | 88.74 | 92,166 | 47.10 |
| Burleson, TX [48051] | 17,216 | 7.50 | 18,274 | 6.69 | 19,211 | 5.92 | 1,995 | 11.59 |
| Robertson, TX [48395] | 16,569 | 7.22 | 16,953 | 6.20 | 17,312 | 5.34 | 743 | 4.48 |
| Region Total | 229,480 | 100.00 | 273,357 | 100.00 | 324,384 | 100.00 | 94,904 | 41.36 |
Population. The total population of the College Station-Bryan, TX MSA changed from 229,453 in 2010 to 262,431 in 2018, a change of 32,978 (14.4%). Among all metros, College Station-Bryan, TX MSA ranked 97th in 2018, based on total population. It ranked 187th based population change from 2010 to 2018 and ranked 49th based population percent change from 2010 to 2018. See section 1. for population projections to 2030 for the metro by county. See section 4. for additional details on population.
Geography. The total land area of the College Station-Bryan, TX MSA is 2,099.7 SqMi with water area of 33.7 SqMi. The metro ranked 224th among all metros based on total land area. With 2017 population density of 122.9, the metro ranked 337th among all metros (based on land area).
Geographic Mobility. The net migration of the College Station-Bryan, TX MSA changed from 122 in 2011 (6/30/10 to 7/1/11) to 1,915 in 2018. From 2011 through 2018, the total net migration was 1,793; the average annual net migration was 224. See section 4 for additional details on migration.
Housing. The total housing stock of the College Station-Bryan, TX MSA changed from 95,224 in 2010 to 107,722 in 2017, a change of 12,498 (13.1%). See section 5 for additional details on housing.
Cost of Living. The regional price parity (RPP) for all goods and services for the College Station-Bryan, TX MSA changed from 92.8 in 2010 to 93.3 in 2016. The RPP is an index where the national average of the cost of goods and services sold is 100. The RPP is an indicator of the cost of living in that area relative to the U.S. overall average. See section 6.8 for additional details on Cost of Living.
Personal Income. The total personal income of College Station-Bryan, TX MSA changed from 6,973 $M in 2010 to 9,729 $M in 2017, a change of 2,757 $M (39.5%). The per capita personal income changed from $30,389 in 2010 to $37,704 in 2017, a change of $7,315 (24.1%). See section 6.1. for additional details on personal income.
Gross Domestic Product. This metro ranked number 274 among the 383 MSAs based on 2017 per capita real GDP. The real per capita GDP changed from $32,539 in 2011 to $34,770 in 2017 a change of $2,231 (6.9%).
.. Real GDP The real GDP changed from $7,531M in 2011 to $8,972M in 2017 a change of $1,441M ( 19.13%).
.. Current $ GDP The current dollar GDP changed from $7,845M in 2011 to $10,197M in 2017 a change of $2,352M ( 29.98%).
.. Quantity Index The all industry GDP quantity index changed from 101.339 in 2011 to 120.729 in 2017 a change of 19.390 ( 19.134%).
GDP is the most comprehensive measure of metro economic activity. GDP is the sum of the GDP originating in all industries in the metro. See section 6.5. for additional details on GDP.
Employment Situation (updated monthly). The College Station-Bryan, TX MSA labor force changed from 128,453 in November 2016 to 131,717 in November 2017, a change of 3,264 (2.5%). The unemployment rate changed from 3.36% in November 2016 to 2.74% in November 2017, a change of -0.63 (-18.66%). See section 6.7. for additional details on the employment situation.
| Select a Different Metro ... click a link below or use table
10100 Aberdeen, SD MISA
10140 Aberdeen, WA MISA 10180 Abilene, TX MSA 10220 Ada, OK MISA 10300 Adrian, MI MISA 10420 Akron, OH MSA 10460 Alamogordo, NM MISA 10500 Albany, GA MSA 10540 Albany, OR MSA 10580 Albany-Schenectady-Troy, NY MSA 10620 Albemarle, NC MISA 10660 Albert Lea, MN MISA 10700 Albertville, AL MISA 10740 Albuquerque, NM MSA 10760 Alexander City, AL MISA 10780 Alexandria, LA MSA 10820 Alexandria, MN MISA 10860 Alice, TX MISA 10900 Allentown-Bethlehem-Easton, PA-NJ MSA 10940 Alma, MI MISA 10980 Alpena, MI MISA 11020 Altoona, PA MSA 11060 Altus, OK MISA 11100 Amarillo, TX MSA 11140 Americus, GA MISA 11180 Ames, IA MSA 11220 Amsterdam, NY MISA 11260 Anchorage, AK MSA 11380 Andrews, TX MISA 11420 Angola, IN MISA 11460 Ann Arbor, MI MSA 11500 Anniston-Oxford-Jacksonville, AL MSA 11540 Appleton, WI MSA 11580 Arcadia, FL MISA 11620 Ardmore, OK MISA 11660 Arkadelphia, AR MISA 11680 Arkansas City-Winfield, KS MISA 11700 Asheville, NC MSA 11740 Ashland, OH MISA 11780 Ashtabula, OH MISA 11820 Astoria, OR MISA 11860 Atchison, KS MISA 11900 Athens, OH MISA 11940 Athens, TN MISA 11980 Athens, TX MISA 12020 Athens-Clarke County, GA MSA 12060 Atlanta-Sandy Springs-Roswell, GA MSA 12100 Atlantic City-Hammonton, NJ MSA 12120 Atmore, AL MISA 12140 Auburn, IN MISA 12180 Auburn, NY MISA 12220 Auburn-Opelika, AL MSA 12260 Augusta-Richmond County, GA-SC MSA 12300 Augusta-Waterville, ME MISA 12380 Austin, MN MISA 12420 Austin-Round Rock, TX MSA 12460 Bainbridge, GA MISA 12540 Bakersfield, CA MSA 12580 Baltimore-Columbia-Towson, MD MSA 12620 Bangor, ME MSA 12660 Baraboo, WI MISA 12680 Bardstown, KY MISA 12700 Barnstable Town, MA MSA 12740 Barre, VT MISA 12780 Bartlesville, OK MISA 12820 Bastrop, LA MISA 12860 Batavia, NY MISA 12900 Batesville, AR MISA 12940 Baton Rouge, LA MSA 12980 Battle Creek, MI MSA 13020 Bay City, MI MSA 13060 Bay City, TX MISA 13100 Beatrice, NE MISA 13140 Beaumont-Port Arthur, TX MSA 13180 Beaver Dam, WI MISA 13220 Beckley, WV MSA 13260 Bedford, IN MISA 13300 Beeville, TX MISA 13340 Bellefontaine, OH MISA 13380 Bellingham, WA MSA 13420 Bemidji, MN MISA 13460 Bend-Redmond, OR MSA 13500 Bennettsville, SC MISA 13540 Bennington, VT MISA 13620 Berlin, NH-VT MISA 13660 Big Rapids, MI MISA 13700 Big Spring, TX MISA 13720 Big Stone Gap, VA MISA 13740 Billings, MT MSA 13780 Binghamton, NY MSA 13820 Birmingham-Hoover, AL MSA 13900 Bismarck, ND MSA 13940 Blackfoot, ID MISA 13980 Blacksburg-Christiansburg-Radford, VA MSA 14010 Bloomington, IL MSA 14020 Bloomington, IN MSA 14100 Bloomsburg-Berwick, PA MSA 14140 Bluefield, WV-VA MISA 14180 Blytheville, AR MISA 14220 Bogalusa, LA MISA 14260 Boise City, ID MSA 14300 Bonham, TX MISA 14340 Boone, IA MISA 14380 Boone, NC MISA 14420 Borger, TX MISA 14460 Boston-Cambridge-Newton, MA-NH MSA 14500 Boulder, CO MSA 14540 Bowling Green, KY MSA 14580 Bozeman, MT MISA 14620 Bradford, PA MISA 14660 Brainerd, MN MISA 14700 Branson, MO MISA 14720 Breckenridge, CO MISA 14740 Bremerton-Silverdale, WA MSA 14780 Brenham, TX MISA 14820 Brevard, NC MISA 14860 Bridgeport-Stamford-Norwalk, CT MSA 15020 Brookhaven, MS MISA 15060 Brookings, OR MISA 15100 Brookings, SD MISA 15140 Brownsville, TN MISA 15180 Brownsville-Harlingen, TX MSA 15220 Brownwood, TX MISA 15260 Brunswick, GA MSA 15340 Bucyrus, OH MISA 15380 Buffalo-Cheektowaga-Niagara Falls, NY MSA 15420 Burley, ID MISA 15460 Burlington, IA-IL MISA 15500 Burlington, NC MSA 15540 Burlington-South Burlington, VT MSA 15580 Butte-Silver Bow, MT MISA 15620 Cadillac, MI MISA 15660 Calhoun, GA MISA 15680 California-Lexington Park, MD MSA 15700 Cambridge, MD MISA 15740 Cambridge, OH MISA 15780 Camden, AR MISA 15820 Campbellsville, KY MISA 15860 Ca�on City, CO MISA 15900 Canton, IL MISA 15940 Canton-Massillon, OH MSA 15980 Cape Coral-Fort Myers, FL MSA 16020 Cape Girardeau, MO-IL MSA 16060 Carbondale-Marion, IL MSA 16100 Carlsbad-Artesia, NM MISA 16140 Carroll, IA MISA 16180 Carson City, NV MSA 16220 Casper, WY MSA 16260 Cedar City, UT MISA 16300 Cedar Rapids, IA MSA 16340 Cedartown, GA MISA 16380 Celina, OH MISA 16420 Central City, KY MISA 16460 Centralia, IL MISA 16500 Centralia, WA MISA 16540 Chambersburg-Waynesboro, PA MSA 16580 Champaign-Urbana, IL MSA 16620 Charleston, WV MSA 16660 Charleston-Mattoon, IL MISA 16700 Charleston-North Charleston, SC MSA 16740 Charlotte-Concord-Gastonia, NC-SC MSA 16820 Charlottesville, VA MSA 16860 Chattanooga, TN-GA MSA 16940 Cheyenne, WY MSA 16980 Chicago-Naperville-Elgin, IL-IN-WI MSA 17020 Chico, CA MSA 17060 Chillicothe, OH MISA 17140 Cincinnati, OH-KY-IN MSA 17200 Claremont-Lebanon, NH-VT MISA 17220 Clarksburg, WV MISA 17260 Clarksdale, MS MISA 17300 Clarksville, TN-KY MSA 17340 Clearlake, CA MISA 17380 Cleveland, MS MISA 17420 Cleveland, TN MSA 17460 Cleveland-Elyria, OH MSA 17500 Clewiston, FL MISA 17540 Clinton, IA MISA 17580 Clovis, NM MISA 17660 Coeur d'Alene, ID MSA 17700 Coffeyville, KS MISA 17740 Coldwater, MI MISA 17780 College Station-Bryan, TX MSA 17820 Colorado Springs, CO MSA 17860 Columbia, MO MSA 17900 Columbia, SC MSA 17980 Columbus, GA-AL MSA 18020 Columbus, IN MSA 18060 Columbus, MS MISA 18100 Columbus, NE MISA 18140 Columbus, OH MSA 18180 Concord, NH MISA 18220 Connersville, IN MISA 18260 Cookeville, TN MISA 18300 Coos Bay, OR MISA 18380 Cordele, GA MISA 18420 Corinth, MS MISA 18460 Cornelia, GA MISA 18500 Corning, NY MISA 18580 Corpus Christi, TX MSA 18620 Corsicana, TX MISA 18660 Cortland, NY MISA 18700 Corvallis, OR MSA 18740 Coshocton, OH MISA 18780 Craig, CO MISA 18820 Crawfordsville, IN MISA 18860 Crescent City, CA MISA 18880 Crestview-Fort Walton Beach-Destin, FL MSA 18900 Crossville, TN MISA 18980 Cullman, AL MISA 19000 Cullowhee, NC MISA 19060 Cumberland, MD-WV MSA 19100 Dallas-Fort Worth-Arlington, TX MSA 19140 Dalton, GA MSA 19180 Danville, IL MSA 19220 Danville, KY MISA 19260 Danville, VA MISA 19300 Daphne-Fairhope-Foley, AL MSA 19340 Davenport-Moline-Rock Island, IA-IL MSA 19380 Dayton, OH MSA 19420 Dayton, TN MISA 19460 Decatur, AL MSA 19500 Decatur, IL MSA 19540 Decatur, IN MISA 19580 Defiance, OH MISA 19620 Del Rio, TX MISA 19660 Deltona-Daytona Beach-Ormond Beach, FL MSA 19700 Deming, NM MISA 19740 Denver-Aurora-Lakewood, CO MSA 19760 DeRidder, LA MISA 19780 Des Moines-West Des Moines, IA MSA 19820 Detroit-Warren-Dearborn, MI MSA 19860 Dickinson, ND MISA 19940 Dixon, IL MISA 19980 Dodge City, KS MISA 20020 Dothan, AL MSA 20060 Douglas, GA MISA 20100 Dover, DE MSA 20140 Dublin, GA MISA 20180 DuBois, PA MISA 20220 Dubuque, IA MSA 20260 Duluth, MN-WI MSA 20300 Dumas, TX MISA 20340 Duncan, OK MISA 20380 Dunn, NC MISA 20420 Durango, CO MISA 20460 Durant, OK MISA 20500 Durham-Chapel Hill, NC MSA 20540 Dyersburg, TN MISA 20580 Eagle Pass, TX MISA 20660 Easton, MD MISA 20700 East Stroudsburg, PA MSA 20740 Eau Claire, WI MSA 20780 Edwards, CO MISA 20820 Effingham, IL MISA 20900 El Campo, TX MISA 20940 El Centro, CA MSA 20980 El Dorado, AR MISA 21020 Elizabeth City, NC MISA 21060 Elizabethtown-Fort Knox, KY MSA 21120 Elk City, OK MISA 21140 Elkhart-Goshen, IN MSA 21180 Elkins, WV MISA 21220 Elko, NV MISA 21260 Ellensburg, WA MISA 21300 Elmira, NY MSA 21340 El Paso, TX MSA 21380 Emporia, KS MISA 21420 Enid, OK MSA 21460 Enterprise, AL MISA 21500 Erie, PA MSA 21540 Escanaba, MI MISA 21580 Espa�ola, NM MISA 21640 Eufaula, AL-GA MISA 21660 Eugene, OR MSA 21700 Eureka-Arcata-Fortuna, CA MISA 21740 Evanston, WY MISA 21780 Evansville, IN-KY MSA 21820 Fairbanks, AK MSA 21840 Fairfield, IA MISA 21860 Fairmont, MN MISA 21900 Fairmont, WV MISA 21980 Fallon, NV MISA 22020 Fargo, ND-MN MSA 22060 Faribault-Northfield, MN MISA 22100 Farmington, MO MISA 22140 Farmington, NM MSA 22180 Fayetteville, NC MSA 22220 Fayetteville-Springdale-Rogers, AR-MO MSA 22260 Fergus Falls, MN MISA 22280 Fernley, NV MISA 22300 Findlay, OH MISA 22340 Fitzgerald, GA MISA 22380 Flagstaff, AZ MSA 22420 Flint, MI MSA 22500 Florence, SC MSA 22520 Florence-Muscle Shoals, AL MSA 22540 Fond du Lac, WI MSA 22580 Forest City, NC MISA 22620 Forrest City, AR MISA 22660 Fort Collins, CO MSA 22700 Fort Dodge, IA MISA 22780 Fort Leonard Wood, MO MISA 22800 Fort Madison-Keokuk, IA-IL-MO MISA 22820 Fort Morgan, CO MISA 22840 Fort Payne, AL MISA 22860 Fort Polk South, LA MISA 22900 Fort Smith, AR-OK MSA 23060 Fort Wayne, IN MSA 23140 Frankfort, IN MISA 23180 Frankfort, KY MISA 23240 Fredericksburg, TX MISA 23300 Freeport, IL MISA 23340 Fremont, NE MISA 23380 Fremont, OH MISA 23420 Fresno, CA MSA 23460 Gadsden, AL MSA 23500 Gaffney, SC MISA 23540 Gainesville, FL MSA 23580 Gainesville, GA MSA 23620 Gainesville, TX MISA 23660 Galesburg, IL MISA 23700 Gallup, NM MISA 23780 Garden City, KS MISA 23820 Gardnerville Ranchos, NV MISA 23860 Georgetown, SC MISA 23900 Gettysburg, PA MSA 23940 Gillette, WY MISA 23980 Glasgow, KY MISA 24020 Glens Falls, NY MSA 24060 Glenwood Springs, CO MISA 24100 Gloversville, NY MISA 24140 Goldsboro, NC MSA 24220 Grand Forks, ND-MN MSA 24260 Grand Island, NE MSA 24300 Grand Junction, CO MSA 24330 Grand Rapids, MN MISA 24340 Grand Rapids-Wyoming, MI MSA 24380 Grants, NM MISA 24420 Grants Pass, OR MSA 24460 Great Bend, KS MISA 24500 Great Falls, MT MSA 24540 Greeley, CO MSA 24580 Green Bay, WI MSA 24620 Greeneville, TN MISA 24640 Greenfield Town, MA MISA 24660 Greensboro-High Point, NC MSA 24700 Greensburg, IN MISA 24740 Greenville, MS MISA 24780 Greenville, NC MSA 24820 Greenville, OH MISA 24860 Greenville-Anderson-Mauldin, SC MSA 24900 Greenwood, MS MISA 24940 Greenwood, SC MISA 24980 Grenada, MS MISA 25060 Gulfport-Biloxi-Pascagoula, MS MSA 25100 Guymon, OK MISA 25180 Hagerstown-Martinsburg, MD-WV MSA 25200 Hailey, ID MISA 25220 Hammond, LA MSA 25260 Hanford-Corcoran, CA MSA 25300 Hannibal, MO MISA 25420 Harrisburg-Carlisle, PA MSA 25460 Harrison, AR MISA 25500 Harrisonburg, VA MSA 25540 Hartford-West Hartford-East Hartford, CT MSA 25580 Hastings, NE MISA 25620 Hattiesburg, MS MSA 25700 Hays, KS MISA 25720 Heber, UT MISA 25740 Helena, MT MISA 25760 Helena-West Helena, AR MISA 25780 Henderson, NC MISA 25820 Hereford, TX MISA 25840 Hermiston-Pendleton, OR MISA 25860 Hickory-Lenoir-Morganton, NC MSA 25880 Hillsdale, MI MISA 25900 Hilo, HI MISA 25940 Hilton Head Island-Bluffton-Beaufort, SC MSA 25980 Hinesville, GA MSA 26020 Hobbs, NM MISA 26090 Holland, MI MISA 26140 Homosassa Springs, FL MSA 26220 Hood River, OR MISA 26260 Hope, AR MISA 26300 Hot Springs, AR MSA 26340 Houghton, MI MISA 26380 Houma-Thibodaux, LA MSA 26420 Houston-The Woodlands-Sugar Land, TX MSA 26460 Hudson, NY MISA 26500 Huntingdon, PA MISA 26540 Huntington, IN MISA 26580 Huntington-Ashland, WV-KY-OH MSA 26620 Huntsville, AL MSA 26660 Huntsville, TX MISA 26700 Huron, SD MISA 26740 Hutchinson, KS MISA 26780 Hutchinson, MN MISA 26820 Idaho Falls, ID MSA 26860 Indiana, PA MISA 26900 Indianapolis-Carmel-Anderson, IN MSA 26940 Indianola, MS MISA 26960 Ionia, MI MISA 26980 Iowa City, IA MSA 27020 Iron Mountain, MI-WI MISA 27060 Ithaca, NY MSA 27100 Jackson, MI MSA 27140 Jackson, MS MSA 27160 Jackson, OH MISA 27180 Jackson, TN MSA 27220 Jackson, WY-ID MISA 27260 Jacksonville, FL MSA 27300 Jacksonville, IL MISA 27340 Jacksonville, NC MSA 27380 Jacksonville, TX MISA 27420 Jamestown, ND MISA 27460 Jamestown-Dunkirk-Fredonia, NY MISA 27500 Janesville-Beloit, WI MSA 27540 Jasper, IN MISA 27600 Jefferson, GA MISA 27620 Jefferson City, MO MSA 27660 Jennings, LA MISA 27700 Jesup, GA MISA 27740 Johnson City, TN MSA 27780 Johnstown, PA MSA 27860 Jonesboro, AR MSA 27900 Joplin, MO MSA 27920 Junction City, KS MISA 27940 Juneau, AK MISA 27980 Kahului-Wailuku-Lahaina, HI MSA 28020 Kalamazoo-Portage, MI MSA 28060 Kalispell, MT MISA 28100 Kankakee, IL MSA 28140 Kansas City, MO-KS MSA 28180 Kapaa, HI MISA 28260 Kearney, NE MISA 28300 Keene, NH MISA 28340 Kendallville, IN MISA 28380 Kennett, MO MISA 28420 Kennewick-Richland, WA MSA 28500 Kerrville, TX MISA 28540 Ketchikan, AK MISA 28580 Key West, FL MISA 28620 Kill Devil Hills, NC MISA 28660 Killeen-Temple, TX MSA 28700 Kingsport-Bristol-Bristol, TN-VA MSA 28740 Kingston, NY MSA 28780 Kingsville, TX MISA 28820 Kinston, NC MISA 28860 Kirksville, MO MISA 28900 Klamath Falls, OR MISA 28940 Knoxville, TN MSA 29020 Kokomo, IN MSA 29060 Laconia, NH MISA 29100 La Crosse-Onalaska, WI-MN MSA 29180 Lafayette, LA MSA 29200 Lafayette-West Lafayette, IN MSA 29260 La Grande, OR MISA 29300 LaGrange, GA MISA 29340 Lake Charles, LA MSA 29380 Lake City, FL MISA 29420 Lake Havasu City-Kingman, AZ MSA 29460 Lakeland-Winter Haven, FL MSA 29500 Lamesa, TX MISA 29540 Lancaster, PA MSA 29620 Lansing-East Lansing, MI MSA 29660 Laramie, WY MISA 29700 Laredo, TX MSA 29740 Las Cruces, NM MSA 29780 Las Vegas, NM MISA 29820 Las Vegas-Henderson-Paradise, NV MSA 29860 Laurel, MS MISA 29900 Laurinburg, NC MISA 29940 Lawrence, KS MSA 29980 Lawrenceburg, TN MISA 30020 Lawton, OK MSA 30060 Lebanon, MO MISA 30140 Lebanon, PA MSA 30220 Levelland, TX MISA 30260 Lewisburg, PA MISA 30280 Lewisburg, TN MISA 30300 Lewiston, ID-WA MSA 30340 Lewiston-Auburn, ME MSA 30380 Lewistown, PA MISA 30420 Lexington, NE MISA 30460 Lexington-Fayette, KY MSA 30580 Liberal, KS MISA 30620 Lima, OH MSA 30660 Lincoln, IL MISA 30700 Lincoln, NE MSA 30780 Little Rock-North Little Rock-Conway, AR MSA 30820 Lock Haven, PA MISA 30860 Logan, UT-ID MSA 30880 Logan, WV MISA 30900 Logansport, IN MISA 30940 London, KY MISA 30980 Longview, TX MSA 31020 Longview, WA MSA 31060 Los Alamos, NM MISA 31080 Los Angeles-Long Beach-Anaheim, CA MSA 31140 Louisville/Jefferson County, KY-IN MSA 31180 Lubbock, TX MSA 31220 Ludington, MI MISA 31260 Lufkin, TX MISA 31300 Lumberton, NC MISA 31340 Lynchburg, VA MSA 31380 Macomb, IL MISA 31420 Macon-Bibb County, GA MSA 31460 Madera, CA MSA 31500 Madison, IN MISA 31540 Madison, WI MSA 31580 Madisonville, KY MISA 31620 Magnolia, AR MISA 31660 Malone, NY MISA 31680 Malvern, AR MISA 31700 Manchester-Nashua, NH MSA 31740 Manhattan, KS MSA 31820 Manitowoc, WI MISA 31860 Mankato-North Mankato, MN MSA 31900 Mansfield, OH MSA 31930 Marietta, OH MISA 31940 Marinette, WI-MI MISA 31980 Marion, IN MISA 32000 Marion, NC MISA 32020 Marion, OH MISA 32100 Marquette, MI MISA 32140 Marshall, MN MISA 32180 Marshall, MO MISA 32220 Marshall, TX MISA 32260 Marshalltown, IA MISA 32280 Martin, TN MISA 32300 Martinsville, VA MISA 32340 Maryville, MO MISA 32380 Mason City, IA MISA 32460 Mayfield, KY MISA 32500 Maysville, KY MISA 32540 McAlester, OK MISA 32580 McAllen-Edinburg-Mission, TX MSA 32620 McComb, MS MISA 32660 McMinnville, TN MISA 32700 McPherson, KS MISA 32740 Meadville, PA MISA 32780 Medford, OR MSA 32820 Memphis, TN-MS-AR MSA 32860 Menomonie, WI MISA 32900 Merced, CA MSA 32940 Meridian, MS MISA 32980 Merrill, WI MISA 33020 Mexico, MO MISA 33060 Miami, OK MISA 33100 Miami-Fort Lauderdale-West Palm Beach, FL MSA 33140 Michigan City-La Porte, IN MSA 33180 Middlesborough, KY MISA 33220 Midland, MI MSA 33260 Midland, TX MSA 33300 Milledgeville, GA MISA 33340 Milwaukee-Waukesha-West Allis, WI MSA 33420 Mineral Wells, TX MISA 33460 Minneapolis-St. Paul-Bloomington, MN-WI MSA 33500 Minot, ND MISA 33540 Missoula, MT MSA 33580 Mitchell, SD MISA 33620 Moberly, MO MISA 33660 Mobile, AL MSA 33700 Modesto, CA MSA 33740 Monroe, LA MSA 33780 Monroe, MI MSA 33860 Montgomery, AL MSA 33940 Montrose, CO MISA 33980 Morehead City, NC MISA 34020 Morgan City, LA MISA 34060 Morgantown, WV MSA 34100 Morristown, TN MSA 34140 Moscow, ID MISA 34180 Moses Lake, WA MISA 34220 Moultrie, GA MISA 34260 Mountain Home, AR MISA 34300 Mountain Home, ID MISA 34340 Mount Airy, NC MISA 34380 Mount Pleasant, MI MISA 34420 Mount Pleasant, TX MISA 34460 Mount Sterling, KY MISA 34500 Mount Vernon, IL MISA 34540 Mount Vernon, OH MISA 34580 Mount Vernon-Anacortes, WA MSA 34620 Muncie, IN MSA 34660 Murray, KY MISA 34700 Muscatine, IA MISA 34740 Muskegon, MI MSA 34780 Muskogee, OK MISA 34820 Myrtle Beach-Conway-North Myrtle Beach, SC-NC MSA 34860 Nacogdoches, TX MISA 34900 Napa, CA MSA 34940 Naples-Immokalee-Marco Island, FL MSA 34980 Nashville-Davidson--Murfreesboro--Franklin, TN MSA 35020 Natchez, MS-LA MISA 35060 Natchitoches, LA MISA 35100 New Bern, NC MSA 35140 Newberry, SC MISA 35220 New Castle, IN MISA 35260 New Castle, PA MISA 35300 New Haven-Milford, CT MSA 35380 New Orleans-Metairie, LA MSA 35420 New Philadelphia-Dover, OH MISA 35440 Newport, OR MISA 35460 Newport, TN MISA 35500 Newton, IA MISA 35580 New Ulm, MN MISA 35620 New York-Newark-Jersey City, NY-NJ-PA MSA 35660 Niles-Benton Harbor, MI MSA 35700 Nogales, AZ MISA 35740 Norfolk, NE MISA 35820 North Platte, NE MISA 35840 North Port-Sarasota-Bradenton, FL MSA 35860 North Vernon, IN MISA 35900 North Wilkesboro, NC MISA 35940 Norwalk, OH MISA 35980 Norwich-New London, CT MSA 36020 Oak Harbor, WA MISA 36100 Ocala, FL MSA 36140 Ocean City, NJ MSA 36220 Odessa, TX MSA 36260 Ogden-Clearfield, UT MSA 36300 Ogdensburg-Massena, NY MISA 36340 Oil City, PA MISA 36380 Okeechobee, FL MISA 36420 Oklahoma City, OK MSA 36460 Olean, NY MISA 36500 Olympia-Tumwater, WA MSA 36540 Omaha-Council Bluffs, NE-IA MSA 36580 Oneonta, NY MISA 36620 Ontario, OR-ID MISA 36660 Opelousas, LA MISA 36700 Orangeburg, SC MISA 36740 Orlando-Kissimmee-Sanford, FL MSA 36780 Oshkosh-Neenah, WI MSA 36820 Oskaloosa, IA MISA 36830 Othello, WA MISA 36840 Ottawa, KS MISA 36860 Ottawa-Peru, IL MISA 36900 Ottumwa, IA MISA 36940 Owatonna, MN MISA 36980 Owensboro, KY MSA 37020 Owosso, MI MISA 37060 Oxford, MS MISA 37080 Oxford, NC MISA 37100 Oxnard-Thousand Oaks-Ventura, CA MSA 37120 Ozark, AL MISA 37140 Paducah, KY-IL MISA 37220 Pahrump, NV MISA 37260 Palatka, FL MISA 37300 Palestine, TX MISA 37340 Palm Bay-Melbourne-Titusville, FL MSA 37420 Pampa, TX MISA 37460 Panama City, FL MSA 37500 Paragould, AR MISA 37540 Paris, TN MISA 37580 Paris, TX MISA 37620 Parkersburg-Vienna, WV MSA 37660 Parsons, KS MISA 37740 Payson, AZ MISA 37780 Pecos, TX MISA 37800 Pella, IA MISA 37860 Pensacola-Ferry Pass-Brent, FL MSA 37900 Peoria, IL MSA 37940 Peru, IN MISA 37980 Philadelphia-Camden-Wilmington, PA-NJ-DE-MD MSA 38060 Phoenix-Mesa-Scottsdale, AZ MSA 38100 Picayune, MS MISA 38180 Pierre, SD MISA 38220 Pine Bluff, AR MSA 38240 Pinehurst-Southern Pines, NC MISA 38260 Pittsburg, KS MISA 38300 Pittsburgh, PA MSA 38340 Pittsfield, MA MSA 38380 Plainview, TX MISA 38420 Platteville, WI MISA 38460 Plattsburgh, NY MISA 38500 Plymouth, IN MISA 38540 Pocatello, ID MSA 38580 Point Pleasant, WV-OH MISA 38620 Ponca City, OK MISA 38700 Pontiac, IL MISA 38740 Poplar Bluff, MO MISA 38780 Portales, NM MISA 38820 Port Angeles, WA MISA 38840 Port Clinton, OH MISA 38860 Portland-South Portland, ME MSA 38900 Portland-Vancouver-Hillsboro, OR-WA MSA 38920 Port Lavaca, TX MISA 38940 Port St. Lucie, FL MSA 39020 Portsmouth, OH MISA 39060 Pottsville, PA MISA 39140 Prescott, AZ MSA 39220 Price, UT MISA 39260 Prineville, OR MISA 39300 Providence-Warwick, RI-MA MSA 39340 Provo-Orem, UT MSA 39380 Pueblo, CO MSA 39420 Pullman, WA MISA 39460 Punta Gorda, FL MSA 39500 Quincy, IL-MO MISA 39540 Racine, WI MSA 39580 Raleigh, NC MSA 39660 Rapid City, SD MSA 39700 Raymondville, TX MISA 39740 Reading, PA MSA 39780 Red Bluff, CA MISA 39820 Redding, CA MSA 39860 Red Wing, MN MISA 39900 Reno, NV MSA 39940 Rexburg, ID MISA 39980 Richmond, IN MISA 40060 Richmond, VA MSA 40080 Richmond-Berea, KY MISA 40100 Rio Grande City, TX MISA 40140 Riverside-San Bernardino-Ontario, CA MSA 40180 Riverton, WY MISA 40220 Roanoke, VA MSA 40260 Roanoke Rapids, NC MISA 40300 Rochelle, IL MISA 40340 Rochester, MN MSA 40380 Rochester, NY MSA 40420 Rockford, IL MSA 40460 Rockingham, NC MISA 40540 Rock Springs, WY MISA 40580 Rocky Mount, NC MSA 40620 Rolla, MO MISA 40660 Rome, GA MSA 40700 Roseburg, OR MISA 40740 Roswell, NM MISA 40760 Ruidoso, NM MISA 40780 Russellville, AR MISA 40820 Ruston, LA MISA 40860 Rutland, VT MISA 40900 Sacramento--Roseville--Arden-Arcade, CA MSA 40940 Safford, AZ MISA 40980 Saginaw, MI MSA 41060 St. Cloud, MN MSA 41100 St. George, UT MSA 41140 St. Joseph, MO-KS MSA 41180 St. Louis, MO-IL MSA 41220 St. Marys, GA MISA 41260 St. Marys, PA MISA 41400 Salem, OH MISA 41420 Salem, OR MSA 41460 Salina, KS MISA 41500 Salinas, CA MSA 41540 Salisbury, MD-DE MSA 41620 Salt Lake City, UT MSA 41660 San Angelo, TX MSA 41700 San Antonio-New Braunfels, TX MSA 41740 San Diego-Carlsbad, CA MSA 41760 Sandpoint, ID MISA 41780 Sandusky, OH MISA 41820 Sanford, NC MISA 41860 San Francisco-Oakland-Hayward, CA MSA 41940 San Jose-Sunnyvale-Santa Clara, CA MSA 42020 San Luis Obispo-Paso Robles-Arroyo Grande, CA MSA 42100 Santa Cruz-Watsonville, CA MSA 42140 Santa Fe, NM MSA 42200 Santa Maria-Santa Barbara, CA MSA 42220 Santa Rosa, CA MSA 42300 Sault Ste. Marie, MI MISA 42340 Savannah, GA MSA 42380 Sayre, PA MISA 42420 Scottsbluff, NE MISA 42460 Scottsboro, AL MISA 42540 Scranton--Wilkes-Barre--Hazleton, PA MSA 42620 Searcy, AR MISA 42660 Seattle-Tacoma-Bellevue, WA MSA 42680 Sebastian-Vero Beach, FL MSA 42700 Sebring, FL MSA 42740 Sedalia, MO MISA 42780 Selinsgrove, PA MISA 42820 Selma, AL MISA 42860 Seneca, SC MISA 42900 Seneca Falls, NY MISA 42940 Sevierville, TN MISA 42980 Seymour, IN MISA 43020 Shawano, WI MISA 43060 Shawnee, OK MISA 43100 Sheboygan, WI MSA 43140 Shelby, NC MISA 43180 Shelbyville, TN MISA 43220 Shelton, WA MISA 43260 Sheridan, WY MISA 43300 Sherman-Denison, TX MSA 43320 Show Low, AZ MISA 43340 Shreveport-Bossier City, LA MSA 43380 Sidney, OH MISA 43420 Sierra Vista-Douglas, AZ MSA 43460 Sikeston, MO MISA 43500 Silver City, NM MISA 43580 Sioux City, IA-NE-SD MSA 43620 Sioux Falls, SD MSA 43660 Snyder, TX MISA 43700 Somerset, KY MISA 43740 Somerset, PA MISA 43760 Sonora, CA MISA 43780 South Bend-Mishawaka, IN-MI MSA 43900 Spartanburg, SC MSA 43940 Spearfish, SD MISA 43980 Spencer, IA MISA 44020 Spirit Lake, IA MISA 44060 Spokane-Spokane Valley, WA MSA 44100 Springfield, IL MSA 44140 Springfield, MA MSA 44180 Springfield, MO MSA 44220 Springfield, OH MSA 44260 Starkville, MS MISA 44300 State College, PA MSA 44340 Statesboro, GA MISA 44420 Staunton-Waynesboro, VA MSA 44460 Steamboat Springs, CO MISA 44500 Stephenville, TX MISA 44540 Sterling, CO MISA 44580 Sterling, IL MISA 44620 Stevens Point, WI MISA 44660 Stillwater, OK MISA 44700 Stockton-Lodi, CA MSA 44740 Storm Lake, IA MISA 44780 Sturgis, MI MISA 44860 Sulphur Springs, TX MISA 44900 Summerville, GA MISA 44920 Summit Park, UT MISA 44940 Sumter, SC MSA 44980 Sunbury, PA MISA 45000 Susanville, CA MISA 45020 Sweetwater, TX MISA 45060 Syracuse, NY MSA 45140 Tahlequah, OK MISA 45180 Talladega-Sylacauga, AL MISA 45220 Tallahassee, FL MSA 45300 Tampa-St. Petersburg-Clearwater, FL MSA 45340 Taos, NM MISA 45380 Taylorville, IL MISA 45460 Terre Haute, IN MSA 45500 Texarkana, TX-AR MSA 45520 The Dalles, OR MISA 45540 The Villages, FL MSA 45580 Thomaston, GA MISA 45620 Thomasville, GA MISA 45660 Tiffin, OH MISA 45700 Tifton, GA MISA 45740 Toccoa, GA MISA 45780 Toledo, OH MSA 45820 Topeka, KS MSA 45860 Torrington, CT MISA 45900 Traverse City, MI MISA 45940 Trenton, NJ MSA 45980 Troy, AL MISA 46020 Truckee-Grass Valley, CA MISA 46060 Tucson, AZ MSA 46100 Tullahoma-Manchester, TN MISA 46140 Tulsa, OK MSA 46180 Tupelo, MS MISA 46220 Tuscaloosa, AL MSA 46300 Twin Falls, ID MISA 46340 Tyler, TX MSA 46380 Ukiah, CA MISA 46460 Union City, TN-KY MISA 46500 Urbana, OH MISA 46520 Urban Honolulu, HI MSA 46540 Utica-Rome, NY MSA 46620 Uvalde, TX MISA 46660 Valdosta, GA MSA 46700 Vallejo-Fairfield, CA MSA 46740 Valley, AL MISA 46780 Van Wert, OH MISA 46820 Vermillion, SD MISA 46860 Vernal, UT MISA 46900 Vernon, TX MISA 46980 Vicksburg, MS MISA 47020 Victoria, TX MSA 47080 Vidalia, GA MISA 47180 Vincennes, IN MISA 47220 Vineland-Bridgeton, NJ MSA 47240 Vineyard Haven, MA MISA 47260 Virginia Beach-Norfolk-Newport News, VA-NC MSA 47300 Visalia-Porterville, CA MSA 47340 Wabash, IN MISA 47380 Waco, TX MSA 47420 Wahpeton, ND-MN MISA 47460 Walla Walla, WA MSA 47540 Wapakoneta, OH MISA 47580 Warner Robins, GA MSA 47620 Warren, PA MISA 47660 Warrensburg, MO MISA 47700 Warsaw, IN MISA 47780 Washington, IN MISA 47820 Washington, NC MISA 47900 Washington-Arlington-Alexandria, DC-VA-MD-WV MSA 47920 Washington Court House, OH MISA 47940 Waterloo-Cedar Falls, IA MSA 47980 Watertown, SD MISA 48020 Watertown-Fort Atkinson, WI MISA 48060 Watertown-Fort Drum, NY MSA 48100 Wauchula, FL MISA 48140 Wausau, WI MSA 48180 Waycross, GA MISA 48220 Weatherford, OK MISA 48260 Weirton-Steubenville, WV-OH MSA 48300 Wenatchee, WA MSA 48460 West Plains, MO MISA 48500 West Point, MS MISA 48540 Wheeling, WV-OH MSA 48580 Whitewater-Elkhorn, WI MISA 48620 Wichita, KS MSA 48660 Wichita Falls, TX MSA 48700 Williamsport, PA MSA 48780 Williston, ND MISA 48820 Willmar, MN MISA 48900 Wilmington, NC MSA 48940 Wilmington, OH MISA 48980 Wilson, NC MISA 49020 Winchester, VA-WV MSA 49080 Winnemucca, NV MISA 49100 Winona, MN MISA 49180 Winston-Salem, NC MSA 49220 Wisconsin Rapids-Marshfield, WI MISA 49260 Woodward, OK MISA 49300 Wooster, OH MISA 49340 Worcester, MA-CT MSA 49380 Worthington, MN MISA 49420 Yakima, WA MSA 49460 Yankton, SD MISA 49620 York-Hanover, PA MSA 49660 Youngstown-Warren-Boardman, OH-PA MSA 49700 Yuba City, CA MSA 49740 Yuma, AZ MSA 49780 Zanesville, OH MISA 49820 Zapata, TX MISA |
Counties are labeled with county name and state-county FIPS code.
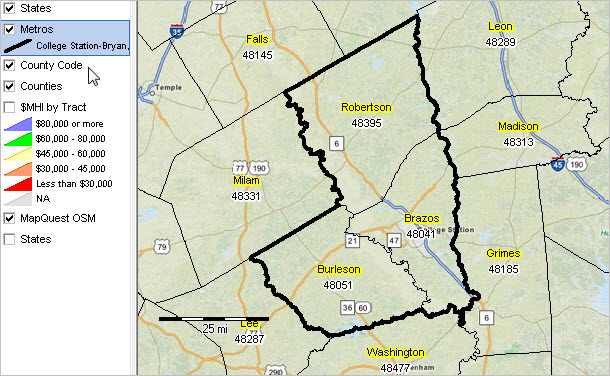
View developed with CV XE GIS software. See this section to learn about making custom metro maps.
3.2. Patterns of Economic Prosperity by Neighborhood go top
Median household income by census tract (see color/data legend at left of map).
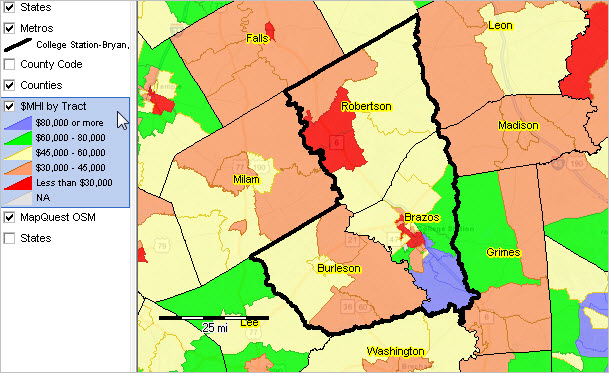
View developed with CV XE GIS software. See this section to learn about making custom metro maps.
Population and Components of Change by Year
| Area | 7/1/2010 | 7/1/2011 | 7/1/2012 | 7/1/2013 | 7/1/2014 | 7/1/2015 | 7/1/2016 | 7/1/2017 | 7/1/2018 | 2010-18 Change | 2010-18%/Avg |
| Total population | 229,453 | 231,396 | 234,146 | 237,840 | 242,888 | 250,765 | 254,825 | 258,825 | 262,431 | 32,978 | 14.4 |
| Births | 3,006 | 2,980 | 3,045 | 3,094 | 3,314 | 3,263 | 3,220 | 3,163 | 25,085 | 3,584 | |
| Deaths | 1,203 | 1,245 | 1,303 | 1,343 | 1,484 | 1,433 | 1,377 | 1,475 | 10,863 | 1,552 | |
| -- Natural Increase | 1,803 | 1,735 | 1,742 | 1,751 | 1,830 | 1,830 | 1,843 | 1,688 | 14,222 | 2,032 | |
| Net Migration | 122 | 1,032 | 1,957 | 3,281 | 5,974 | 2,232 | 2,161 | 1,915 | 18,674 | 2,668 | |
| -- Intl Migration | 1,158 | 1,362 | 1,350 | 1,787 | 1,816 | 1,694 | 1,665 | 1,670 | 12,502 | 1,786 | |
| -- Domestic Migration | -1,036 | -330 | 607 | 1,494 | 4,158 | 538 | 496 | 245 | 6,172 | 882 |
4.1. Component City Characteristics go top
Principal Cities (about principal cities); Click link to view city profile.
The largest city in each metropolitan area is designated a "principal city." Additional cities qualify if specified requirements are met concerning population size and employment. The title of each metropolitan area consists of the names of up to three of its principal cities and the name of each state into which the metropolitan area extends.
Principal Cities with 2017 Population and Rank (among all 19,508 cities)
| City Name | 2017 Population | U.S. City Rank |
| Bryan | 84,021 | 403 |
| College Station | 113,564 | 253 |
Cities are places of population concentration. Incorporated cities have governmental powers assigned by the corresponding state. Metros, or CBSAs, contain one or more incorporated city. The Census Bureau develops annual estimates of the population for all cities using a model-based estimation procedure (in contrast to sample survey-based population estimates developed through the American Comunity Survey (ACS). The model based estimates developed for all cities time lag of only a little over a year. In contrast, the ACS-based estimates for cities under 65,000 population have a time lag of four years and are estimates for a 5-year time period. For example, in January 2019, the 7/1/17 estimates are the most recent model-based population data for all cities, whereas the 2017 ACS estimates (centric to mid-2015) are the recent ACS-survey population estimates available for all cities.
Cities 10,000 population and over; click link to view city profile.
| Area | 7/1/2010 | 7/1/2011 | 7/1/2012 | 7/1/2013 | 7/1/2014 | 7/1/2015 | 7/1/2016 | 7/1/2017 | Chg 10-17 | %Chg 10-17 |
| Bryan, TX (4810912) | 76,520 | 77,187 | 77,826 | 78,984 | 80,606 | 81,955 | 83,188 | 84,021 | 7,501 | 9.8 |
| College Station, TX (4815976) | 94,655 | 95,711 | 97,769 | 100,588 | 103,312 | 108,731 | 110,908 | 113,564 | 18,909 | 20.0 |
All places interactive table -- 2010-2017 model-based time series population estimates.
| Metropolitan areas are defined as one or more contiguous counties/county equivalent areas based on a set of demographic-economic criteria. Counties and county equivalent areas comprising the metro are shown below. For multi-county metros, this section provides insights into how the population is changing by county. Many metros changed geographic composition (counties included in the metro) between the Census 2010 vintage and the current vintage. hese changes, if any, are also shown below (county is marked with **). Click county code link to view county components of change. |
| Area | 7/1/2010 | 7/1/2011 | 7/1/2012 | 7/1/2013 | 7/1/2014 | 7/1/2015 | 7/1/2016 | 7/1/2017 | 7/1/2018 | Chg 10-18 | %Chg 10-18 |
| Brazos County, TX (48041) | 195,663 | 197,416 | 200,261 | 204,141 | 209,030 | 216,450 | 220,156 | 223,572 | 226,758 | 31,095 | 15.9 |
| Burleson County, TX (48051) | 17,236 | 17,324 | 17,431 | 17,269 | 17,390 | 17,614 | 17,855 | 18,068 | 18,389 | 1,153 | 6.7 |
| Robertson County, TX (48395) | 16,554 | 16,656 | 16,454 | 16,430 | 16,468 | 16,701 | 16,814 | 17,185 | 17,284 | 730 | 4.4 |
All counties demographic-economic interactive tables General Demographics | Social | Economic | Housing
All counties time series population estimates: 2010-2018 interactive table.
- based on Census American Community Survey 1-year estimates; http://proximityone.com/acs2017.htm
- see related all ACS 2017 1 year metros General Demographic Characteristics interactive table: http://proximityone.com/cbsa171dp1.htm
| Item | 2016 | 2017 | Chg16-17 | %Chg16-17 |
| Total population | 254,716 | 258,860 | 4,144 | 1.6 |
| Male | 129,018 | 130,281 | 1,263 | 1.0 |
| Female | 125,698 | 128,579 | 2,881 | 2.3 |
| Under 5 years | 15,263 | 16,630 | 1,367 | 9.0 |
| 5 to 9 years | 14,982 | 14,386 | -596 | -4.0 |
| 10 to 14 years | 15,145 | 16,099 | 954 | 6.3 |
| 15 to 19 years | 26,267 | 27,354 | 1,087 | 4.1 |
| 20 to 24 years | 43,097 | 43,936 | 839 | 1.9 |
| 25 to 34 years | 39,883 | 38,617 | -1,266 | -3.2 |
| 35 to 44 years | 26,680 | 28,849 | 2,169 | 8.1 |
| 45 to 54 years | 25,092 | 23,372 | -1,720 | -6.9 |
| 55 to 59 years | 11,273 | 11,146 | -127 | -1.1 |
| 60 to 64 years | 10,967 | 12,667 | 1,700 | 15.5 |
| 65 to 74 years | 15,803 | 14,691 | -1,112 | -7.0 |
| 75 to 84 years | 7,341 | 7,192 | -149 | -2.0 |
| 85 years and over | 2,923 | 3,921 | 998 | 34.1 |
| Median age (years) | 27.4 | 27.4 | 0.0 | 0.0 |
| 18 years and over | 201,679 | 203,078 | 1,399 | 0.7 |
| 21 years and over | 169,533 | 170,203 | 670 | 0.4 |
| 62 years and over | 32,982 | 32,419 | -563 | -1.7 |
| 65 years and over | 26,067 | 25,804 | -263 | -1.0 |
| Race/Origin | ||||
| One race | 245,992 | 251,275 | 5,283 | 2.1 |
| White | 192,794 | 202,586 | 9,792 | 5.1 |
| Black or African American | 29,218 | 28,542 | -676 | -2.3 |
| American Indian and Alaska Native | 1,129 | 598 | -531 | -47.0 |
| Asian | 14,143 | 13,175 | -968 | -6.8 |
| Native Hawaiian and Other Pacific Islander | 107 | 33 | -74 | -69.2 |
| Some other race | 8,601 | 6,341 | -2,260 | -26.3 |
| Two or more races | 8,724 | 7,585 | -1,139 | -13.1 |
| Hispanic or Latino (of any race) | 61,827 | 65,074 | 3,247 | 5.3 |
| Mexican | 55,463 | 56,928 | 1,465 | 2.6 |
| Not Hispanic or Latino | 192,889 | 193,786 | 897 | 0.5 |
| White alone� | 144,681 | 147,026 | 2,345 | 1.6 |
| Black or African American alone | 28,992 | 27,684 | -1,308 | -4.5 |
| Citizen, 18 and over | 181,374 | 183,494 | 2,120 | 1.2 |
| Male | 90,031 | 90,606 | 575 | 0.6 |
| Female | 91,343 | 92,888 | 1,545 | 1.7 |
5.1. Total Housing Units - goto top
Housing unit estimates shown in section 5.1. are model-based estimates developed by the Census Bureau annually. These estimates may differ some from ACS-based estimates shown in section 5.2. The model-based estimates are available in advance of the ACS-based data and developed using a different method. Unlike the ACS-based 1-year estimates, the model-based estimates are available for all counties and metros.
| Item | 7/1/2010 | 7/1/2011 | 7/1/2012 | 7/1/2013 | 7/1/2014 | 7/1/2015 | 7/1/2016 | 7/1/2017 | Chg 10-17 | %Chg 10-17 |
| Total Housing Units | 95,224 | 96,193 | 97,617 | 99,616 | 101,300 | 103,151 | 104,860 | 107,722 | 12,498 | 13.1 |
See related time series housing estimates interactive table.
- based on Census American Community Survey 1-year estimates; http://proximityone.com/acs2017.htm
- see related all ACS 2017 1 year metros Housing Characteristics interactive table: http://proximityone.com/cbsa171dp4.htm
| Item | 2016 | 2017 | Chg16-17 | %Chg16-17 |
| Total housing units | 104,701 | 107,734 | 3,033 | 2.9 |
| Occupied housing units (households) | 91,033 | 91,999 | 966 | 1.1 |
| Vacant housing units | 13,668 | 15,735 | 2,067 | 15.1 |
| Homeowner vacancy rate | 0.80 | 0.90 | 0.10 | 12.5 |
| Rental vacancy rate | 3.90 | 11.40 | 7.50 | 192.3 |
| Units in Structure | ||||
| 1-unit, detached | 55,806 | 54,922 | -884 | -1.6 |
| 1-unit, attached | 4,339 | 3,582 | -757 | -17.4 |
| 2 units | 4,815 | 4,672 | -143 | -3.0 |
| 3 or 4 units | 8,016 | 7,609 | -407 | -5.1 |
| 5 to 9 units | 6,083 | 7,204 | 1,121 | 18.4 |
| 10 to 19 units | 7,209 | 9,416 | 2,207 | 30.6 |
| 20 or more units | 8,026 | 7,462 | -564 | -7.0 |
| Mobile home | 10,308 | 12,391 | 2,083 | 20.2 |
| Boat, RV, van, etc. | 99 | 476 | 377 | 380.8 |
| Year Structure Built | ||||
| Built 2014 or later | 4,606 | 5,026 | 420 | 9.1 |
| Built 2010 or 2013 | 5,647 | 8,841 | 3,194 | 56.6 |
| Built 2000 to 2009 | 23,100 | 20,701 | -2,399 | -10.4 |
| Built 1990 to 1999 | 18,613 | 22,097 | 3,484 | 18.7 |
| Built 1980 to 1989 | 20,331 | 16,610 | -3,721 | -18.3 |
| Built 1970 to 1979 | 18,059 | 16,835 | -1,224 | -6.8 |
| Built 1960 to 1969 | 4,956 | 6,145 | 1,189 | 24.0 |
| Built 1950 to 1959 | 5,174 | 5,926 | 752 | 14.5 |
| Built 1940 to 1949 | 2,065 | 2,746 | 681 | 33.0 |
| Built 1939 or earlier | 2,150 | 2,807 | 657 | 30.6 |
| Total housing units - Median rooms | 5 | 5 | 0 | -3.8 |
| Occupied housing units - Owner-occupied | 45,941 | 48,762 | 2,821 | 6.1 |
| Occupied housing units - Renter-occupied | 45,092 | 43,237 | -1,855 | -4.1 |
| Average household size of owner-occupied unit | 2.74 | 2.77 | 0.03 | 1.1 |
| Average household size of renter-occupied unit | 2.50 | 2.47 | -0.03 | -1.2 |
| Year Moved into Unit; Occupied Housing Units | ||||
| Moved in 2015 or later | 31,857 | 40,481 | 8,624 | 27.1 |
| Moved in 2010 to 2014 | 25,088 | 17,197 | -7,891 | -31.5 |
| Moved in 2000 to 2009 | 18,417 | 18,506 | 89 | 0.5 |
| Moved in 1990 to 1999 | 9,162 | 8,606 | -556 | -6.1 |
| Moved in 1980 to 1989 | 3,714 | 4,869 | 1,155 | 31.1 |
| Moved in 1979 or earlier | 2,795 | 2,340 | -455 | -16.3 |
| Year Vehicles; Occupied Housing Units | ||||
| No vehicles available | 5,438 | 4,635 | -803 | -14.8 |
| 1 vehicle available | 29,339 | 33,088 | 3,749 | 12.8 |
| 2 vehicles available | 33,742 | 33,142 | -600 | -1.8 |
| 3 or more vehicles available | 22,514 | 21,134 | -1,380 | -6.1 |
| House Heating; Occupied Housing Units | ||||
| Utility gas | 30,350 | 27,997 | -2,353 | -7.8 |
| Bottled, tank, or LP gas | 3,381 | 3,598 | 217 | 6.4 |
| Electricity | 56,106 | 59,643 | 3,537 | 6.3 |
| Fuel oil, kerosene, etc. | 0 | 0 | 0 | ... |
| Coal or coke | 121 | 0 | -121 | -100.0 |
| Wood | 598 | 246 | -352 | -58.9 |
| Solar energy | 0 | 0 | 0 | ... |
| occupants per room - 1.00 or less | 88,540 | 88,131 | -409 | -0.5 |
| occupants per room - 1.01 to 1.50 | 1,618 | 2,880 | 1,262 | 78.0 |
| occupants per room - 1.51 or more | 875 | 988 | 113 | 12.9 |
| Housing Value; Occupied Housing Units | ||||
| Less than $50,000 | 3,996 | 6,575 | 2,579 | 64.5 |
| $50,000 to $99,999 | 6,339 | 7,763 | 1,424 | 22.5 |
| $100,000 to $149,999 | 7,934 | 5,181 | -2,753 | -34.7 |
| $150,000 to $199,999 | 8,467 | 8,581 | 114 | 1.3 |
| $200,000 to $299,999 | 8,723 | 11,515 | 2,792 | 32.0 |
| $300,000 to $499,999 | 7,414 | 6,599 | -815 | -11.0 |
| $500,000 to $999,999 | 2,810 | 2,008 | -802 | -28.5 |
| $1,000,000 or more | 258 | 540 | 282 | 109.3 |
| Median (dollars) | 178,000 | 173,900 | -4,100 | -2.3 |
| Mortgage Status; Owner-occupied units - total | 45,941 | 48,762 | 2,821 | 6.1 |
| Occupied housing units -Housing units with a mortgage | 23,095 | 25,164 | 2,069 | 9.0 |
| Occupied housing units - Housing units without a mortgage | 22,846 | 23,598 | 752 | 3.3 |
| Rent; Occupied units paying rent | 43,874 | 41,882 | -1,992 | -4.5 |
| Less than $500 | 2,898 | 2,606 | -292 | -10.1 |
| $500 to $999 | 24,808 | 23,685 | -1,123 | -4.5 |
| $1,000 to $1,499 | 9,981 | 10,165 | 184 | 1.8 |
| $1,500 to $1,999 | 4,236 | 3,072 | -1,164 | -27.5 |
| $2,000 to $2,499 | 1,379 | 2,241 | 862 | 62.5 |
| $2,500 to $2,999 | 572 | 0 | -572 | -100.0 |
| $3,000 or more | 0 | 113 | 113 | ... |
| Median (dollars) | 874 | 899 | 25 | 2.9 |
| GRAPI; Occupied units paying rent (excl units where GRAPI not computed) | 42,201 | 40,473 | -1,728 | -4.1 |
| Less than 15.0 percent | 4,637 | 4,041 | -596 | -12.9 |
| 15.0 to 19.9 percent | 4,032 | 4,679 | 647 | 16.0 |
| 20.0 to 24.9 percent | 3,960 | 3,799 | -161 | -4.1 |
| 25.0 to 29.9 percent | 3,471 | 3,085 | -386 | -11.1 |
| 30.0 to 34.9 percent | 2,576 | 1,852 | -724 | -28.1 |
| 35.0 percent or more | 23,525 | 23,017 | -508 | -2.2 |
5.3. Residential Construction; Housing Units Authorized & Value - goto top
Based on Census Building Permits (http://proximityone.com/metro_residentialconstruction.htm, these data provide insights into the trending quality, type and value of new residential construction. See web section for footnote and related information. These data are updated monthly. The table presents the most recent 12 months.
| Item | Aug15 | Sep15 | Oct15 | Nov15 | Dec15 | Jan16 | Feb16 | Mar16 | Apr16 | May16 | Jun16 | Jul16 |
| Total Residential Units | 74 | 127 | 159 | 129 | 234 | 548 | 551 | 393 | 198 | 82 | 90 | 111 |
| in 1 unit bldgs | 74 | 127 | 79 | 71 | 113 | 90 | 115 | 175 | 123 | 73 | 90 | 63 |
| in 2 unit bldgs | 0 | 0 | 2 | 8 | 46 | 44 | 48 | 16 | 24 | 2 | 0 | 0 |
| in 3-4 unit bldgs | 0 | 0 | 4 | 3 | 36 | 48 | 16 | 19 | 24 | 0 | 0 | 0 |
| in 5+ unit bldgs | 0 | 0 | 74 | 47 | 39 | 366 | 372 | 183 | 27 | 7 | 0 | 48 |
| Bldgs with 5+ units | 0 | 0 | 8 | 5 | 4 | 17 | 19 | 15 | 3 | 1 | 0 | 2 |
| Percent Coverage | 100 | 100 | 100 | 100 | 100 | 100 | 100 | 100 | 100 | 100 | 100 | 100 |
| Value ($000), Total Units | 14,489 | 19,181 | 20,195 | 20,072 | 29,011 | 50,897 | 52,498 | 44,118 | 23,778 | 19,048 | 19,165 | 15,858 |
| 1 unit structures | 14,489 | 19,181 | 14,603 | 14,312 | 18,737 | 15,238 | 18,903 | 27,847 | 17,176 | 17,956 | 19,165 | 13,704 |
| 2 unit structures | 0 | 0 | 216 | 812 | 4,955 | 3,674 | 5,556 | 1,659 | 2,140 | 240 | 0 | 0 |
| 3-4 unit structures | 0 | 0 | 265 | 358 | 2,698 | 5,391 | 1,907 | 2,025 | 1,605 | 0 | 0 | 0 |
| 5+ unit structures | 0 | 0 | 5,111 | 4,590 | 2,621 | 26,594 | 26,132 | 12,587 | 2,857 | 852 | 0 | 2,154 |
5.4. Housing Price Index - goto top
Based on the FHFA (Fannie Mae/Freddie Mac) Housing Price Index (http://proximityone.com/hpi.htm), these non seasonally adjusted data provide insights into movement of single-family housing prices. The data are updated quarterly and feature a short lag between the date of availability and quarterly reference date. See related interactive table to compare areas. See related 5-Digit ZIP Code HPI interactive table.
This table shows annual HPI values for the U.S., CBSA state, CBSA and CBSA component counties for the base year 2000 = 100. The rightmost column shows housing value appreciation between 2010 and 2017.
| Housing Price Index: | 2010 | 2011 | 2012 | 2013 | 2014 | 2015 | 2016 | 2017 | HPA 10-17 |
| United States | 126.86 | 121.29 | 118.99 | 123.23 | 130.83 | 136.39 | 143.64 | 151.78 | 19.64 |
| State: Texas | 129.34 | 127.50 | 128.47 | 133.61 | 143.48 | 152.94 | 163.73 | 175.65 | 35.80 |
| Metro: College Station-Bryan, TX MSA | 142.00 | 140.29 | 142.50 | 143.70 | 153.10 | 163.39 | 177.56 | 190.05 | 33.84 |
| Brazos County, TX | 142.21 | 140.61 | 142.50 | 143.74 | 153.20 | 164.04 | 179.07 | 191.24 | 34.48 |
6.1. Economic Profile - goto top
Based on BEA Regional Economic Information System (http://proximityone.com/reis.htm), these data provide a comprehensive overview of the local economy. See web section for footnote and related information.
Economic Characteristics
| Item | 2010 | 2011 | 2012 | 2013 | 2014 | 2015 | 2016 | 2017 | Chg10-17 | %Chg10-17 |
| Personal income (millions of dollars) | 6,973 | 7,297 | 7,764 | 8,094 | 8,726 | 9,117 | 9,293 | 9,729 | 2,757 | 39.5 |
| .Net earnings by place of residence | 4,551 | 4,729 | 5,021 | 5,309 | 5,702 | 5,939 | 5,919 | 6,226 | 1,675 | 36.8 |
| .Personal current transfer receipts | 1,150 | 1,184 | 1,186 | 1,228 | 1,305 | 1,411 | 1,477 | 1,514 | 364 | 31.7 |
| ..Income maintenance benefits 1/ | 146 | 153 | 153 | 156 | 159 | 159 | 163 | 169 | 23 | 15.7 |
| ..Unemployment insurance compensation | 53 | 42 | 35 | 27 | 17 | 20 | 22 | 18 | -36 | -67.0 |
| ..Retirement and other | 951 | 989 | 997 | 1,045 | 1,129 | 1,231 | 1,292 | 1,327 | 377 | 39.6 |
| .Dividends, interest, and rent 2/ | 1,272 | 1,384 | 1,557 | 1,558 | 1,720 | 1,767 | 1,897 | 1,989 | 718 | 56.4 |
| .Population (persons) 3/ | 229,449 | 231,451 | 234,126 | 237,820 | 242,533 | 250,138 | 254,230 | 258,044 | 28,595 | 12.5 |
| .Per capita personal income 4/ | 30,389 | 31,527 | 33,163 | 34,033 | 35,980 | 36,447 | 36,553 | 37,704 | 7,315 | 24.1 |
| .Per capita net earnings 4/ | 19,835 | 20,433 | 21,447 | 22,321 | 23,510 | 23,743 | 23,281 | 24,128 | 4,293 | 21.6 |
| .Per capita pers current trans receipts 4/ | 5,011 | 5,115 | 5,064 | 5,161 | 5,379 | 5,640 | 5,811 | 5,867 | 856 | 17.1 |
| ..Per capita income maint benefits 4/ | 637 | 659 | 655 | 655 | 656 | 637 | 642 | 655 | 18 | 2.8 |
| ..Per capita unempl insurance comp 4/ | 231 | 182 | 151 | 112 | 68 | 81 | 88 | 68 | -163 | -70.6 |
| ..Per capita retirement and other 4/ | 4,143 | 4,274 | 4,258 | 4,395 | 4,655 | 4,922 | 5,081 | 5,144 | 1,001 | 24.2 |
| .Per capita dividends, interest & rent 4/ | 5,542 | 5,979 | 6,652 | 6,550 | 7,091 | 7,064 | 7,460 | 7,709 | 2,167 | 39.1 |
| .Earnings by place of work | 5,042 | 5,140 | 5,427 | 5,792 | 6,205 | 6,491 | 6,515 | 6,892 | 1,851 | 36.7 |
| ..Wages and salaries | 3,466 | 3,572 | 3,756 | 3,907 | 4,187 | 4,384 | 4,484 | 4,736 | 1,270 | 36.6 |
| ..Supplements to wages and salaries | 901 | 881 | 956 | 1,052 | 1,121 | 1,217 | 1,230 | 1,284 | 383 | 42.5 |
| ...Employer cont/empl pens/insur funds 5/ | 679 | 653 | 715 | 802 | 853 | 936 | 945 | 979 | 300 | 44.3 |
| ...Employer cont/govt social insurance | 222 | 229 | 241 | 249 | 268 | 281 | 285 | 305 | 83 | 37.3 |
| ..Proprietors income | 675 | 687 | 715 | 834 | 897 | 891 | 801 | 873 | 198 | 29.3 |
| ...Farm proprietors income | -4 | -24 | -20 | 34 | 11 | 33 | -11 | -11 | -7 | 205.7 |
| ...Nonfarm proprietors income | 679 | 711 | 735 | 800 | 886 | 858 | 813 | 883 | 205 | 30.2 |
| Total employment (number of jobs) | 128,073 | 128,362 | 131,867 | 137,260 | 141,934 | 146,143 | 149,026 | 151,720 | 23,647 | 18.5 |
| .Wage and salary employment | 99,761 | 99,098 | 102,113 | 106,247 | 110,208 | 113,342 | 114,831 | 116,845 | 17,084 | 17.1 |
| .Proprietors employment | 28,312 | 29,264 | 29,754 | 31,013 | 31,726 | 32,801 | 34,195 | 34,875 | 6,563 | 23.2 |
| ..Farm proprietors employment 6/ | 4,027 | 4,013 | 3,954 | 3,979 | 3,935 | 3,876 | 3,861 | 3,836 | -191 | -4.7 |
| ..Nonfarm proprietors employment | 24,285 | 25,251 | 25,800 | 27,034 | 27,791 | 28,925 | 30,334 | 31,039 | 6,754 | 27.8 |
| Average earnings per job (dollars) | 39,365 | 40,044 | 41,154 | 42,200 | 43,715 | 44,417 | 43,719 | 45,427 | 6,062 | 15.4 |
| .Average wages and salaries | 34,741 | 36,041 | 36,780 | 36,770 | 37,992 | 38,677 | 39,050 | 40,530 | 5,789 | 16.7 |
| .Average nonfarm proprietors income | 27,942 | 28,168 | 28,487 | 29,584 | 31,867 | 29,663 | 26,788 | 28,456 | 514 | 1.8 |
6.2.1. Establishments, Employment & Earnings by Sector (QCEW)
Based on BLS Quarterly Census of Employment and Wages (http://proximityone.com/eee.htm), these data are updated quarterly and feature only a 7 month lag between the date of availability and quarterly reference date. See related interactive table to compare areas.
| Sector | Establishments 2016Q2 | Employment 2016Q2 | Avg Weekly Wages 2016Q2 | Establishments 2017Q2 | Employment 2017Q2 | Avg Weekly Wages 2017Q2 |
| Total, all industries | 5,125 | 107,224 | 727 | 5,297 | 108,936 | 772 |
| Total, all industries - Fed Govt | 45 | 808 | 1,189 | 44 | 819 | 1,229 |
| Total, all industries - St Govt | 65 | 25,773 | 819 | 62 | 26,062 | 843 |
| Total, all industries - Local Govt | 106 | 10,768 | 758 | 108 | 10,984 | 758 |
| Total, all industries - Private | 4,909 | 69,875 | 684 | 5,083 | 71,071 | 744 |
| Goods-producing | 881 | 13,263 | 850 | 908 | 13,946 | 907 |
| Natural resources and mining | 249 | 2,513 | 1,072 | 253 | 2,701 | 1,120 |
| Construction | 486 | 5,438 | 802 | 503 | 5,818 | 891 |
| Manufacturing | 146 | 5,311 | 795 | 152 | 5,427 | 819 |
| Service-providing | 4,028 | 56,612 | 645 | 4,175 | 57,125 | 704 |
| Trade, transportation & utilities | 1,061 | 15,506 | 639 | 1,094 | 15,791 | 705 |
| Information | 63 | 1,268 | 910 | 62 | 1,254 | 967 |
| Financial activities | 557 | 3,665 | 888 | 585 | 3,725 | 956 |
| Professional & business services | 834 | 8,238 | 862 | 844 | 8,558 | 917 |
| Education and health services | 532 | 10,802 | 826 | 547 | 11,056 | 890 |
| Leisure and hospitality | 531 | 14,596 | 319 | 566 | 14,138 | 355 |
| Other services | 431 | 2,497 | 590 | 420 | 2,458 | 623 |
| Unclassified | 19 | 40 | 403 | 57 | 146 | 382 |
6.2.2. Establishments, Employment & Earnings by Sector (QCEW) - Downloadable Detailed NAICS Files
Use the following links to access detailed QCEW data by detailed type of business (CSV files) .. See notes on using these files.
.. 2016Q2 .. 2016Q3 .. 2016Q4 .. 2017Q1 .. 2017Q2 .. 2017Q3 .. 2017Q4 .. 2018Q1 .. 2018Q2 .. 2018Q3
6.3. Establishments, Employment & Earnings by Sector (CBP) - goto top
Based on Census County Business Patterns (http://proximityone.com/cbp2016.htm), these place of work data include all sectors except crop/animal production; rail transportation; postal service; pension, health, welfare & vacation funds; trusts, estates & agency accounts; private households; public administration. Most government operations are excluded. See related interactive table.
... this section updates with 2017 data in April 2019.
Establishments, Employment & Earnings by Sector
| Sector | Estab 2014 | Emp 2014 | Avg Annual Pay 2014 | Estab 2015 | Emp 2015 | Avg Annual Pay 2015 | Estab 2016 | Emp 2016 | Avg Annual Pay 2016 |
| -- Total for all sectors | 4,698 | 67,251 | 34,795 | 4,744 | 70,268 | 34,947 | 4,860 | 72,149 | 35,206 |
| 11 - Agriculture, Forestry, Fishing, Hunting | 18 | 0 | ... | 17 | 385 | 54,249 | 19 | 393 | 53,791 |
| 21 - Mining, Quarrying & Oil/Gas Extraction | 90 | 1,284 | 72,550 | 92 | 1,254 | 57,952 | 74 | 801 | 61,845 |
| 22 - Utilities | 16 | 363 | 103,449 | 14 | 305 | 87,911 | 15 | 330 | 103,182 |
| 23 - Construction | 405 | 4,162 | 47,321 | 435 | 4,408 | 46,875 | 465 | 5,060 | 46,094 |
| 31 - Manufacturing | 128 | 5,561 | 40,674 | 137 | 5,904 | 41,980 | 136 | 6,030 | 40,581 |
| 42 - Wholesale Trade | 188 | 2,133 | 48,527 | 196 | 2,319 | 51,298 | 196 | 2,306 | 51,614 |
| 44 - Retail Trade | 741 | 11,376 | 23,237 | 736 | 11,946 | 23,429 | 752 | 12,170 | 24,360 |
| 48 - Transportation and Warehousing | 132 | 2,292 | 43,656 | 129 | 2,417 | 44,470 | 134 | 2,442 | 44,800 |
| 51 - Information | 86 | 1,332 | 51,992 | 85 | 1,417 | 51,213 | 91 | 1,548 | 53,581 |
| 52 - Finance and Insurance | 286 | 1,762 | 51,373 | 282 | 1,728 | 56,072 | 282 | 1,860 | 61,583 |
| 53 - Real Estate and Rental and Leasing | 281 | 1,422 | 36,922 | 277 | 1,496 | 37,209 | 288 | 1,548 | 35,995 |
| 54 - Professional, Scientific & Tech Svcs | 485 | 3,203 | 53,820 | 486 | 3,611 | 54,046 | 492 | 3,770 | 52,866 |
| 55 - Management of Companies/Enterprises | 35 | 677 | 73,461 | 36 | 703 | 83,078 | 37 | 637 | 91,468 |
| 56 - Administrative and Support+ | 230 | 3,601 | 26,762 | 241 | 3,887 | 25,710 | 245 | 3,819 | 27,463 |
| 61 - Educational Services | 53 | 853 | 28,593 | 54 | 890 | 28,513 | 59 | 917 | 28,449 |
| 62 - Health Care and Social Assistance | 464 | 9,815 | 47,565 | 459 | 9,902 | 47,845 | 459 | 9,945 | 48,290 |
| 71 - Arts, Entertainment, and Recreation | 68 | 1,334 | 14,353 | 72 | 1,536 | 13,559 | 74 | 1,370 | 15,834 |
| 72 - Accommodation and Food Services | 530 | 11,832 | 13,543 | 527 | 12,262 | 14,379 | 550 | 13,219 | 14,163 |
| 81 - Other Services (exc Public Admin) | 455 | 3,821 | 24,938 | 458 | 3,882 | 25,608 | 479 | 3,965 | 25,564 |
- based on Census American Community Survey 1-year estimates; http://proximityone.com/acs2017.htm
- see related all ACS 2017 1 year metros Economic Characteristics interactive table: http://proximityone.com/cbsa171dp3.htm
| Item | 2016 | 2017 | Chg16-17 | %Chg16-17 |
| Labor Force; Population 16 years and over | 207,320 | 208,897 | 1,577 | 0.8 |
| In labor force | 127,852 | 124,127 | -3,725 | -2.9 |
| In labor force - Civilian labor force | 127,591 | 123,855 | -3,736 | -2.9 |
| In labor force - Civilian labor force - Employed | 120,601 | 118,319 | -2,282 | -1.9 |
| In labor force - Civilian labor force - Unemployed | 6,990 | 5,536 | -1,454 | -20.8 |
| In labor force - Armed Forces | 261 | 272 | 11 | 4.2 |
| Not in labor force | 79,468 | 84,770 | 5,302 | 6.7 |
| In labor force - Civilian labor force | 127,591 | 123,855 | -3,736 | -2.9 |
| In labor force - Unemployment Rate | 5.5 | 4.5 | -1.0 | -18.2 |
| Employment by Industry; Civilian employed population 16 years and over | 120,601 | 118,319 | -2,282 | -1.9 |
| Agriculture, forestry, fishing and hunting, and mining | 3,341 | 3,425 | 84 | 2.5 |
| Construction | 10,322 | 8,056 | -2,266 | -22.0 |
| Manufacturing | 7,825 | 9,443 | 1,618 | 20.7 |
| Wholesale trade | 3,006 | 2,373 | -633 | -21.1 |
| Retail trade | 10,921 | 13,358 | 2,437 | 22.3 |
| Transportation and warehousing, and utilities | 3,444 | 4,664 | 1,220 | 35.4 |
| Information | 1,168 | 2,099 | 931 | 79.7 |
| Finance and insurance, and real estate and rental and leasing | 5,766 | 4,990 | -776 | -13.5 |
| Prof, scientific & management, & admine and waste mgmt services | 10,873 | 11,520 | 647 | 6.0 |
| Educational services, and health care and social assistance | 39,475 | 34,512 | -4,963 | -12.6 |
| Arts, entertainment, & recreation, & accommodation & food services | 12,169 | 13,723 | 1,554 | 12.8 |
| Other services, except public administration | 6,316 | 5,720 | -596 | -9.4 |
| Public administration | 5,975 | 4,436 | -1,539 | -25.8 |
| Class of Worker; Civilian employed population 16 years and over | 120,601 | 118,319 | -2,282 | -1.9 |
| Private wage and salary workers | 82,981 | 87,637 | 4,656 | 5.6 |
| Government workers | 29,864 | 24,743 | -5,121 | -17.1 |
| Self-employed in own not incorporated business workers | 7,505 | 5,856 | -1,649 | -22.0 |
| Unpaid family workers | 251 | 83 | -168 | -66.9 |
| Household Income; Total households | 91,033 | 91,999 | 966 | 1.1 |
| Less than $10,000 | 9,675 | 11,415 | 1,740 | 18.0 |
| $10,000 to $14,999 | 5,824 | 6,790 | 966 | 16.6 |
| $15,000 to $24,999 | 12,239 | 10,222 | -2,017 | -16.5 |
| $25,000 to $34,999 | 10,505 | 8,427 | -2,078 | -19.8 |
| $35,000 to $49,999 | 11,751 | 12,680 | 929 | 7.9 |
| $50,000 to $74,999 | 12,210 | 14,221 | 2,011 | 16.5 |
| $75,000 to $99,999 | 9,303 | 10,900 | 1,597 | 17.2 |
| $100,000 to $149,999 | 9,955 | 10,541 | 586 | 5.9 |
| $150,000 to $199,999 | 4,171 | 3,639 | -532 | -12.8 |
| $200,000 or more | 5,400 | 3,164 | -2,236 | -41.4 |
| Median household income (dollars) | 42,233 | 45,515 | 3,282 | 7.8 |
| Mean household income (dollars) | 69,770 | 64,918 | -4,852 | -7.0 |
| Earnings; Total households with earnings | 77,377 | 74,723 | -2,654 | -3.4 |
| With earnings - Mean earnings (dollars) | 68,798 | 64,119 | -4,679 | -6.8 |
| With Social Security | 18,862 | 20,157 | 1,295 | 6.9 |
| Mean Social Security income (dollars) | 18,342 | 18,895 | 553 | 3.0 |
| With retirement income | 10,904 | 13,534 | 2,630 | 24.1 |
| Mean retirement income (dollars) | 23,632 | 25,554 | 1,922 | 8.1 |
| With Supplemental Security Income | 3,020 | 2,674 | -346 | -11.5 |
| Mean Supplemental Security Income (dollars) | 8,341 | 9,752 | 1,411 | 16.9 |
| With cash public assistance income | 1,712 | 918 | -794 | -46.4 |
| Mean cash public assistance income (dollars) | 2,308 | 2,773 | 465 | 20.1 |
| With Food Stamp/SNAP benefits in the past 12 months | 7,339 | 10,584 | 3,245 | 44.2 |
| Familiy Income; Families | 54,561 | 54,749 | 188 | 0.3 |
| Less than $10,000 | 2,063 | 3,331 | 1,268 | 61.5 |
| $10,000 to $14,999 | 2,454 | 2,097 | -357 | -14.5 |
| $15,000 to $24,999 | 6,004 | 5,118 | -886 | -14.8 |
| $25,000 to $34,999 | 4,838 | 4,481 | -357 | -7.4 |
| $35,000 to $49,999 | 6,983 | 7,861 | 878 | 12.6 |
| $50,000 to $74,999 | 8,196 | 9,658 | 1,462 | 17.8 |
| $75,000 to $99,999 | 7,030 | 7,253 | 223 | 3.2 |
| $100,000 to $149,999 | 8,768 | 8,521 | -247 | -2.8 |
| $150,000 to $199,999 | 3,475 | 3,402 | -73 | -2.1 |
| $200,000 or more | 4,750 | 3,027 | -1,723 | -36.3 |
| Median family income (dollars) | 64,422 | 61,790 | -2,632 | -4.1 |
| Mean family income (dollars) | 90,101 | 82,616 | -7,485 | -8.3 |
| Per capita income (dollars) | 26,025 | 24,627 | -1,398 | -5.4 |
| Per capita income (dollars) - Nonfamily households | 36,472 | 37,250 | 778 | 2.1 |
| Median nonfamily income (dollars) | 24,811 | 24,477 | -334 | -1.3 |
| Mean nonfamily income (dollars) | 36,166 | 35,503 | -663 | -1.8 |
| Median earnings for workers (dollars) | 23,352 | 24,470 | 1,118 | 4.8 |
| Median earnings for male full-time, year-round workers (dollars) | 46,600 | 44,684 | -1,916 | -4.1 |
| Median earnings for female full-time, year-round workers (dollars) | 33,159 | 36,450 | 3,291 | 9.9 |
| Insurance Coverage; Civilian Noninstitutionalized Population | 250,064 | 254,140 | 4,076 | 1.6 |
| With health insurance coverage | 220,233 | 222,167 | 1,934 | 0.9 |
| With private health insurance coverage� | 186,236 | 184,430 | -1,806 | -1.0 |
| With public health coverage� | 56,643 | 59,702 | 3,059 | 5.4 |
| No health insurance coverage | 29,831 | 31,973 | 2,142 | 7.2 |
6.5. Gross Domestic Product - goto top
Based on BEA Metro Gross Domestic Products (GDP) estimates (http://proximityone.com/metrogdp.htm), these provide a comprehensive measure of the metro economic output. Gross domestic product (GDP) is the value of the goods and services produced by the metro�s economy less the value of the goods and services used up in production. GDP estimates, updated annually, are available for only Metropolitan Statistical Areas (MSAs). Use the interactive table to rank, sort, compare metros.
| Item | 2011 | 2012 | 2013 | 2014 | 2015 | 2016 | 2017 | Change 2011-17 | %Change 2011-17 |
| Gross Domestic Product, per capita real GDP | 32,539 | 33,238 | 33,895 | 34,800 | 35,231 | 34,397 | 34,770 | 2,231 | 6.90 |
| Real GDP (millions) | 7,531 | 7,782 | 8,061 | 8,440 | 8,813 | 8,745 | 8,972 | 1,441 | 19.13 |
| GDP (current dollars, millions) | 7,845 | 8,260 | 8,723 | 9,309 | 9,698 | 9,727 | 10,197 | 2,352 | 29.98 |
| Real GDP Quantity Index, all industry | 101.339 | 104.713 | 108.468 | 113.569 | 118.582 | 117.670 | 120.729 | ... | ... |
6.6. Fortune 1000 Companies with Headquarters in Metro - goto top
The Fortune 1000 companies (http://proximityone.com/metros_fortune1000.htm) are the largest businesses in the U.S.
This section is updated (2018 businesses) and expanded with additional attributes subscriber edition.
6.7. Labor Market Characteristics & Trends go top
Based on BLS Local Area Unemployment Statistics (http://proximityone.com/laus.htm), these data are updated monthly and feature only a 2 month lag between the date of availability and month reference date. See related annual labor force characteristics in section 6.4. See related interactive table to compare areas. The table shows most recent six months and data (not seasonally adjusted) for month one year earlier than most recent month.
| Item | Nov16 | Jun17 | Jul17 | Aug17 | Sep17 | Oct17 | Nov17 | Change 11/16-11/17 | %Change 11/16-11/17 |
| Labor Force | 128,453 | 124,893 | 124,441 | 124,537 | 130,375 | 131,457 | 131,717 | 3,264 | 2.54 |
| Employment | 124,133 | 120,137 | 120,069 | 120,077 | 126,582 | 128,150 | 128,114 | 3,981 | 3.21 |
| Unemployment | 4,320 | 4,756 | 4,372 | 4,460 | 3,793 | 3,307 | 3,603 | -717 | -16.60 |
| Unemployment Rate | 3.36 | 3.81 | 3.51 | 3.58 | 2.91 | 2.52 | 2.74 | -0.63 | -18.66 |
6.8. Cost of Living go top
A cost of living measure is provided by the Regional Price Parity (RPP) for goods and services for an area (state or MSA). The RPP is developed by the Bureau of Economic Analysis (BEA) and updated annually. The RPP is an index where the national average of the cost of goods and services sold is 100. The RPP is a measure of the cost of living in that area relative to the U.S. overall average. The RPP is available for states and MSAs. The 2006-2016 series will be updated and extended to 2017 in May 2019. More detail is available in subscriber edition.
The Regional Price Parity (RPP) for all goods and services for the College Station-Bryan, TX MSA changed from 92.8 in 2010 to 93.3 in 2017.
7.1. General Social Characteristics - goto top
- based on Census American Community Survey 1-year estimates; http://proximityone.com/acs2017.htm
- see related all ACS 2017 1 year metros Social Characteristics interactive table: http://proximityone.com/cbsa171dp2.htm
| Item | 2016 | 2017 | Chg16-17 | %Chg16-17 |
| Total households | 91,033 | 91,999 | 966 | 1.1 |
| Family households (families) | 54,561 | 54,749 | 188 | 0.3 |
| Nonfamily households | 36,472 | 37,250 | 778 | 2.1 |
| Nonfamily households - Householder living alone | 22,443 | 26,207 | 3,764 | 16.8 |
| Average household size | 2.62 | 2.63 | 0.01 | 0.4 |
| Average family size | 3.14 | 3.19 | 0.05 | 1.6 |
| Population in households | 238,352 | 241,885 | 3,533 | 1.5 |
| Enrolled in School; Population 3 years and over enrolled in school | 100,693 | 104,460 | 3,767 | 3.7 |
| Nursery school, preschool | 3,795 | 4,302 | 507 | 13.4 |
| Kindergarten | 2,196 | 2,971 | 775 | 35.3 |
| Elementary school (grades 1-8) | 24,265 | 25,108 | 843 | 3.5 |
| High school (grades 9-12) | 10,252 | 12,159 | 1,907 | 18.6 |
| College or graduate school | 60,185 | 59,920 | -265 | -0.4 |
| Educational Attainment; Population 25 years and over | 139,962 | 140,455 | 493 | 0.4 |
| Less than 9th grade | 8,912 | 10,347 | 1,435 | 16.1 |
| 9th to 12th grade, no diploma | 9,131 | 10,465 | 1,334 | 14.6 |
| High school graduate (includes equivalency) | 32,967 | 32,059 | -908 | -2.8 |
| Some college, no degree | 30,765 | 27,941 | -2,824 | -9.2 |
| Associate's degree | 8,811 | 8,911 | 100 | 1.1 |
| Bachelor's degree | 26,066 | 28,477 | 2,411 | 9.2 |
| Graduate or professional degree | 23,310 | 22,255 | -1,055 | -4.5 |
| Percent high school graduate or higher | 87.1 | 85.2 | -1.9 | -2.2 |
| Percent bachelor's degree or higher | 35.3 | 36.1 | 0.8 | 2.3 |
| Mobility/Migration; Residence one year age - Population 1 year and over | 251,038 | 255,949 | 4,911 | 2.0 |
| Same house | 181,105 | 190,105 | 9,000 | 5.0 |
| Different house in the U.S. | 66,894 | 63,155 | -3,739 | -5.6 |
| Same county | 36,719 | 33,347 | -3,372 | -9.2 |
| Different county | 30,175 | 29,808 | -367 | -1.2 |
| Different county - Same state | 23,548 | 24,140 | 592 | 2.5 |
| Different county - Different state | 6,627 | 5,668 | -959 | -14.5 |
| Abroad | 3,039 | 2,689 | -350 | -11.5 |
| Nativity | ||||
| Native | 223,095 | 227,618 | 4,523 | 2.0 |
| Born in United States | 219,441 | 224,136 | 4,695 | 2.1 |
| Born in United States - State of residence | 170,045 | 176,309 | 6,264 | 3.7 |
| Born in United States - Different state | 49,396 | 47,827 | -1,569 | -3.2 |
| Born in PR, U.S. Island or born abroad to Americans | 3,654 | 3,482 | -172 | -4.7 |
| Foreign born | 31,621 | 31,242 | -379 | -1.2 |
| Foreign-born population | 31,621 | 31,242 | -379 | -1.2 |
| Naturalized U.S. citizen | 9,460 | 10,269 | 809 | 8.6 |
| Not a U.S. citizen | 22,161 | 20,973 | -1,188 | -5.4 |
| Language Sooken at Home; Population 5 years and over | 239,453 | 242,230 | 2,777 | 1.2 |
| English only | 187,580 | 182,514 | -5,066 | -2.7 |
| Language other than English | 51,873 | 59,716 | 7,843 | 15.1 |
| Language other than English - Speak English less than "very well" | 17,241 | 20,852 | 3,611 | 20.9 |
| Spanish | 36,402 | 44,598 | 8,196 | 22.5 |
| Spanish - Speak English less than "very well" | 11,932 | 14,792 | 2,860 | 24.0 |
| Computer Access; Total households | 91,033 | 91,999 | 966 | 1.1 |
| With a computer | 83,720 | 84,772 | 1,052 | 1.3 |
| With a computer - With a broadband Internet subscription | 72,335 | 74,106 | 1,771 | 2.4 |
Characteristics for 2015-16 School Year
| Name | LEAID | LoGrade | HiGrade | Schools | Students | City |
| Arrow Academy | 4801416 | KG | 06 | 8 | 547 | College Station, TX |
| Brazos School For Inquiry & Creativity | 4800086 | PK | 08 | 3 | 417 | Bryan, TX |
| Bremond ISD | 4811250 | PK | 12 | 3 | 472 | Bremond, TX |
| Bryan ISD | 4811790 | PK | 12 | 26 | 16,164 | Bryan, TX |
| Caldwell ISD | 4812460 | PK | 12 | 5 | 1,795 | Caldwell, TX |
| Calvert ISD | 4812540 | PK | 12 | 1 | 156 | Calvert, TX |
| College Station ISD | 4807350 | PK | 12 | 17 | 13,021 | College Station, TX |
| Franklin ISD | 4819740 | PK | 12 | 3 | 1,190 | Franklin, TX |
| Hearne ISD | 4822830 | PK | 12 | 3 | 899 | Hearne, TX |
| Mumford ISD | 4831950 | PK | 12 | 2 | 612 | Mumford, TX |
| Snook ISD | 4840620 | PK | 12 | 2 | 509 | Snook, TX |
| Somerville ISD | 4840770 | PK | 12 | 2 | 442 | Somerville, TX |
This section is not available for this area in this version.
8. GeoPolitics - goto top
Metro breakout not available for this area in this version. See related:
• 115th Congressional Districts demographic-economic interactive tables General demographics .. Social .. Economic .. Housing
• State Legislative Districts (2016 cycle) interactive table
This document is a proprietary resource developed by ProximityOne and is licensed to the subscriber/licensee for their own use. This document may be used in any manner except that it may not be distributed whole or in part. Any use of the document should reference the source as ProximityOne and include a link to the S&O Main Page. There is no warranty of any type associated with any aspect of this report. The user of this document is solely responsible to any use, direct or indirect, that might be made of this document.
Using this Document ... goto top
This document to provides data and informaiton to assess geographic, demographic, economic characteristics and trends for this metro ... and component geographic areas including cities and counties. There are several aspects important to effective use of this document.
Accessing and Consuming the Information. The HTML document is designed for use with any browser using a tablet, laptop or desktop. The nature of the material is not intended for optimal use via cellphone.
Organization & Navigation. Use the Table of Contents at the top of the document to select a section by hyperlink.
Subject matter. Data presented here are derived from many sources. Some subject matter, such as employment, are included from multiple sources. Which are the "best" employment (for example) data to use and why are multi-sourced employment data useful?
Interpretation; developing your own narrative. This document may be only the start of your intended use. Create your own narrative for presentations to groups. Add your own data. Add charts and maps.
Printing the Document; alternative file structures. The HTML page has built-in, invisible page breaks. Print the document in portrait mode.
ProximityOne User Group
Join the ProximityOne User Group to keep up-to-date with new developments relating to metros and component geography decision-making information resources. Receive updates and access to tools and resources available only to members. Use this form to join the User Group.
Support Using these Resources
Learn more about accessing and using demographic-economic data and related analytical tools. Join us in a Data Analytics Lab session. There is no fee for these one-hour Web sessions. Each informal session is focused on a specific topic. The open structure also provides for Q&A and discussion of application issues of interest to participants.
Additional Information
ProximityOne develops geodemographic-economic data and analytical tools and helps organizations knit together and use diverse data in a decision-making and analytical framework. We develop custom demographic/economic estimates and projections, develop geographic and geocoded address files, and assist with impact and geospatial analyses. Wide-ranging organizations use our tools (software, data, methodologies) to analyze their own data integrated with other data. Follow ProximityOne on Twitter at www.twitter.com/proximityone. Contact us (888-364-7656) with questions about data covered in this section or to discuss custom estimates, projections or analyses for your areas of interest.
|
|