
|
|
|
-- insights into how your local economy is changing. April 2021 .. staying ahead of how and where demographics, the housing market and local economy are changing ... in March 2021, among all monthly new authorized residential construction permit issuing cities/places, Nashville-Davidson, TN led the U.S. with 2,361 total units followed by Austin, TX with 1,785 total units. See more about this leading economic indicator for cities/places using interactive table below. Data on housing patterns and trends are essential for wide-ranging decision-making applications. This section provides an overview of the ProximityOne resources to examine housing characteristics and trends. Topics • 01 examining monthly building permits for more than 20,000 places & counties • 02 monthly housing narrative report overview • 03 interactive table to examine monthly new authorized residential construction by city/place • 04 map and geospatially analyze housing patterns Related sections: • Housing units by county trends interactive table • City/Place Population & demographic trends • U.S. housing characteristics in context of broader demographic-economics Monthly Building Permits Data Building permits data are data that characterize new privately owned housing units authorized by building permits in permit-issuing places. Building permits are one of eleven leading economic indicators. The housing market is often one of the first economic sectors to expand or contract when economic conditions improve or decline. Building permits, housing starts, are early indicators of housing market change. This change typically leads to other types of economic change. Building permits data include the number of units and value by type of structure. Annual 2018 & 2019 Building Permits in Fresno County, CA
Monthly Building Permits Analytical Tools & Database ProximityOne updates the monthly building permits database with only a one month lag for more than 20,000 permit issuing places. - the next update is May 25, 2021 with data for April 2021. - each update extends a time series running from January 2020 forward. The Monthly Building Permits database and reports may be accessed many ways: - subscribe to one or a set of reports and receive updates monthly. Examples: • Fresno County, CA .. Fresno city, CA • San Diego County, CA .. San Diego city, CA • Wichita city, KS • Fairfax County, VA • Harris County, TX .. League City, TX - install the Housing Analytics software and prepare custom reports; click graphic for larger view. - 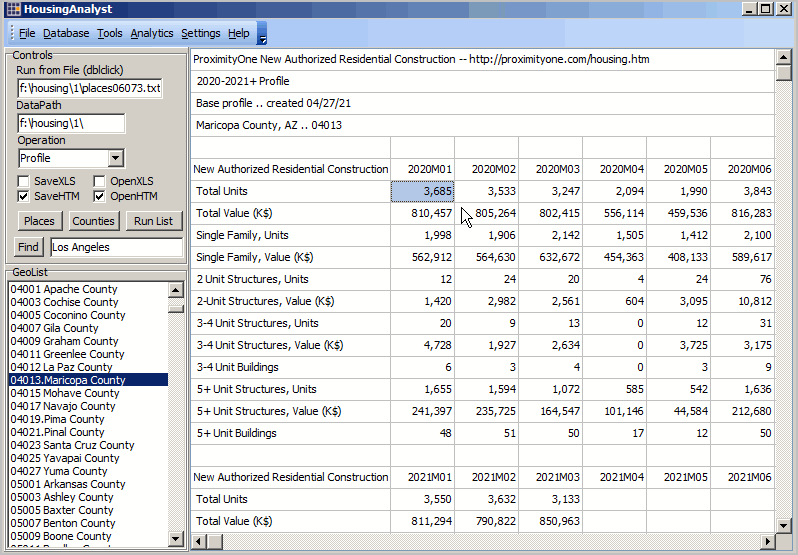 March 2021 Housing Overview This subsection updates monthly. The April report is available on May 18, 2021. Subscribe here to receive monthly updates. 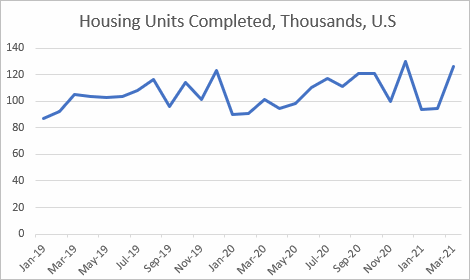 Monthly 2019 through March 2021 ... view as spreadsheet Building Permits. Privately-owned housing units authorized by building permits in March were at a seasonally adjusted annual rate of 1,766,000. This is 2.7% above the February rate of 1,720,000 and is 30.2% above the March 2020 rate of 1,356,000. Single-family authorizations in March were at a rate of 1,199,000; this is 4.6% above the revised February figure of 1,146,000. Authorizations of units in buildings with five units or more were at a rate of 508,000 in March. Housing Starts. Privately-owned housing starts in March were at a seasonally adjusted annual rate of 1,739,000. This is 19.4% above the revised February estimate of 1,457,000 and is 37.0% above the March 2020 rate of 1,269,000. Single-family housing starts in March were at a rate of 1,238,000; this is 15.3% above the revised February figure of 1,074,000. The March rate for units in buildings with five units or more was 477,000. Housing Completions. Privately-owned housing completions in March were at a seasonally adjusted annual rate of 1,580,000. This is 16.6% above the revised February estimate of 1,355,000 and is 23.4% above the March 2020 rate of 1,280,000. Single-family housing completions in March were at a rate of 1,099,000; this is 5.3% above the revised February rate of 1,044,000. The March rate for units in buildings with five units or more was 476,000. Patterns of Housing Unit Change by County: 2010-2019 The graphic below shows patterns of housing units change from 2010 to 2019 by county. - create this map view with zoom-in, labels and different metrics on your computer. - the table updates in June 2021 with 2010 to 2020 data using new Census housing unit estimates. - the table updates in August 2021 with Census 2020 data. Click graphic for larger view with details.  - view developed using ProximityOne CV XE GIS software and associated census building permits GIS project. Patterns of New Residential Construction: February 2021; Phoenix Area Using GIS tools to examine new authorized residential construction. - this map shows, for example, that the City of Phoenix had 1,373 new authorized total units in February 2021. - city/place boundaries shown with black outline.  - view developed using ProximityOne CV XE GIS software and associated metro GIS project. New Authorized Residential Construction -- Cities/Places & MCDs - monthly 2021M1-2021M3 Total units for places/subcounty areas issuing monthly permits. .. counties omitted from this table; county shown it is generally a "balance of unincorporated area". .. many cities/places report these data only annually, not monthly. Click column header to sort; click again to sort other direction. Click ShowAll button between queries (resets table).. See related interactive tables Usage Notes To select only MSAs, use "MSA" (case sensitive, without quotes) in the Find in Name edit box, then click Find in Name. • Click on a column header to sort on that column; click column header again to sort in other direction. • Click ShowAll button to show all areas and restore full set of data view. • Use horizontal scroll bar at base of table to scroll left-right. • To view geographies in one state: select state in dropdown below table; click ShowAll between selections. • Find in Name: key in partial area name in text box to right of Find in Name button. then click button to locate all matches (case sensitive). • Find CBSA: key in CBSA code (5 characters) in text box to right of Find CBSA. then click button to locate geographies that have this CBSA code. • See related ranking tables. Metros and Core-Based Statistical Areas [goto top] Metropolitan Statistical Areas (MSAs) and Micropolitan Statistical Areas (MISAs) are geographic entities delineated by the Office of Management and Budget (OMB) for use by Federal statistical agencies in collecting, tabulating, and publishing Federal statistics. The term "Core-Based Statistical Area" (CBSA) refer to the collective set of MSAs and MISAs. A MSA contains a core urban area of 50,000 or more population. A MISA contains an urban core of at least 10,000 (but less than 50,000) population. Each MSA or MISA consists of one or more counties and includes the counties containing the core urban area, as well as any adjacent counties that have a high degree of social and economic integration (as measured by commuting to work) with the urban core. The availability of data tabulated by MSA and MISA (and often less available for all counties or all cities) make MSAs and MISAs popular for the analysis of demographic, economic and business data. Determining CBSA Code • Find name and code from list. • Find name in table and view corresponding CBSA code. • Find name and code from list. • Key in an address here to view CBSA containing that address. Related Housing Market Data & Analytical Resources • Metro Situation & Outlook Reports - click link in column 3 to view that metro • 2010-2019 annual population estimates and trends • ACS 1-year demographic-economic tables - metro/CBSA • Housing Price Index • ProximityOne Data Services: access/integrate these with other data • CV XE GIS software: data analytics, maps, geospatial analysis • See related Interactive Ranking Tables Support Using these Resources .. goto top Learn more about demographic economic data and related analytical tools. Join us in a Data Analytics Lab session. There is no fee for these Web sessions. Each informal session is focused on a specific topic. The open structure also provides for Q&A and discussion of application issues of interest to participants. ProximityOne User Group .. goto top Join the ProximityOne User Group to keep up-to-date with new developments relating to geographic-demographic-economic decision-making information resources. Receive updates and access to tools and resources available only to members. Use this form to join the User Group. Additional Information .. goto top ProximityOne develops geographic-demographic-economic data and analytical tools and helps organizations knit together and use diverse data in a decision-making and analytical framework. We develop custom demographic/economic estimates and projections, develop geographic and geocoded address files, and assist with impact and geospatial analyses. Wide-ranging organizations use our software, data and methodologies to analyze their own data integrated with other data. Follow ProximityOne on Twitter at www.twitter.com/proximityone. Contact ProximityOne (888-364-7656) with questions about data covered in this section or to discuss custom estimates, projections or analyses for your areas of interest. |
|
|