
|
|
|
Mapping Market Area Demographic-Economic Characteristics -- creating & using the market area census blocks shapefile
This section summarizes steps to develop and use a market area census block shapefile. See background information at mapping market area demographics. Requirements to develop and use the circular area block shapefile include: • Install the CV XE GIS software (level 1 or higher) if not already installed. • Unzip the MAPS1 GIS project fileset to the folder c:\cv_maps (new folder). Application Design The application design starts with a location of interest. The latitude-longitude tool is used to determine the latitude-longitude for the address "1 Infinite Loop, Cupertino, CA 95014". Copy and paste this address in the address edit box (no quotes) and press enter. The latitude-longitude values are 37.331711, -122.03018. The objective is to develop a 1-mile and 3-mile circular area profiles and shapefile for this location for use in a GIS project. Using the GIS project, views such as those shown below can be developed. Using geospatial analysis tools, analysts and stakeholders can learn more about the demographic characteristics of a custom defined location vicinity. The 1-mile and 3-mile radius areas used here are only for illustration. There could be more circular areas and with any radius value. One location is used here for illustration; there might be many and at locations across the country. Mapping a Circular Area Based on Census Blocks -- Cupertino; Santa Clara County, CA Area 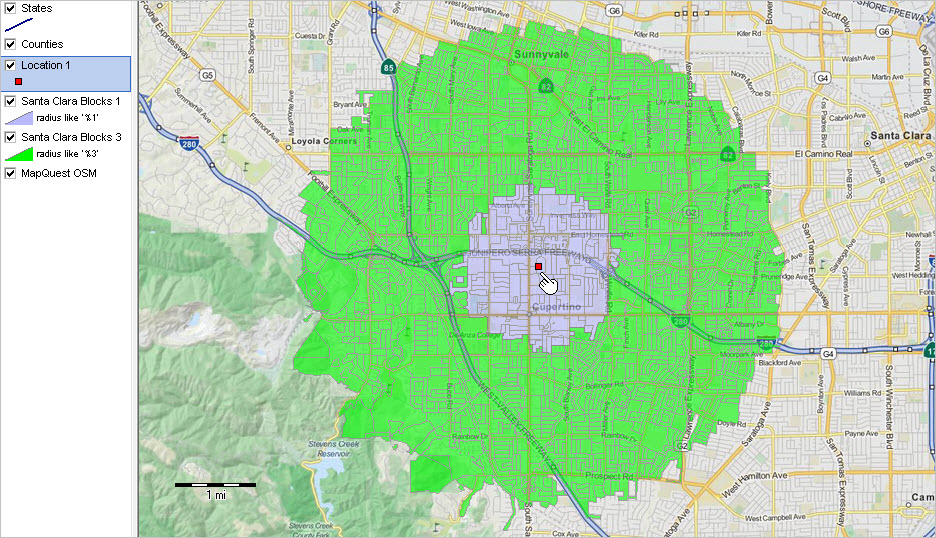 -- view developed using CV XE GIS software Supplemental graphics showing: • tabular profile of selected block attributes • zoom-in to location/block • zoom-in with blocks labeled with total population • use of site analysis tool -- aggregated values for population, housing units and households .. developed using CV XE GIS Site Analysis feature • thematic pattern view -- population per household by block with 1-mile radius blocks cross-hatched 1. Develop the Census Block Dataset The census block dataset is developed in this step. • Start CV-MAPS tool • Take all default (or no) values except for items noted here. • Enter the latitude and longitude values 37.331711 and -122.03018, respectively. • Enter the two radii (1 3) in the "Enter up to 5 radius values" text box provided. • Select California in the Select One or More States" dropdown . • Click the checkbox "Check to generate txt file with standard codes ..." • Click Generate Report The 1-mile radius report shows characteristics of the circular area with a Census 2010 total population of 29,042; the 3-mile radius report has a Census 2010 total population of 212,315. Use the report as generated and optionally download the census block file generated (shown at the bottom of the report page (page generated after clicking "Generate Report" button described above. Click the link shown below to download the required file.  Save the downloaded file as c:\cv_maps\caps10c4131.txt. Any drive/folder/name may be used. Using this drive/folder/name makes the file naming consistent with next steps. You will need to create the folder c:\cv_maps. 2. Create Census Block Dataset to dBase Structure The Census Block Dataset (item 1) is converted to dbase structure in this step. • With CV XE running, use File>Database>dBTools and CopyStructure from: c:\cv_maps\maps1.dbf to: c:\cv_maps\maps1_06085.dbf • With CV XE running, use File>Database>dBrowse and open the file c:\cv_maps\maps1_06085.dbf. • Click the Zap button at bottom of form to insure the file is empty. • Click the Import button and choose file type SDF/TXT; at the prompt select c:\cv_maps\maps10c4131.txt (file generated in step 1). • Navigate to top of file and delete this record (- sign on navigation bar); click Pack button below table. • Close the dBrowse form. The file is now ready to merge into the census block shapefile. 3. Get Required Census Block Shapefile • With CV XE running, use File>GeoGateway to download Santa Clara county Census 2010 census block shapefile as c:\cv_maps\tl_2010_06085_tabblock10.shp. 4. Merge the Block Radius Attributes into the Block Shapefile In this step, data from Step 2 are integrated into the shapefile dbf from Step 3. With CVXE running, use Tools>dBMerge feature to merge the census block dBase: • Open Source File 1: c:\cv_maps\tl_2010_06085_tabblock10.dbf • Open Source File 2: C:\cv_maps\maps1_06085.dbf • Click Create button • For Source File 1, Select All then Move Selected • For Source File 2, Select All then Move Selected • In Key2 enter "BLK" (no quotes) -- field name of match key • Click Merge • Click Allow overwrite when prompted Processing is now complete. The block radius attributes have been merged into the block shapefile. 5. Add the Location Point Shapefile to the Project The single point shapefile "c:\cv_maps\location1pt.shp" contains the location of the study site "1 Infinite Loop, Cupertino, CA 95014" as described above in Application Design. With CVXE running and the project c:\cv_maps\maps1.gis open, add the point shapefile. • Click the [+] button (Add Layer) on the 2nd CVXE toolbar and then select the file c:\cv_maps\location1pt.shp. • Click File>Save Project As and save the project as c:\cv_maps\maps_06085.gis. • The GIS project location is initially centered on Missouri. • Use the pan/drag tool on 2nd toolbar to set mapview window similar to view shown at top of this section. • Drag the view window West so the red marker is shown. .. 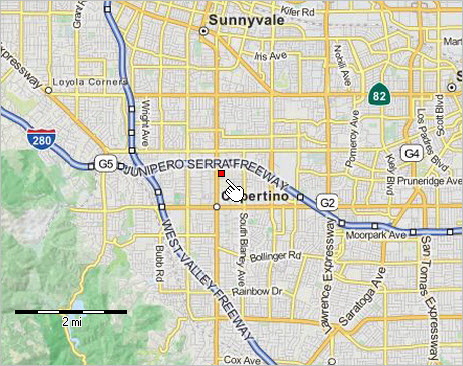 • Click File>Save Project. 6. Add Two Block Layers to Existing Project In this step, the shapefile created in Step 4 is added to the GIS project. The same shapefile is added twice. A query will be applied to each shapefile so that one shows 1-mile radius blocks and the other shows 3-mile radius blocks. • With CVXE running, open the project c:\cv_maps\maps1.gis. • Add new layer (+ button on 2nd toolbar menu) and select c:\cv_maps\tl_2010_06085_tabblock10.shp. .. this layer will be used as the 1-mile radius layer. .. using Layer Editor, set the Section query to "radius like '%1'" (no double quotes) .. 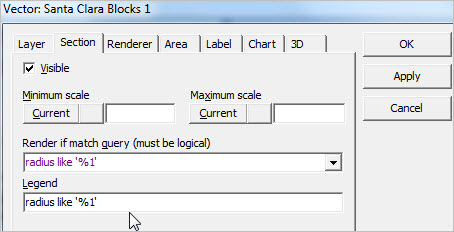 .. set the Layer>Caption to "Santa Clara Blocks 1" (no quotes) .. set the Layer>Area>Color to blue. ..  .. click OK button to close form. • Add 2nd layer (+ button on 2nd toolbar menu) and select c:\cv_maps\tl_2010_06085_tabblock10.shp .. this layer will be used as the 3-mile radius layer. .. using Layer Editor, set the Section query to "radius like '%3'" (no double quotes) .. 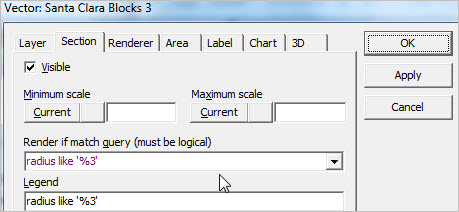 .. set the Layer>Caption to "Santa Clara Blocks 3" (no quotes) .. set the Layer>Area>Color to green. .. 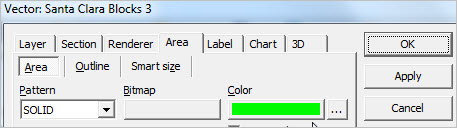 .. click OK button to close form. • Click File>Save Project. 7. Make adjustments to Legend Structure and Add Queries/Sections • Adjust settings to create view shown at top of this section. • Move layers up or down in the Legend Panel at left of Map Window. • Click on a name of a layer in the Legend Panel and drag the layer up or down. • Click File>Save Project. The project is now available for further use. Create alternative views such as those shown in "Supplemental Views" under the map graphic at the top of this section. ProximityOne User Group Join the ProximityOne User Group to keep up-to-date with new developments relating to metros and component geography decision-making information resources. Receive updates and access to tools and resources available only to members. Use this form to join the User Group. Support Using these Resources Learn more about accessing and using demographic-economic data and related analytical tools. Join us in a Data Analytics Lab session. There is no fee for these one-hour Web sessions. Each informal session is focused on a specific topic. The open structure also provides for Q&A and discussion of application issues of interest to participants. Additional Information ProximityOne develops geodemographic-economic data and analytical tools and helps organizations knit together and use diverse data in a decision-making and analytical framework. We develop custom demographic/economic estimates and projections, develop geographic and geocoded address files, and assist with impact and geospatial analyses. Wide-ranging organizations use our tools (software, data, methodologies) to analyze their own data integrated with other data. Follow ProximityOne on Twitter at www.twitter.com/proximityone. Contact us (888-364-7656) with questions about data covered in this section or to discuss custom estimates, projections or analyses for your areas of interest. |
|
|