
|
|
|
Mapping Market Area Demographic-Economic Characteristics
Create your own market area demographic-economic profiles or have us generate them for you. This section provides an overview of using data and tools to develop and analyze circular area demographic characteristics for anywhere in the U.S. More technical, step-by-step, operations on developing and using these data using GIS tools are reviewed in a related section. What are the demographic characteristics of a circular area with a 10-mile radius from a given location/address? How do those demographic characteristics compare to those of a 5-mile radius from the same location? Imagine analyzing an almost infinite number of locations with many circular areas, each having a custom defined radius. Demographic-economic characteristics of the population and housing in a circular area may be approximated by using demographic-economic data tabulated for small area geographies. Small area geographies include census blocks, block groups, census tracts, ZIP code areas, among others. Census block demographics are sourced from Census 2000 and Census 2010. Examine how demographics of alternatively defined areas (sets of census blocks) have changed between 2000 and 2010. Block group and higher level area demographic-economic data are sourced from the annually updated American Community Survey 5-year (ACS 5-year) estimates. This section is focused on using census block geography and demographics. Mapping a Market Area Based on Census Blocks The following view illustrates how characteristics of a 1-mile radius circular area (blue colored census blocks) and a 3-mile radius circular area (green colored census blocks) from designated location (red dot) may be displayed on a map. Use tools described in this section to create such maps for any location in the U.S. for any radius. 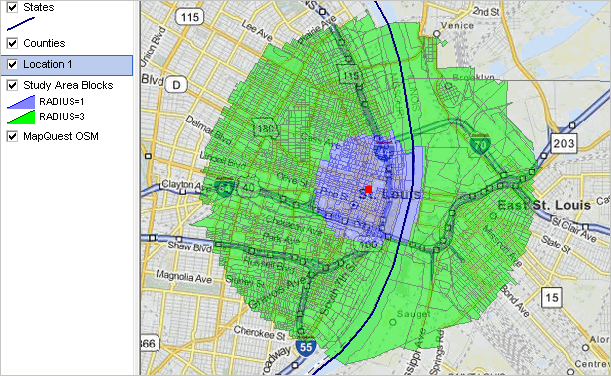 -- view developed using CV XE GIS software -- this view and related GIS project are further described below. Market Area Profiling System Use the ProximityOne Market Area Profiling System (MAPS) tool to create a demographic profile for a circular area where the user specifies the point/location of interest (latitude-longitude) and associated radii. Enter the latitude-longitude and radius values, related details, and click Generate Report. A report is generated, displayed in HTML and created as a CSV file available for download. Or, have ProximityOne develop MAPS reports and data for you. MAPS is CVGIS extension. With CVGIS running, the steps to use MAPS are: • Start MAPS • Take all default (or no) values except for items noted here. • Enter the latitude and longitude values 38.631551 and -90.193009, respectively. • Enter the two radii (1 3) in the "Enter up to 5 radius values" text box provided. • Click the checkbox "Check to generate txt file with standard codes ..." • Click Generate Report The 1-mile radius report shows characteristics of the circular area with a Census 2010 total population of 13,095; the 3-mile radius report has a Census 2010 total population of 80,258. Use the report as generated and optionally download the census block file generated (shown at the bottom of the report page (page generated after clicking "Generate Report" button described above. Click the link shown below to download the required file.  Save the downloaded file as c:\cv_maps\maps10c0125.txt. Any drive/folder/name may be used. Using this drive/folder/name makes the file naming consistent with next steps. You will need to create the folder c:\cv_maps. Mapping the Market Areas The MAPS tool does not create a map showing the location and features of the site/study area. The MAPS geocode data file can be imported into CV XE GIS for mapping and geospatial analysis. See more about GIS. An example of the map developed for the site described above is shown in the following graphic. The census blocks in the one-mile radius are shown in blue; census blocks in the three-mile radius are shown in green. The "ground zero" point location in St. Louis, MO is shown by the red marker. Other layers could be added. Once the GIS project is set up, many other visual and geospatial analysis possibilities exist. The following view shows a zoom-in to the 1-mile radius area. The CV XE GIS identify tool is used to display a mini-profile for a census block of interest (see pointer). Census blocks are labeled with the population value. As of Census 2010, this block had 488 population and 331 housing units. 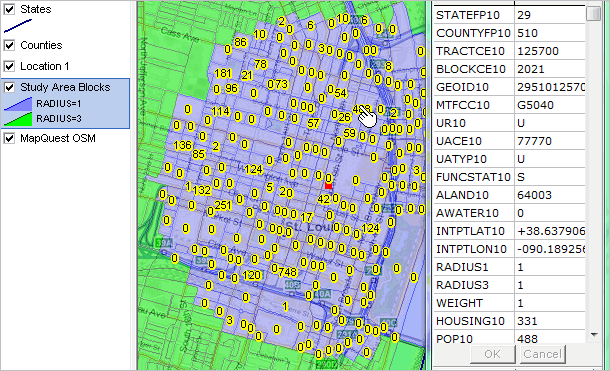 Using the MAPS GIS Illustration Project To explore the MAPS GIS project used to develop the above views, follow these steps: • If it does not already exist, make the folder c:\cv_maps (can be any drive and folder) • Expand the MAPS GIS zip file to the folder (e.g., c:\cv_maps) - requires User Group id and password: see about User Group details below. • With CV XE GIS running, use File>Open>Dialog and open the project c:\cv_maps\maps1.gis. - where c:\cv_maps is the folder containing the unzipped files. - the start-up view will appear as shown in the view at the top of this section. - if you have not installed CV XE GIS, install the no fee version (register here). Scope of Market Area Profiles Market Area Profiles may be developed for any location in the U.S. The Market Area Profiles may be generated using data from Census 2010 and American Community Survey. The focus of this section is on census block profiles based on Census 2010. An update will expand on possibilities for visual analysis. Options to Create Map Views There are three options to create site maps such as the one shown above. • ProximityOne User Group members may use CV XE GIS tools to develop the GIS project. - this involves several technical steps by the user, summarized in a separate section. • CV XE GIS Level 3 automatically creates the GIS project (fee based). - a CV XE GIS feature imports the MAPS geo file and creates the ready-to-use GIS project. - Optionally use the CV API to attach additional user selected demographics to each block or elemental area. • ProximityOne creates map views such as those illustrated in above graphics (fee based). - this option requires no software or data file operations. ProximityOne User Group Join the ProximityOne User Group to keep up-to-date with new developments relating to metros and component geography decision-making information resources. Receive updates and access to tools and resources available only to members. Use this form to join the User Group. Support Using these Resources Learn more about accessing and using demographic-economic data and related analytical tools. Join us in a Data Analytics Lab session. There is no fee for these one-hour Web sessions. Each informal session is focused on a specific topic. The open structure also provides for Q&A and discussion of application issues of interest to participants. Additional Information ProximityOne develops geodemographic-economic data and analytical tools and helps organizations knit together and use diverse data in a decision-making and analytical framework. We develop custom demographic/economic estimates and projections, develop geographic and geocoded address files, and assist with impact and geospatial analyses. Wide-ranging organizations use our tools (software, data, methodologies) to analyze their own data integrated with other data. Follow ProximityOne on Twitter at www.twitter.com/proximityone. Contact us (888-364-7656) with questions about data covered in this section or to discuss custom estimates, projections or analyses for your areas of interest. |
|
|