
|
|
|
Healthcare Demographic Economic Analytics
Healthcare providers and the healthcare delivery system are challenged to determine what resources to make available at what locations and when. Assessing supply-side characteristics of the healthcare market is difficult at best. Current data on locations and capabilities of hospitals, ambulatory health care services (physicians, dentists, other healthcare practitioners, etc.), nursing and residential care facilities, and social assistance are multi-sourced and challenging to integrate. As the population ages, migrates and otherwise changes, healthcare needs change by location, type and in other ways. Current small area demographics of these demand measures are not readily available -- when knowing about changes in demand over the next several years is even more important. Changing economic circumstances and issues with insurance coverage affect the ability to pay and the demand for various healthcare resources. Healthcare Analytics This section provides an overview of the healthcare analytics focused on California. Resources and applications reviewed here can be emulated for other states and regions. The purpose of this section is to illustrate how a set of diverse, multi-sourced, healthcare supply and demand attributes can be organized for visual and geospatial analysis. Visual Analysis of Facilities, Characteristics and Patterns Geographic Information System (GIS) resources can help decision-makers and stakeholders more easily understand and collaborate on healthcare issues that are difficult to analyze using spreadsheets and tables. A few examples: • Relating Medically Underserved Areas (about MUAs/MUPs) to neighborhoods by economic properity. • Relating locations of healthcare facilities (hospitals, clinics) relate to MUAs. • Relating MUAs to Health Professional Shortage Areas (about HPSAs). • Determining which neighborhoods have the highest need for healthcare services. Get answers to these types of questions using multiple layers in a GIS project. The following view of the San Diego area and shows a mix of healthcare related demographic-economic characteristics. The cross-hatched pattern areas have been designated as Medically Underserved Areas (MUAs). Patterns of economic prosperity (median household income by block group) are shown by color patterns as highlighted in the legend at left of map view. It is easy to see where the MUAs are located. Many MUAs are located in areas with medium to higher economic prosperity. Locations of primary care facilities, shown by square markers, can be viewed contextually. 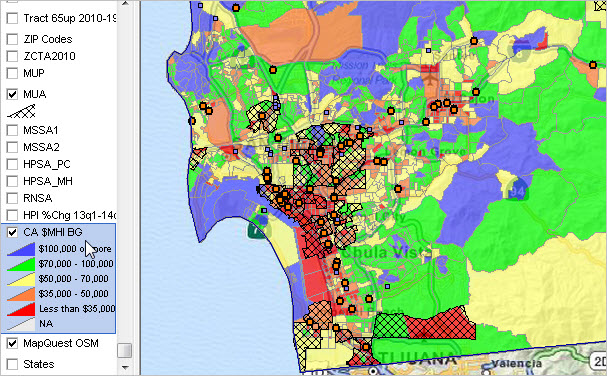 Click graphic for larger view. View developed using CV XE GIS and California DMI GIS Project. Using GIS resources, the map views can be displayed in different ways to accomodate the needs of geographic and/or subject matter focus. Zoom-in or out for a broader or more focused view. Label features of interest (e.g., hospital names). Click layers on or off (in legend panel at left of map panel) to view geographies or locations of specific interest. Add other data such as geocoded patient or incident data. Other views shown below illustrate some to these application views. Map views are just one part of the GIS resource benefits. Query tools can be used to highlight only locations of geographies that meet certain criteria, such as hospital bed capacity. GIS Project Layers ... scroll section The following shapefiles and related geographies are shown as layers in the GIS project.
• Roads & geographic infrastructure
• County and Metro demographic-economic estimates - single year of age by gender by race/origin annual 2010-2019 - General Demographics - Social Characteristics - Economic Characteristics - Housing Characteristics - quarterly number of households and businesses; 2010-2014, updated quarterly - healthcare industry attributes estimates and projections 2012-2019; new & evolving - health conditions and indicators estimates and projections 2012-2019; new & evolving • Census Block demographics • Block group demographic-economic estimates • Census Tract demographic-economic estimates & projections - single year of age by gender by race/origin annual 2010-2019 - General Demographics - Social Characteristics - Economic Characteristics - Housing Characteristics - quarterly number of households and businesses; 2010-2014, updated quarterly • K-12 Schools/school attendance zones • School District demographic-economic estimates & projections - single year of age by gender by race/origin annual 2010-2019 • County, Metro & State demographic-economic estimates & projections - single year of age by gender by race/origin annual 2010-2019 • ZIP Code demographic-economic estimates - single year of age by gender by race/origin annual 2010-2019 • Geocoded & attribute augmented facility locations - Hospitals - Long-term care facilities - Primary Care Clinics - Specialized Clinics - Home health agencies and hospice • Health Professional Shortage Areas - Primary Care - Mental Health - Dental - Registered Nurse • Medically Underserved Areas/ Medically Underserved Populations - MUA - MUP Statewide Hospitals and Primary Care Facilities 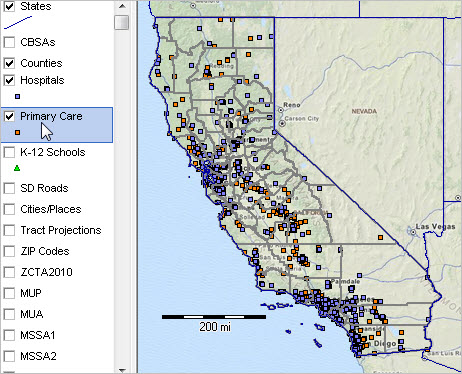 Hospitals and Primary Care Facilities: Zoom to Southern California 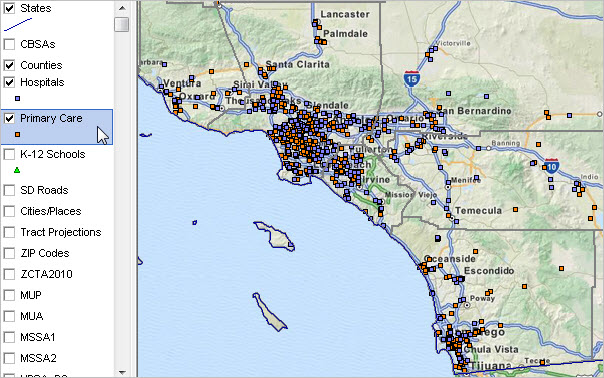 San Diego Area: Medically Underserved Areas 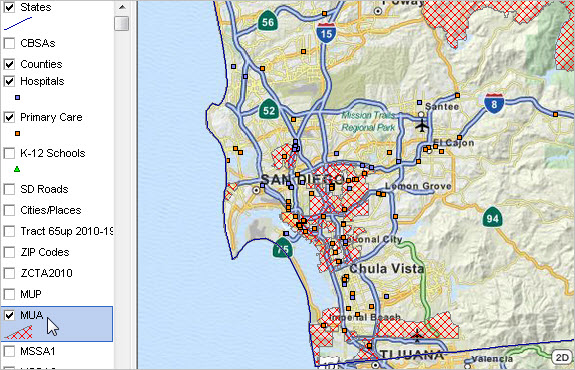 San Diego Area: Healthcare Professional Shortage Areas 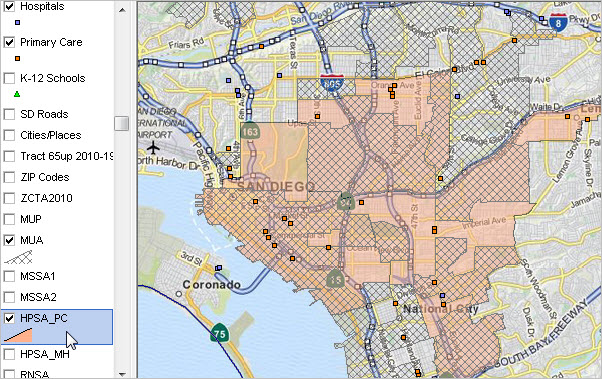 Additional Information ProximityOne develops geographic-demographic-economic data and analytical tools and helps organizations knit together and use diverse data in a decision-making and analytical framework. We develop custom demographic/economic estimates and projections, develop geographic and geocoded address files, and assist with impact and geospatial analyses. Wide-ranging organizations use our tools (software, data, methodologies) to analyze their own data integrated with other data. Follow ProximityOne on Twitter at www.twitter.com/proximityone. Contact ProximityOne (888-364-7656) with questions about data covered in this section or to discuss custom estimates, projections or analyses for your areas of interest. |
|
|