|
|
|
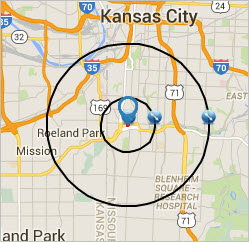
-- visualizing market/study areas Map graphics are an important part of most demographic-economic analyses and essential for many applications. Not only are are maps needed to show geographic boundaries and the relative location of geography within a broader area, they can come alive by showing patterns. A thematic pattern map of median household income by block group is a good example; higher and lower areas of economic prosperity by neighborhood can be immediately determined. Map graphics can improve our ability to communicate complex information. Convey information faster. Make more compelling presentations. Collaborate more effectively through the use of map graphics. The focus of this section is on creating and using KML files to prepare map graphics for use in developing Market-Study Area Comparative Analysis Reports. These files and map graphics also have broader uses. Steps are reviewed to develop the KML circular area map graphics files, convert them to shapefile structure and integrate both files into mapping and GIS applications and put them into operational use. KML (Keyhole Markup Language) files are XML structured files useful for visualizing geographic objects (like circles) using Internet-based browsers, notably Google Earth. Why develop/use KML files? They are easy to create with precision, there is little to no learning curve, they can be used in many venues and they are free to develop. KML files can be used side-by-side with shapefiles. Shapefiles, structured very much unlike KML files, are the dominant vector-based file structure used in GIS applications involved in both viewing and geospatial analysis. Developing Circular KML Files & Map Graphics An "objective view" of this section is shown in the following graphic. The graphic shows a study site location (red marker), 1-mile & 3-mile radius circles. The site location is a Starbucks located at 302 Nichols Road, Kansas City, MO 64112. The view shows a circular KML-based graphics in context of patterns of median household income by block group. Develop similar views for any area, any site circular configuration, using steps reviewed in this section. 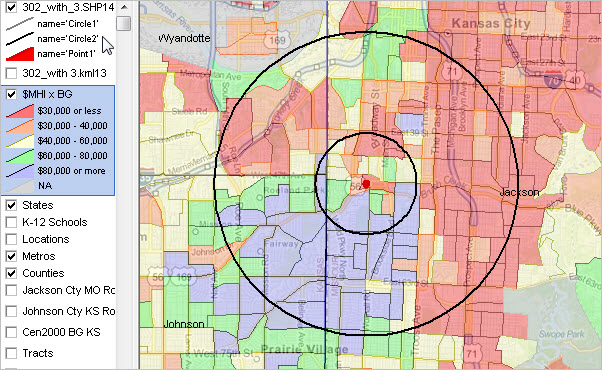
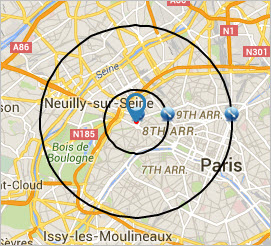
- view developed using CV XE GIS Creating the KML Circular Graphics File Proceed through the next steps to develop a KML file used to create the graphic below on left -- a Starbucks located at 302 Nichols Road, Kansas City, MO 64112. Graphic on the right is a Starbucks location in Paris, used to illustrate this process works globally. Both graphics include study area center point and 1-mile and 3-mile radius circles.
Start the create KML file application • Key in the address 302 Nichols Road, Kansas City, MO 64112 to Google Maps .. see the latitude-longitude (39.041548,-94.592965) in the URL bar. .. recommended way to get the lat-lon unless sourcing the lat-lon from another reference. • Open this web page to create the circles and save the results as a KML file. • Refresh this page if making a new KML file. • Set the colors and lines to medium, blank and clear. • Enter coordinates -- key in latitude 39.041548 and longitude -94.592965 .. these for for this example; enter the values for your location of interest Add center point • In the Radius Distance, key in 0.05 miles (this is recommended for any site). • Click Draw Radius blue button (at right of longitude). Add site 1 circle • In the Radius Distance, key in 1.00 miles (use your preferred radius for inner circle). • Click Draw Radius blue button (at right of longitude). Add site 2 circle • In the Radius Distance, key in 3.00 miles (use your preferred radius for inner circle). • Click Draw Radius blue button (at right of longitude). View study area geography • Optionally navigate up to the map view and make the view similar to the graphic at the top of this page .. this step is not required but might be useful to verify the study area appearance. Save KML file • Navigate down the page to "Google Earth KML Output". Click the blue button Generate KML. • Click "Download KML file Here." Save the file to a folder and make a note of the file path and name .. save the file as c:\sitereport\302nichols.kml (this file and filename are used below). Done • The three part KML file has been created and saved to the local computer. • Finished using this browser application. This same process may be used again to create similarly structured KML files of any radius about any point for any location in the world. Loading a KML file into Google Maps Optionally create the objective map graphic using the following steps. Or, the KML file may be used with the CV XE GIS software (see below) enabling yet further analytical possibilities. • Click this link to start the Google MyMaps application. • When the new page opens click create new map button • Next click import button • Enter the file path/name as created above (c:\sitereport\302nichols.kml), or any KML file. • Edit the MyMaps rendering to achieve preferred view. • Use preferred screen capture tool to save that part of the map view as a graphic for the study report. Using the KML File with an Existing GIS Project and converting the KML file to shapefile structure 1. Add the KML file to an Existing CV XE GIS Project • Start the CV XE GIS software and open the project file c:\cvxe\1\cvxe_us2.gis (distributed with installer). .. uncheck Locations and $MHI x BG layers in legend panel. • Click the AddLayer button (second button from left on toolbar) • Select the KML file that was created above (c:\sitereport\302nichols.kml) .. circles appear in the map window. • Use LayerEditor to adjust settings for KML layer (transparent, bold outline) • Navigate to zoom-in view and smaller map window. • Use Toolbar button Save to Image (button 7 from left) to save the map window view to a .jpg file. Navigate to this view: 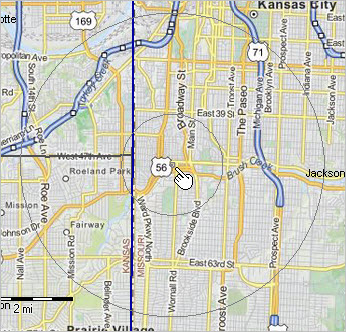 2. Converting a KML File to a Shapefile This step requires the CV XE GIS Basic or higher level version. After the KML layer appears in the above sequence, proceed as follows: • Click File>ExportShapefile. • Select the KML layer name. • Set Coordinate System edit box value to NAD83. • Click OK button. • On the Export Layer/FileSave dialog, select an output file path and name. • The shapefile is generated and may be reused with any GIS project. 3. Editing attributes of the study area shapefile and project file There are three shapes in the shapefile (center point, circle 1, circle 2). Modify the appearance of these shapes/objects by using the Select tool (mouse in Select mode). • In legend panel click on circles layer; name turns blue indicating this is the active layer. • In the map window, click in the circle; the profile/editor appears (pop-up) • Initially all three shapes have the name "Polygon". .. change the object names successively to Point1 (the small circle), Circle1 and Circle2. • The shapefile attributes have been permanently changed. • When each shape/object has been renamed, use the LayerEditor to modify the appearance of each shape. .. the changes modify the project file and not the shapefile. .. optional save the project (overwriting the former version) or save the project with a new name. Renaming a shape to "Point1" Click for larger view 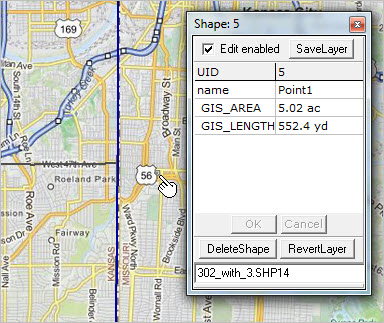 Using LayerEditor to set attributes of the study area layer Click for larger view  View of final study area layer in context of broader project Click for larger view 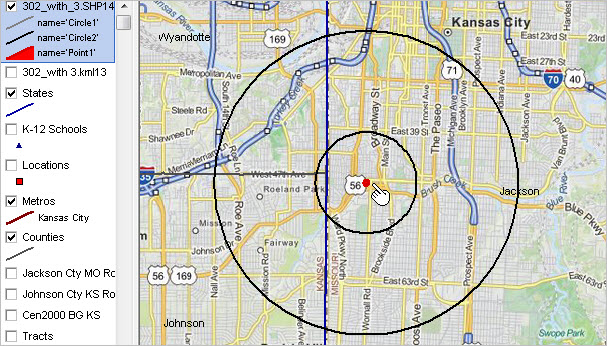 View as above with $MHI x BG checked on/visible Click for larger view Support Using these Resources Learn more about accessing and using demographic-economic data and related analytical tools. Join us in a Data Analytics Lab session. There is no fee for these one-hour Web sessions. Each informal session is focused on a specific topic. The open structure also provides for Q&A and discussion of application issues of interest to participants. ProximityOne User Group Join the ProximityOne User Group to keep up-to-date with new developments relating to metros and component geography decision-making information resources. Receive updates and access to tools and resources available only to members. Use this form to join the User Group. Additional Information SiteReport has been developed by ProximityOne. ProximityOne collaborates with the University of Missouri to operate a Data Analytics Lab. Some parts of SiteReport use underlying data developed by the University and the Census Bureau. Contact us for information about operating a Data Analytics Lab. ProximityOne develops geodemographic-economic data and analytical tools and helps organizations knit together and use diverse data in a decision-making and analytical framework. We develop custom demographic/economic estimates and projections, develop geographic and geocoded address files, and assist with impact and geospatial analyses. Wide-ranging organizations use our tools (software, data, methodologies) to analyze their own data integrated with other data. Follow ProximityOne on Twitter at www.twitter.com/proximityone. Contact us (888-364-7656) with questions about data covered in this section or to discuss custom estimates, projections or analyses for your areas of interest. |
|
|