|
|
Sandpoint, ID
-- demographic-economic characteristics and patterns
The Census 2010 population of Sandpoint, ID was 7,365 (1,849 persons per square mile).
See more about this place in context of other places using the population estimates table. View, rank, compare demographic-economic data similar to data in profile below using this interactive table. See related America's Communities Program information resources.
The profile shown below has been developed using the ProximityOne Outlook2020 software and API-based information resource. Outlook2020 can be used to develop this type of profile for any ZIP code area, census tract, city, county or school district. Outlook2020 provides access to ProximityOne estimates and projections to 2020.
The table presented below shows demographic-economic characteristics for this place based on the American Community Survey (ACS). ACS provides post-Census 2010 annual updates for a wide array of demographic-economic data not available from Census 2010.
ACS estimates are available for all geographies (U.S. wall-to-wall) using the 5-year estimates. For areas of 65,000 population or more, 1-year estimates are available. See more about ACS. Estimates shown in this profile are based on ACS 5-year estimates. See more about comparing these data over time.
Patterns of Economic Prosperity by Neighborhood
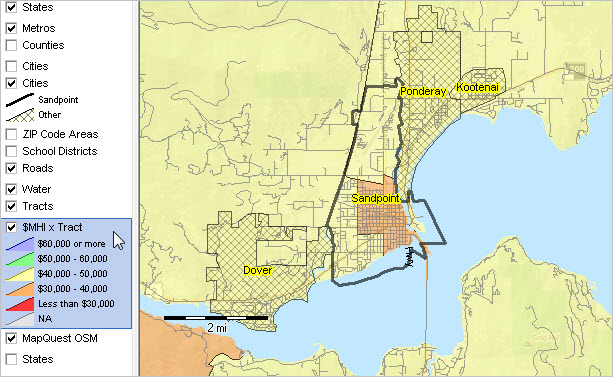
-- Sandpoint, ID shown with bold black boundary
-- colors (see legend left of map) show patterns of median household income by census tract
-- view developed with CV XE GIS
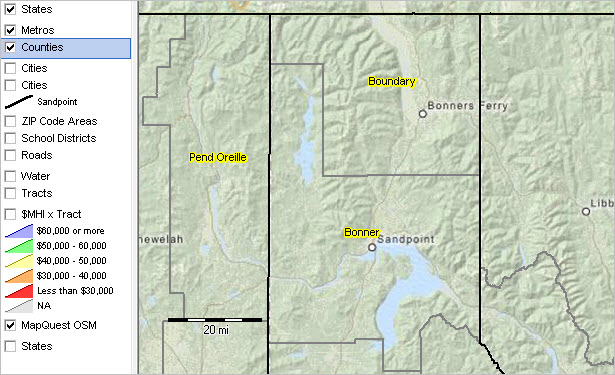
Sandpoint in Context of Bonner County
Sandpoint, ID Demographic-Economic Characteristics
| | -- ACS 2012 5 year -- | -- ACS 2013 5 year -- | -- Difference --
| | | Value | Percent | Value | Percent | Value | Percent |
| Total Population | 7,397 | 100.00 | 7,414 | 100.00 | 17 | 0.23 |
| �Male | 3,262 | 44.10 | 3,233 | 43.61 | -29 | -0.89 |
| �Female | 4,135 | 55.90 | 4,181 | 56.39 | 46 | 1.11 |
| Age | | | | | | |
| �Under 5 years | 594 | 8.03 | 541 | 7.30 | -53 | -8.92 |
| �5-9 years | 635 | 8.58 | 537 | 7.24 | -98 | -15.43 |
| �10-14 years | 454 | 6.14 | 456 | 6.15 | 2 | 0.44 |
| �15-19 years | 462 | 6.25 | 418 | 5.64 | -44 | -9.52 |
| �20-24 years | 585 | 7.91 | 530 | 7.15 | -55 | -9.40 |
| �25-34 years | 829 | 11.21 | 867 | 11.69 | 38 | 4.58 |
| �35-44 years | 944 | 12.76 | 846 | 11.41 | -98 | -10.38 |
| �45-54 years | 935 | 12.64 | 1,048 | 14.14 | 113 | 12.09 |
| �55-59 years | 606 | 8.19 | 673 | 9.08 | 67 | 11.06 |
| �60-64 years | 283 | 3.83 | 353 | 4.76 | 70 | 24.73 |
| �65-74 years | 499 | 6.75 | 606 | 8.17 | 107 | 21.44 |
| �75-84 years | 242 | 3.27 | 269 | 3.63 | 27 | 11.16 |
| �85+ years | 329 | 4.45 | 270 | 3.64 | -59 | -17.93 |
| �Median age | 36.50 | | 38.60 | | 2.10 | 5.75 |
| Race/Origin | | | | | | |
| �One Race | 7,253 | 98.05 | 7,294 | 98.38 | 41 | 0.57 |
| ��White | 7,088 | 95.82 | 7,121 | 96.05 | 33 | 0.47 |
| ��Black/African American | 50 | 0.68 | 11 | 0.15 | -39 | -78.00 |
| ��American Indian/Alaska Native | 50 | 0.68 | 38 | 0.51 | -12 | -24.00 |
| ��Asian | 46 | 0.62 | 47 | 0.63 | 1 | 2.17 |
| ��Native Hawaiian/Pacific Islander | 0 | 0.00 | 8 | 0.11 | 8 | 0.00 |
| ��Some other race | 19 | 0.26 | 69 | 0.93 | 50 | 263.16 |
| �Two or more races | 144 | 1.95 | 120 | 1.62 | -24 | -16.67 |
| �Hispanic (of any race) | 339 | 4.58 | 361 | 4.87 | 22 | 6.49 |
| Households by Type | | | | | | |
| �Total households | 3,293 | 100.00 | 3,294 | 100.00 | 1 | 0.03 |
| ��Families | 1,652 | 50.17 | 1,553 | 47.15 | -99 | -5.99 |
| ��Nonfamily households | 1,641 | 49.83 | 1,741 | 52.85 | 100 | 6.09 |
| �Average Household Size | 2.14 | | 2.14 | | 0.00 | 0.00 |
| �Average Family Size | 2.98 | | 3.08 | | 0.10 | 3.36 |
| Relationship | | | | | | |
| �Population in households | 7,063 | 95.48 | 7,059 | 95.21 | -4 | -0.06 |
| School Enrollment | | | | | | |
| �Population 3 & over enrolled | 1,729 | 100.00 | 1,640 | 100.00 | -89 | -5.15 |
| ��Nursery school, preschool | 211 | 12.20 | 170 | 10.37 | -41 | -19.43 |
| ��Kindergarten | 27 | 1.56 | 57 | 3.48 | 30 | 111.11 |
| ��Elementary school (grades 1-8) | 894 | 51.71 | 801 | 48.84 | -93 | -10.40 |
| ��High school (grades 9-12) | 414 | 23.94 | 362 | 22.07 | -52 | -12.56 |
| ��College or graduate school | 183 | 10.58 | 250 | 15.24 | 67 | 36.61 |
| Educational Attainment | | | | | | |
| �Population 25 years & over | 4,667 | 100.00 | 4,932 | 100.00 | 265 | 5.68 |
| ��Less than 9th grade | 74 | 1.59 | 103 | 2.09 | 29 | 39.19 |
| ��9th to 12th grade, no diploma | 348 | 7.46 | 355 | 7.20 | 7 | 2.01 |
| ��High school graduate (incl equiv) | 1,533 | 32.85 | 1,523 | 30.88 | -10 | -0.65 |
| ��Some college, no degree | 1,357 | 29.08 | 1,466 | 29.72 | 109 | 8.03 |
| ��Associate's degree | 333 | 7.14 | 462 | 9.37 | 129 | 38.74 |
| ��Bachelor's degree | 599 | 12.83 | 657 | 13.32 | 58 | 9.68 |
| ��Graduate or professional degree | 423 | 9.06 | 366 | 7.42 | -57 | -13.48 |
| ��Percent high school graduate or higher | 91.00 | | 90.70 | | -0.30 | -0.33 |
| ��Percent bachelor's degree or higher | 21.90 | | 20.70 | | -1.20 | -5.48 |
| Residence 1 year ago | 7,332 | 100.00 | 7,409 | 100.00 | 77 | 1.05 |
| �Same house | 5,762 | 78.59 | 5,716 | 77.15 | -46 | -0.80 |
| �Different house in U.S. | 1,564 | 21.33 | 1,693 | 22.85 | 129 | 8.25 |
| ��Same county | 1,091 | 14.88 | 1,024 | 13.82 | -67 | -6.14 |
| ��Different county | 473 | 6.45 | 669 | 9.03 | 196 | 41.44 |
| ���Same state | 150 | 2.05 | 200 | 2.70 | 50 | 33.33 |
| ���Different state | 323 | 4.41 | 469 | 6.33 | 146 | 45.20 |
| �Abroad | 6 | 0.08 | 0 | 0.00 | -6 | -100.00 |
| Language Spoken at Home | | | | | | |
| �Population 5 years & over | 6,803 | 100.00 | 6,873 | 100.00 | 70 | 1.03 |
| ��English only | 6,631 | 97.47 | 6,662 | 96.93 | 31 | 0.47 |
| ��Language other than English | 172 | 2.53 | 211 | 3.07 | 39 | 22.67 |
| ���Speak English less than very well | 37 | 0.54 | 37 | 0.54 | 0 | 0.00 |
| ���Spanish | 64 | 0.94 | 92 | 1.34 | 28 | 43.75 |
| ����Speak English less than very well | 16 | 0.24 | 14 | 0.20 | -2 | -12.50 |
| Employment Status | | | | | | |
| �Population 16 years & over | 5,567 | 100.00 | 5,742 | 100.00 | 175 | 3.14 |
| ��In labor force | 3,649 | 65.55 | 3,615 | 62.96 | -34 | -0.93 |
| ���Civilian labor force | 3,649 | 65.55 | 3,615 | 62.96 | -34 | -0.93 |
| ����Employed | 3,419 | 61.42 | 3,394 | 59.11 | -25 | -0.73 |
| ����Unemployed | 230 | 4.13 | 221 | 3.85 | -9 | -3.91 |
| ���Armed forces | 0 | 0.00 | 0 | 0.00 | 0 | 0.00 |
| ��Not in labor force | 1,918 | 34.45 | 2,127 | 37.04 | 209 | 10.90 |
| ��Civilian labor force | 3,649 | 65.55 | 3,615 | 62.96 | -34 | -0.93 |
| ���Percent unemployed | 6.30 | | 6.10 | | -0.20 | -3.17 |
| Employment by Industry | | | | | | |
| �Civilian employed population 16 years & over | 3,419 | 100.00 | 3,394 | 100.00 | -25 | -0.73 |
| ��Agriculture, forestry, fishing & hunting, mining | 36 | 1.05 | 65 | 1.92 | 29 | 80.56 |
| ��Construction | 221 | 6.46 | 336 | 9.90 | 115 | 52.04 |
| ��Manufacturing | 534 | 15.62 | 523 | 15.41 | -11 | -2.06 |
| ��Wholesale trade | 47 | 1.37 | 76 | 2.24 | 29 | 61.70 |
| ��Retail trade | 610 | 17.84 | 693 | 20.42 | 83 | 13.61 |
| ��Transportation, warehousing, utilities | 123 | 3.60 | 132 | 3.89 | 9 | 7.32 |
| ��Information | 84 | 2.46 | 74 | 2.18 | -10 | -11.90 |
| ��Finance, insurance, real estate | 68 | 1.99 | 80 | 2.36 | 12 | 17.65 |
| ��Professional, scientific, management | 211 | 6.17 | 113 | 3.33 | -98 | -46.45 |
| ��Education & health care | 565 | 16.53 | 660 | 19.45 | 95 | 16.81 |
| ��Arts, entertainment, recreation | 563 | 16.47 | 393 | 11.58 | -170 | -30.20 |
| ��Other services | 275 | 8.04 | 179 | 5.27 | -96 | -34.91 |
| ��Public administration | 82 | 2.40 | 70 | 2.06 | -12 | -14.63 |
| Household Income | | | | | | |
| �Total households | 3,293 | 100.00 | 3,294 | 100.00 | 1 | 0.03 |
| ��Less than $10,000 | 367 | 11.14 | 477 | 14.48 | 110 | 29.97 |
| ��$10,000 to $14,999 | 246 | 7.47 | 228 | 6.92 | -18 | -7.32 |
| ��$15,000 to $24,999 | 358 | 10.87 | 327 | 9.93 | -31 | -8.66 |
| ��$25,000 to $34,999 | 533 | 16.19 | 539 | 16.36 | 6 | 1.13 |
| ��$35,000 to $49,999 | 704 | 21.38 | 674 | 20.46 | -30 | -4.26 |
| ��$50,000 to $74,999 | 473 | 14.36 | 475 | 14.42 | 2 | 0.42 |
| ��$75,000 to $99,999 | 297 | 9.02 | 253 | 7.68 | -44 | -14.81 |
| ��$100,000 to $149,999 | 182 | 5.53 | 190 | 5.77 | 8 | 4.40 |
| ��$150,000 to $199,999 | 30 | 0.91 | 50 | 1.52 | 20 | 66.67 |
| ��$200,000 or more | 103 | 3.13 | 81 | 2.46 | -22 | -21.36 |
| ��Median household income | 38,519 | | 37,521 | | -998 | -2.59 |
| ��Mean household income | 50,152 | | 49,368 | | -784 | -1.56 |
| Percent Families & People in Poverty | | | | | | |
| �All families | 14.20 | | 12.20 | | -2.00 | -14.08 |
| �All people | 17.60 | | 17.80 | | 0.20 | 1.14 |
| Housing Occupancy | | | | | | |
| �Total housing units | 3,729 | 100.00 | 3,732 | 100.00 | 3 | 0.08 |
| ��Occupied housing units | 3,293 | 88.31 | 3,294 | 88.26 | 1 | 0.03 |
| ��Vacant housing units | 436 | 11.69 | 438 | 11.74 | 2 | 0.46 |
| �Homeowner vacancy rate | 0.00 | | 0.00 | | 0.00 | 0.00 |
| �Rental vacancy rate | 4.90 | | 3.30 | | -1.60 | -32.65 |
| Units in Structure | | | | | | |
| �Total housing units | 3,729 | 100.00 | 3,732 | 100.00 | 3 | 0.08 |
| ��1-unit, detached | 1,915 | 51.35 | 1,851 | 49.60 | -64 | -3.34 |
| ��1-unit, attached | 256 | 6.87 | 317 | 8.49 | 61 | 23.83 |
| ��2 units | 180 | 4.83 | 220 | 5.89 | 40 | 22.22 |
| ��3 or 4 units | 267 | 7.16 | 237 | 6.35 | -30 | -11.24 |
| ��5 to 9 units | 335 | 8.98 | 362 | 9.70 | 27 | 8.06 |
| ��10 to 19 units | 170 | 4.56 | 166 | 4.45 | -4 | -2.35 |
| ��20 or more units | 376 | 10.08 | 409 | 10.96 | 33 | 8.78 |
| ��Mobile home, boat, RV etc. | 220 | 5.90 | 158 | 4.23 | -62 | -28.18 |
| Year Structure Built | | | | | | |
| �Total housing units | 3,729 | 100.00 | 3,732 | 100.00 | 3 | 0.08 |
| ��2010 or later | 0 | 0.00 | 0 | 0.00 | 0 | 0.00 |
| ��2000 to 2009 | 882 | 23.65 | 877 | 23.50 | -5 | -0.57 |
| ��1990 to 1999 | 607 | 16.28 | 498 | 13.34 | -109 | -17.96 |
| ��1980 to 1989 | 432 | 11.58 | 491 | 13.16 | 59 | 13.66 |
| ��1970 to 1979 | 633 | 16.98 | 659 | 17.66 | 26 | 4.11 |
| ��1960 to 1969 | 274 | 7.35 | 259 | 6.94 | -15 | -5.47 |
| ��1950 to 1959 | 153 | 4.10 | 177 | 4.74 | 24 | 15.69 |
| ��1940 to 1949 | 147 | 3.94 | 164 | 4.39 | 17 | 11.56 |
| ��1939 or earlier | 601 | 16.12 | 607 | 16.26 | 6 | 1.00 |
| Housing Tenure | | | | | | |
| �Occupied housing units | 3,293 | 100.00 | 3,294 | 100.00 | 1 | 0.03 |
| ��Owner-occupied | 1,484 | 45.07 | 1,607 | 48.79 | 123 | 8.29 |
| ��Renter-occupied | 1,809 | 54.93 | 1,687 | 51.21 | -122 | -6.74 |
| �Avg household size, owner-occupied | 2.26 | | 2.38 | | 0.12 | 5.31 |
| �Avg household size, renter-occupied | 2.05 | | 1.92 | | -0.13 | -6.34 |
| Year Householder Moved Into Unit | | | | | | |
| �Occupied housing units | 3,293 | 100.00 | 3,294 | 100.00 | 1 | 0.03 |
| ��2010 or later | 563 | 17.10 | 935 | 28.38 | 372 | 66.07 |
| ��2000 to 2009 | 2,020 | 61.34 | 1,681 | 51.03 | -339 | -16.78 |
| ��1990 to 1999 | 416 | 12.63 | 356 | 10.81 | -60 | -14.42 |
| ��1980 to 1989 | 140 | 4.25 | 198 | 6.01 | 58 | 41.43 |
| ��1970 to 1979 | 79 | 2.40 | 64 | 1.94 | -15 | -18.99 |
| ��1969 or earlier | 75 | 2.28 | 60 | 1.82 | -15 | -20.00 |
| Occupants per room | | | | | | |
| �1.00 or less | 3,190 | 96.87 | 3,181 | 96.57 | -9 | -0.28 |
| �1.01 to 1.50 | 103 | 3.13 | 98 | 2.98 | -5 | -4.85 |
| �1.51 or more | 0 | 0.00 | 15 | 0.46 | 15 | 0.00 |
| Housing Value (owner occupied units) | 1,484 | 100.00 | 1,607 | 100.00 | 123 | 8.29 |
| �Less than $50,000 | 39 | 2.63 | 29 | 1.80 | -10 | -25.64 |
| �$50,000 to $99,999 | 76 | 5.12 | 118 | 7.34 | 42 | 55.26 |
| �$100,000 to $149,999 | 327 | 22.04 | 322 | 20.04 | -5 | -1.53 |
| �$150,000 to $199,999 | 315 | 21.23 | 362 | 22.53 | 47 | 14.92 |
| �$200,000 to $299,999 | 500 | 33.69 | 577 | 35.91 | 77 | 15.40 |
| �$300,000 to $499,999 | 157 | 10.58 | 172 | 10.70 | 15 | 9.55 |
| �$500,000 to $999,999 | 60 | 4.04 | 27 | 1.68 | -33 | -55.00 |
| �$1,000,000 or more | 10 | 0.67 | 0 | 0.00 | -10 | -100.00 |
| �Median | 197,000 | | 193,800 | | -3,200 | -1.62 |
| Selected Monthly Owner Costs (SMOC) | | | | | | |
| �Housing units with a mortgage | 941 | 100.00 | 1,064 | 100.00 | 123 | 13.07 |
| ��Less than $300 | 0 | 0.00 | 0 | 0.00 | 0 | 0.00 |
| ��$300 to $499 | 27 | 2.87 | 27 | 2.54 | 0 | 0.00 |
| ��$500 to $699 | 26 | 2.76 | 34 | 3.20 | 8 | 30.77 |
| ��$700 to $999 | 207 | 22.00 | 232 | 21.80 | 25 | 12.08 |
| ��$1,000 to $1,499 | 315 | 33.48 | 436 | 40.98 | 121 | 38.41 |
| ��$1,500 to $1,999 | 197 | 20.94 | 174 | 16.35 | -23 | -11.68 |
| ��$2,000 or more | 169 | 17.96 | 161 | 15.13 | -8 | -4.73 |
| ��Median | 1,319 | | 1,256 | | -63 | -4.78 |
| Gross Rent | | | | | | |
| �Occupied units paying rent | 1,798 | 100.00 | 1,682 | 100.00 | -116 | -6.45 |
| ��Less than $200 | 94 | 5.23 | 135 | 8.03 | 41 | 43.62 |
| ��$200 to $299 | 158 | 8.79 | 190 | 11.30 | 32 | 20.25 |
| ��$300 to $499 | 111 | 6.17 | 170 | 10.11 | 59 | 53.15 |
| ��$500 to $749 | 490 | 27.25 | 459 | 27.29 | -31 | -6.33 |
| ��$750 to $999 | 508 | 28.25 | 396 | 23.54 | -112 | -22.05 |
| ��$1,000 to $1,499 | 353 | 19.63 | 235 | 13.97 | -118 | -33.43 |
| ��$1,500 or more | 84 | 4.67 | 97 | 5.77 | 13 | 15.48 |
| ��Median | 768 | | 704 | | -64 | -8.33 |
| | | | | | |
Support Using these Resources
Learn more about demographic economic data and related analytical tools.
Join us in a Data Analytics Lab session.
There is no fee for these Web sessions.
Each informal session is focused on a specific topic.
The open structure also provides for Q&A and discussion of application issues of interest to participants.
ProximityOne User Group
Join the ProximityOne User Group
to keep up-to-date with new developments relating to geographic-demographic-economic decision-making information resources.
Receive updates and access to tools and resources available only to members.
Use this form to join the User Group.
Additional Information
ProximityOne develops geographic-demographic-economic data and analytical tools and helps organizations knit together and use diverse data in a decision-making and analytical framework. We develop custom demographic/economic estimates and projections, develop geographic and geocoded address files, and assist with impact and geospatial analyses.
Wide-ranging organizations use our software, data and methodologies to analyze their own data integrated with other data.
Follow ProximityOne on Twitter at
www.twitter.com/proximityone.
Contact ProximityOne (888-364-7656) with questions about data covered in this section or to discuss custom estimates, projections or analyses for your areas of interest.
|
