
|
|
|
... extract coordinates; build polyline/marker files for use with Google maps Use the Shp2XML software to extract shapefile geometry and output those data to XML-structured file. Shp2XML generates an XML file (text file) that contains the coordinates of the each shape in the user selected shapefile (or a subset of shapes in the shapefile if a query is applied). Optionally save the XML file in XLS format. Shapefiles do not contain the geometry coordinates in the shapefile DBF and are not directly viewable or extractable without specialized software. Many applications require coordinates only available in shapefiles. For example, the XML file can be used as a polyline or marker file with Bing or Google maps. The coordinates list can be processed by wide-ranging geospatial applications. Using the Shapefile Geometry XML File See these Google Maps API applications that use the Shp2XML XML files: • Fort Bend County, TX by census tract & Sugar Land • Warren County, IA by census tract & Indianola • Warren County, MO by census tract & Warrenton • Washington, DC by census tract • Washington, DC by ZIP Code • Kansas City, MO-KS Area by ZIP Code • Houston, TX area school districts Steps to develop the XML file are further described below. Use Shp2XML to develop XML files for applications of this type for wide-ranging types for geography. GIS Project View Shp2XML is used to open a GIS project and display a view of patterns of population, 2010-13, by county; zoom-in view of Missouri. Layers in the project are shown in the lower right legend panel.  Click graphic for larger view The above view illustrates use of identify tool (pointer selected as tool upper right panel) to click on a shape(county in this example) and display attributes in the shapefile ".dbf". See mini-profile to the right of the map. The coordinates for the shape are embedded in the shapefile ".shp" and are not part of the ".dbf". This section illustrates use of Shp2XML with Census Bureau TIGER/Line files. Use Shp2XML to generate a XML file containing "shape coordinates" for a county by block, state by block group, state by census tract, county by roads/edges, state by zip code, state by city/place, state by county, U.S. by state, among others. Use any shapefile ... world by country. In the case of a state by census tract shapefile, the shapefile is comprised of a set of shapes which are census tracts. The shapefile has the geometry of the bounding coordinates for each census tract/shape. In the case of a county by edges/roads shapefile, the shapefile is comprised of a set of shapes which correspond to road/line segments between two intersections or nodes. The shapefile has the geometry of the vertices coordinates for each line segment/shape. Shp2XML Features Shp2XML features include: • Extract coordinates from any shapefile into an XML structured text file. • Open multiple shapefiles and view as layers in GIS map viewer. • Modify layer attributes such as labels, colors, line features, fill patterns, etc. • Navigate the view of the shapefile(s) using zoom and pan operations. • Use the identify tool to click on a shape in map to view shape attributes. • For extraction, select a name and code field to be used in the XML file created. • For extraction, optionally use query/filter to extract only selected shapes. • Save XML geometry file in XLS structure. Installing Shp2XML ShHp2XML Level 1 is available at no fee to members of the ProximityOne User Group (no fee, join now). Run the Shp2XML installer to install Shp2XML on a Windows machine. A User Group userid ID is required. Included with the installation are the Washington, DC Census 2010 census tract shapefile and all roads/edges shapefile (both TIGER 2014 vintage). Also included is the GIS project fileset used to develop the view shown at the top of this section. Application Examples & Additional Information The remainder of this section covers the following topics: • Polygon Shapefiles -- exporting geometry/creating XML & XLS file from a county by census tract shapefile. • Lines/Edges Shapefiles -- exporting geometry/creating XML & XLS file from a county by roads shapefile. -- illustrates use of query to output only selected shapes. • Acquiring Shapefiles -- Acquiring/downloading Census-sourced shapefile for use with Shp2XML. Using Shp2XML -- an example of exporting census tract boundaries The Shp2XML start-up view is shown in the following graphic. The map view shows Washington, DC by Census 2010 census tracts. The view is based on the shapefile (cb_2013_11_tract_500k.shp) included with the installer, 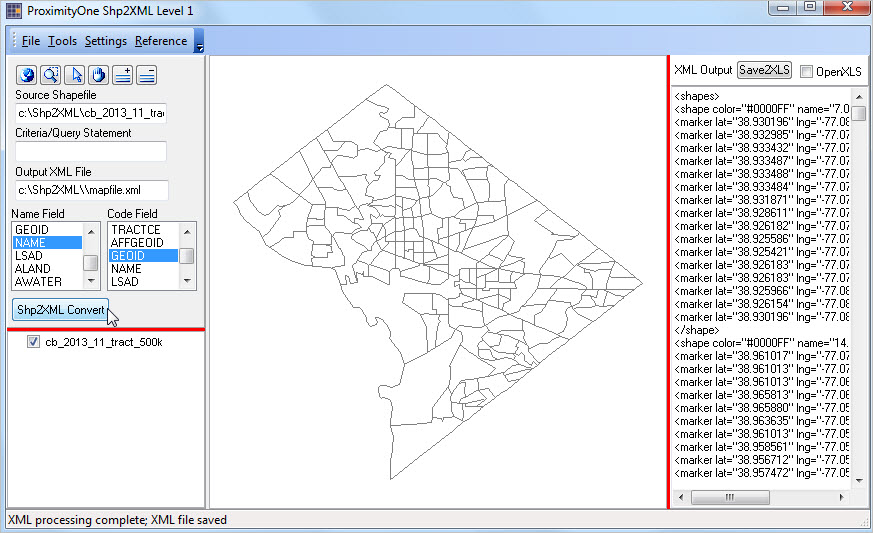 Click graphic for larger view User controls and legend panel are shown to the left of the map view panel. The XML file generated is shown to the right of the map view. Basic steps to use Shp2XML are: • Acquire the shapefile to be used. • Use the Shp2XML File>Open Shapefile to open the shapefile. • Optionally set a filter condition. • Optionally set a folder/name for the XML file to be generated. • Select a field to be used as NAME and field to be used as CODE using list boxes. • Click the Shp2XML Convert button. The XML file is generated and displayed in the rightmost panel. A partial display of the XML file is shown below. The scroll section below shows coordinates in XML structure for the first and second shapes (census tracts) and the last shape (census tract). Other tracts are omitted from this scroll section for purposes of brevity.
<shapes>
<shape color="#0000FF" name="7.01" code="11001000701"> <marker lat="38.930196" lng="-77.080390"/> <marker lat="38.932985" lng="-77.079155"/> <marker lat="38.933432" lng="-77.079765"/> <marker lat="38.933487" lng="-77.079572"/> <marker lat="38.933488" lng="-77.077048"/> <marker lat="38.933484" lng="-77.072415"/> <marker lat="38.931871" lng="-77.072650"/> <marker lat="38.928611" lng="-77.073162"/> <marker lat="38.926182" lng="-77.073188"/> <marker lat="38.925586" lng="-77.073858"/> <marker lat="38.925421" lng="-77.077058"/> <marker lat="38.926183" lng="-77.077048"/> <marker lat="38.926183" lng="-77.078979"/> <marker lat="38.925966" lng="-77.080002"/> <marker lat="38.926154" lng="-77.081514"/> <marker lat="38.930196" lng="-77.080390"/> </shape> <shape color="#0000FF" name="14.02" code="11001001402"> <marker lat="38.961017" lng="-77.073309"/> <marker lat="38.961013" lng="-77.070831"/> <marker lat="38.961013" lng="-77.066238"/> <marker lat="38.965813" lng="-77.062046"/> <marker lat="38.965880" lng="-77.059129"/> <marker lat="38.963635" lng="-77.056191"/> <marker lat="38.961013" lng="-77.056201"/> <marker lat="38.958561" lng="-77.056118"/> <marker lat="38.956712" lng="-77.058066"/> <marker lat="38.957472" lng="-77.059006"/> <marker lat="38.958478" lng="-77.065124"/> <marker lat="38.958618" lng="-77.066037"/> <marker lat="38.957059" lng="-77.068015"/> <marker lat="38.954694" lng="-77.069226"/> <marker lat="38.954336" lng="-77.069425"/> <marker lat="38.954691" lng="-77.069630"/> <marker lat="38.959026" lng="-77.072154"/> <marker lat="38.961017" lng="-77.073309"/> </shape> ... <shape color="#0000FF" name="26" code="11001002600"> <marker lat="38.939670" lng="-77.051539"/> <marker lat="38.941542" lng="-77.051267"/> <marker lat="38.943733" lng="-77.049693"/> <marker lat="38.943759" lng="-77.049674"/> <marker lat="38.945553" lng="-77.047982"/> <marker lat="38.945719" lng="-77.045678"/> <marker lat="38.948218" lng="-77.044044"/> <marker lat="38.948201" lng="-77.046854"/> <marker lat="38.949650" lng="-77.047057"/> <marker lat="38.951239" lng="-77.044988"/> <marker lat="38.952888" lng="-77.044142"/> <marker lat="38.954585" lng="-77.042186"/> <marker lat="38.957867" lng="-77.042148"/> <marker lat="38.959586" lng="-77.040503"/> <marker lat="38.960394" lng="-77.042193"/> <marker lat="38.959721" lng="-77.038708"/> <marker lat="38.957243" lng="-77.039788"/> <marker lat="38.956212" lng="-77.036398"/> <marker lat="38.952535" lng="-77.036415"/> <marker lat="38.948260" lng="-77.036424"/> <marker lat="38.941874" lng="-77.036441"/> <marker lat="38.938231" lng="-77.036445"/> <marker lat="38.937852" lng="-77.037430"/> <marker lat="38.937211" lng="-77.038621"/> <marker lat="38.936285" lng="-77.040928"/> <marker lat="38.935053" lng="-77.047713"/> <marker lat="38.934157" lng="-77.048240"/> <marker lat="38.933065" lng="-77.050198"/> <marker lat="38.933224" lng="-77.050503"/> <marker lat="38.933827" lng="-77.049314"/> <marker lat="38.934804" lng="-77.048297"/> <marker lat="38.936966" lng="-77.047878"/> <marker lat="38.937713" lng="-77.051983"/> <marker lat="38.939670" lng="-77.051539"/> </shape> </shapes> Save XML File to XLS Click XML2XSL to save XML file is XLS format.  Click graphic for larger view Using Shp2XML -- an example of exporting roads/line segment geometry The following view shows Washington, DC by ZIP Code area (ZCTA) and all roads/edges shapefiles as layers. The view uses the shapefile ZCTA shapefile (cb_2013_11_tract_500k.shp) and the EDGES shapefile (tl_2010_11_zcta510.shp) both included with the installer. 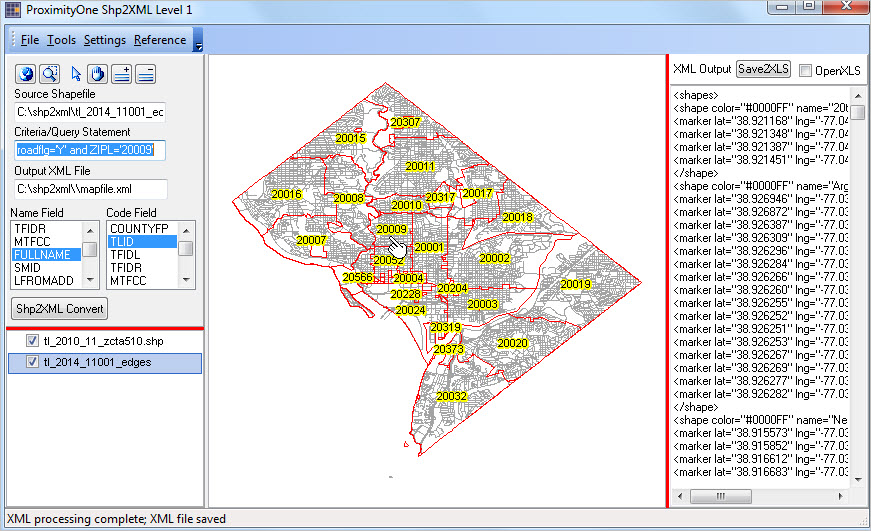 Click graphic for larger view This view was developed using these steps: • Use File>Open Shapefile to open the ZCTA shapefile. • Use Add Shapefile (+ button at top of left panel) to add the EDGES shapefile. • Modify attributes of the ZCTA layer to set as transparent/red boundary with ZIP Code as label. • Add the query "roadflg='Y' and ZIPL='20010'" (this results in only meeting roads this criteria to be exported. • Select a field to be used as NAME (NAME) and field to be used as CODE (TLID) using list boxes. • Click the Shp2Xml Convert button. TIGER/Line Shapefiles Use these options to download ProximityOne and Census-sourced shapefiles • CV XE GIS GeoGateway • Census Bureau TIGER/Line shapefiles via directory list ... more about these shapefiles: • About TIGER/Line • Edges/roads shapefiles • Census tract shapefiles • ZIP Code area shapefiles ProximityOne User Group Join the ProximityOne User Group to keep up-to-date with new developments relating to decision-making information resources. Receive updates and access to tools and resources available only to members. Use this form to join the User Group. There is no fee. Support & DMI Web Sessions Learn more about using resources described in this section. Join us in a Decision-Making Information Web session. There is no fee for these one-hour Web sessions. Each informal session is focused on a specific topic. The open structure also provides for Q&A and discussion of application issues of interest to participants. We can address your specific questions about tools to visually analyze patterns. Additional Information ProximityOne develops geographic-demographic-economic data and analytical tools and helps organizations knit together and use diverse data in a decision-making and analytical framework. We develop custom demographic/economic estimates and projections, develop geographic and geocoded address files, and assist with impact and geospatial analyses. Wide-ranging organizations use our tools (software, data, methodologies) to analyze their own data integrated with other data. Follow ProximityOne on Twitter at www.twitter.com/proximityone. Contact ProximityOne (888-364-7656) with questions about data covered in this section or to discuss custom estimates, projections or analyses for your areas of interest. |
|
|