
|
|
|
State Trends - S&O Desktop - S&O Profiles|Reports > Comparative > Narrative > Site Analysis CVXE GIS Tools Data Resources Guide - projections to 2060 Related Sections - Situation & Outlook - Applications Gallery - States - Congressional District - School Districts - Counties - Cities/Places - Tracts/Neighborhoods - Block Groups - Census Blocks - Urban Areas Estimates-Projections - 2060 Demographic ... all county interactive table - 2030 Demographic-Economic - Single Year of Age GIS Thematic Mapping Visual Analysis Tools Ranking Tables National Scope Demographic Change 2000-2010 - States - Metros - Congressional District - School Districts - Counties - Cities/Places - Census Tracts |
State Population Estimates & Components of Change
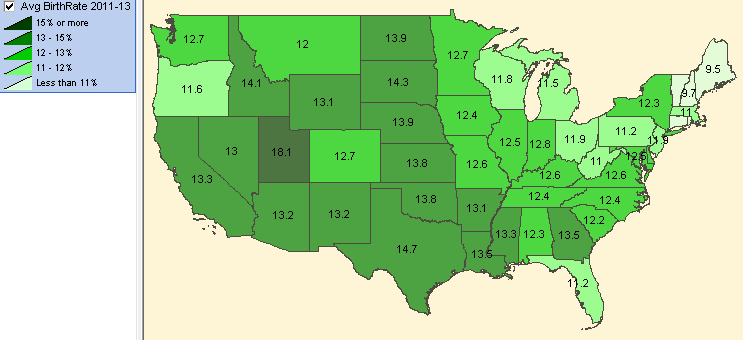
click graphic for info; hover to pause New January 2014. State population dynamics are changing. Find out more about how states are changing and why. Based on the new 2013 population estimates and components of change, the population percent natural increase ranged from -0.55% (West Virginia) to 12.5% (Utah) during the period 7/1/2012 to 6/30/2013. This is one example of insights into the components of population change that can be determined using the interactive table in this section. Use the table to view, compare, rank state population estimates and components of change. More about these estimates. Examining Components of Change Patterns The next several thematic map views show patterns of population components of change by state. Labels show the average for the years 2011-2013. Click graphic for a larger map view that also shows legend. These views were developed using the CV XE GIS software and related GIS project. More about using these resources. Scroll section ...
State Average Birth Rate; 2011-2013
State Average Death Rate; 2011-2013 
State Average Natural Increase Rate; 2011-2013 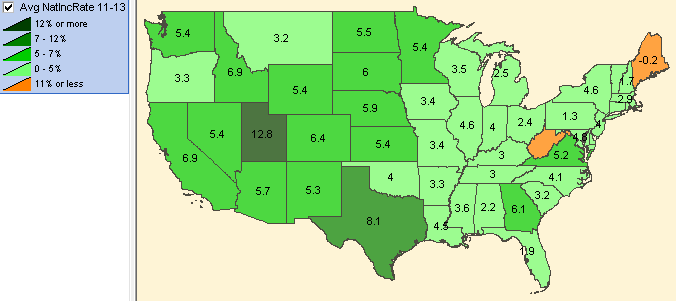
State Average International Migration Rate; 2011-2013 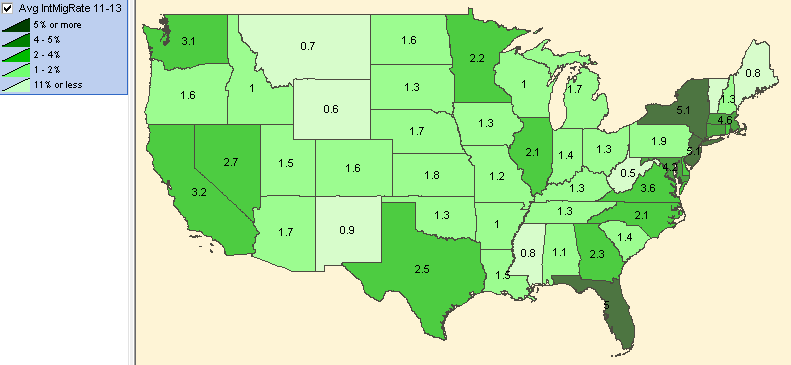
State Average Domestic Migration Rate; 2011-2013 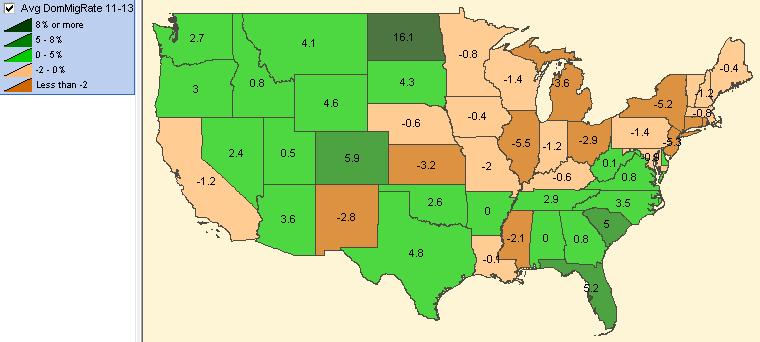
State Average Net Migration Rate; 2011-2013 
State Population Percent Change 2010-2013 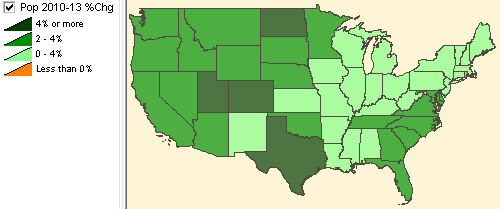
Visual Analysis using GIS Tools Use the CV XE GIS state population estimates GIS project to create thematic pattern maps such as shown in the above graphic. Develop thematic pattern maps using any of the items included in the interactive table below. Members of the ProximityOne User Group (join now, no fee) may download the ready-to-use GIS project. Use the interactive ranking table in this section to view, query, rank, compare annual population estimates and components of change. See description of items in scroll section below table. State/Region/U.S. Population & Components of Change; 2010-2013 -- Interactive Table Click column header to sort; click again to sort other direction. Model-based estimates. See usage notes below table. See related Ranking Tables Main Page Click row to copy to clipboard Usage Notes • Use buttons below table for column group selections. Population & Components of Change Items The scroll box shown below lists each of the subject matter items available for each area via the interactive table. The subject matter item name shown at the left and is also used as the short name for the subject matter item in the column header in the ranking table. The item name is also used as the field name in GIS applications.
About the Estimates Annual U.S. and state level population estimates and components of change are released in January of each year and provide estimates as of July 1 in the previous year. These estimates are subsequently used by the Census Bureau as "control totals" to develop national scope county level estimates for the same date later in the year. In January 2014, the state level estimates and components of change data were released for the most recent estimate of total resident population as of July 1, 2013, and so on in successive years. These model-based estimates are important because they reflect the Census Bureau's best estimate of the actual population in these areas. They are also important because the estimates become an annual time series that can be used in yet other modeling, estimation and projection applications. As of now, post Census 2010 estimates are available annually for 2010 through 2013. These data are also important because they are the "control total" estimates for county and other sub-state estimates developed by the Census Bureau that become the basis for Federal funding and other resource allocation formulas. The components of change data are equally important as they are mathematically connected to the derivation of the total population estimates. The population identity is used to the develop the total population estimates: P(2013) = P(2012) + B(2012) - D(2012) + IM(2012) +DM(2012) where P is total population and B(births), D(deaths), IM(net international migration) and DM(net domestic migration) are the components of change. Components of change provide insights into why one the population in one state grows at a different rate compared to other states. The model-based population estimates differ from the estimates developed from the American Community Survey ACS. Estimates from 2012 ACS reflect the population estimate based on survey respondents over the 2012 Calendar year. 2013 ACS 1-year estimates (tabulated for areas 65,000 population or more) will not be available until September 2014. Additional Information ProximityOne develops geodemographic-economic data and analytical tools and helps organizations knit together and use diverse data in a decision-making and analytical framework. We develop custom demographic/economic estimates and projections, develop geographic and geocoded address files, and assist with impact and geospatial analyses. Wide-ranging organizations use our tools (software, data, methodologies) to analyze their own data integrated with other data. Follow ProximityOne on Twitter at www.twitter.com/proximityone. Contact us (888-364-7656) with questions about data covered in this section or to discuss custom estimates, projections or analyses for your areas of interest. |
|
|