|
|
|
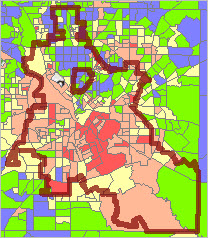
-- examining statistical area geographic change In the world of small area demographic-economic data analysis, census tracts are often a preferred level of geography. Subdivisions of counties (or county equivalent), census tracts cover the U.S. from wall-to-wall. Each county is comprised of one or more census tracts. Averaging 1,200 population, tract geography often corresponds to neighborhood areas. For Census 2010, there were 73,057 census tracts defined. Their reasonably static geography between each decennial census is an important feature for many applications. Annual census tract demographic-economic updates from the American Community Survey 5-year estimates (ACS1115), make census tracts even more appealing. But it has not always been that way. And, longitudinal comparison of demographic-economic change at the tract level can be challenging where tract geography and codes change with a new decennial census. 2010 marked the 100th anniversary of the census tract. Extensive use of the census tract started with the 1970 census and has evolved since then. This section illustrates how census tracts evolved between 1970 and 2010 using GIS resources. A GIS project was developed that includes census tract shapefiles for each census 1970 through 2010. Visualizing Demographic Patterns by Census Tract The following graphic shows patterns of economic prosperity by Census 2010 census tract in the Dallas, Texas metro area (Dallas metro component counties & demographic change). Census tract geography and demographic patterns are reviewed for part of Collin County. The following view shows median household income (MHI), based on ACS 2015 5-year estimates, by census tract. See MHI intervals/colors in legend at left of map. Boundaries/patterns are shown for Census 2010 tracts "0316.??" (black boundaries) in context of 1970 census tract "031600". Historical views of this area, illustrating how tract boundaries have changed over time, are shown later in this section.  Click graphic for larger view with tracts labeled with Census 2010 tract codes. View developed with CV XE GIS. Click to view tract area (red boundaries) in context of broader region 1970 Census Tracts A very small part of the U.S. was covered by 1970 census tracts. The following view shows 1970 census tracts with orange fill pattern. 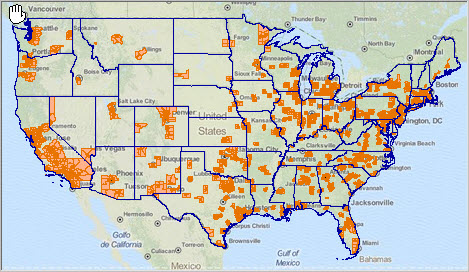 View developed with CV XE GIS. 1980 Census Tracts A larger part of the U.S. was covered by 1980 census tracts. The following view shows 1980 census tracts with orange fill pattern. 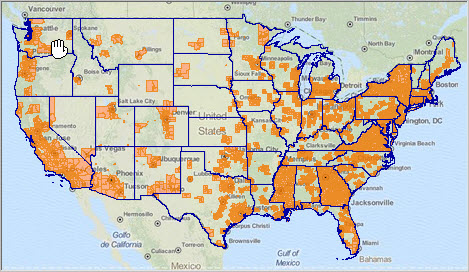 View developed with CV XE GIS. A Brief History Initial census tract data was with the 1910 census and included a handful of cities. Starting with the 1940 census, census tracts became an official statistical geography tabulation area. Starting with the 1970 census, and the first more extensive data in machine-readable form (magnetic tapes used with mainframe computers), census tracts became a more popular geography for the analysis of small area data. For both the 1970 and 1980 censuses, census tracts did not fully cover the U.S. For the 1990 census, census tracts and the quasi-equivalent "block numbering areas" (BNAs) covered the U.S. wall-to-wall. Starting with Census 2000, BNAs were retired and transformed into census tracts. Use of census tracts for demographic-economic analysis has continued gain in popularity. Now, census tract estimates are available annually from the American Community Survey 5-year estimates (ACS1115). Access ACS 5-year estimates via interactive tables. 1970 Census Tracts: Collin County; Dallas Metro 1970 census tract "031600" shown with bold black boundary. 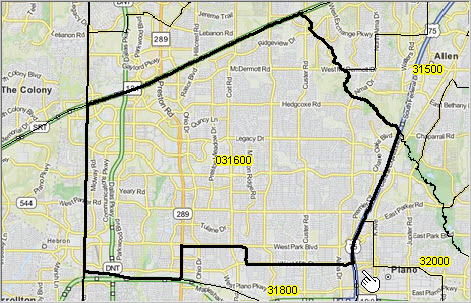 View developed with CV XE GIS. 1980 Census Tracts: Collin County; Dallas Metro 1980 census tracts 0316.?? (same general geography as covered by tract "031600" in 1970) shown with bold black boundary. This view shows tracts labeled with the 6-character census tract code, unique within county. 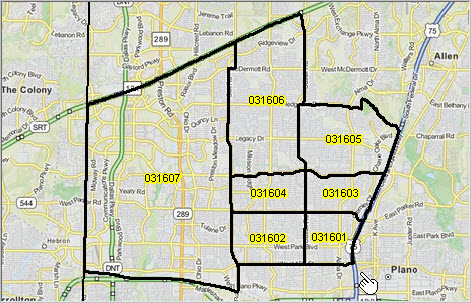 View developed with CV XE GIS. 1990 Census Tracts: Collin County; Dallas Metro 1990 census tracts 0316.?? (same general geography as covered by tract "031600" in 1970) shown with bold black boundary. This view shows tracts labeled with the census tract "base" plus "suffix" code separated by a decimal point. In 1980, note that there is no 1130.01 or 1130.02 as shown above for the 1970 vintage tracts . The codes 1130.03 and 113003 are equivalent. The 6-character, no decimal version, is preferred in all cases when used as a geocode. 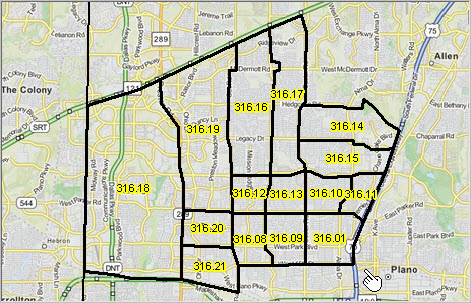 View developed with CV XE GIS. 2000 Census Tracts: Collin County; Dallas Metro 2000 census tracts 0316.?? (same general geography as covered by tract "031600" in 1970) shown with bold black boundary. 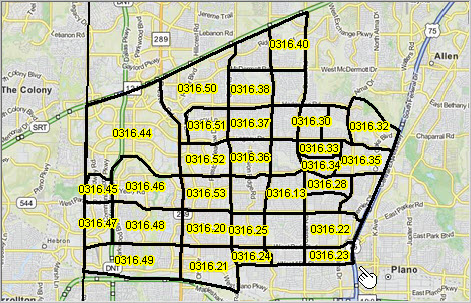 View developed with CV XE GIS. 2010 Census Tracts: Collin County; Dallas Metro 2010 census tracts 0316.?? (same general geography as covered by tract "031600" in 1970) shown with bold black boundary. 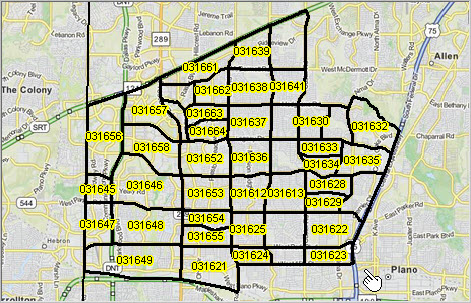 View developed with CV XE GIS. Equivalencing Census 2000 and Census 2010 Tract Geography As shown above, the area covered by Census 2000 tracts 1130.15 and 1130.18 become Census 2010 tract 1146.00. Comparing the above map views for Census 2000 and Census 2010 shows (upper left tracts) shows Census 2000 tract 031644 is split into Census 2010 tracts 031656, 031657 and 031658. To compare demographic change for Census 2000 tract 031644 requires combining data tabulated for Census 2010 tracts 031656, 031657, 031658 and other partial Census 2010 tracts intersecting with Census 2000 tract 031644. See more about these relationships at Census 2010 Demographics for Census 2000 Geography. Use the interactive table in that section to view the relationship among these tracts. The graphic shown below illustrates use of that table. A query has been placed on Census 2000 tract 031644 (see button below table and query value 48085031644). The table below shows rows only for Census 2000 031644. See the corresponding Census 2010 tracts in columns to right. The following graphic shows the relationship between these tracts. 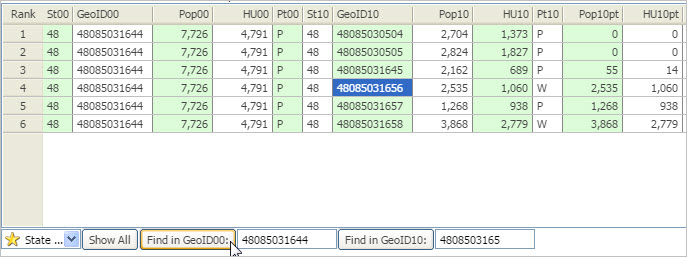 To replicate this view in the interactive table, follow these steps: • Click ShowAll button below table. • Key in the tract code Census 2000 tract 48085031644 to right of Find in GeoID00 button. • Click Find in GeoID00 button. • The view above appears in the table. Support Using these Resources [goto top] Learn more about demographic economic data and related analytical tools. Join us in a Data Analytics Lab session. Each informal session is focused on a specific topic. The open structure also provides for Q&A and discussion of application issues of interest to participants. ProximityOne User Group [goto top] Join the ProximityOne User Group to keep up-to-date with new developments relating to geographic-demographic-economic decision-making information resources. Receive updates and access to tools and resources available only to members. Use this form to join the User Group. Additional Information ProximityOne develops geographic-demographic-economic data and analytical tools and helps organizations knit together and use diverse data in a decision-making and analytical framework. We develop custom demographic/economic estimates and projections, develop geographic and geocoded address files, and assist with impact and geospatial analyses. Wide-ranging organizations use our tools (software, data, methodologies) to analyze their own data integrated with other data. Follow ProximityOne on Twitter at www.twitter.com/proximityone. Contact ProximityOne (888-364-7656) with questions about data covered in this section or to discuss custom estimates, projections or analyses for your areas of interest. |
|
|