
|
|
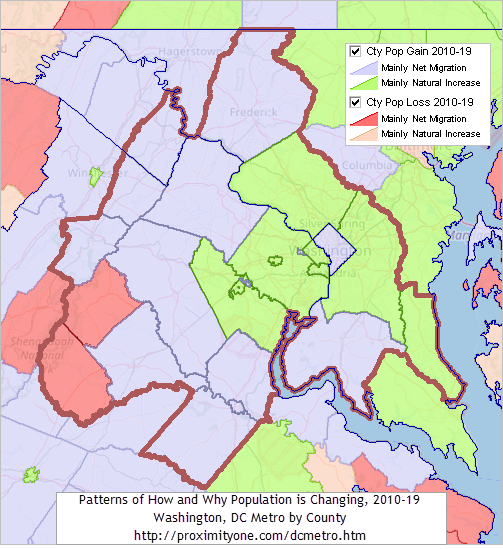
-- examining geographic, demographic, economic characteristics & change March 2021 .. the Washington Metropolitan Area (WMA) population changed from 5,678,491 (7/1/2010) to 6,280,487 (7/1/2019), a change of 601,996 (10.6 percent). The DC Metro ranked 6th among all metros based on total 2019 population and 87th based on percent population change 2010-2019 among all 384 Metropolitan Statistical Areas (MSAs). See related interactive table to compare/contrast population and components of change for the WMA and all other MSAs. inter This section reviews the WMA geographic, demographic, economic characteristics and change. It updates frequently as new/updated data become available. Subscribe to receive updates, data, tools that you can use with your own data. Topics • 01 Situation & Outlook Overview • 02 Lay of the Land - How & Why Counties are Changing • 03 WMA Economy • 03 Employment Situation • 03 Housing • 03 Personal Income • 03 GDP by Sector • 03 Establishments by Type of Business • 04 Examining County Components -- Interactive Table • 05 WMA Compared to U.S. -- Demographic-Economic Insights Reports • 09 Fortune 1000 Companies • 10 Gallery - illustrative WMA Applications WMA Economic Recovery ProximityOne develops and uses models to prepare demographic-economic estimates and projections at the national, state, metro, county, city/place and tract geographic levels fro the U.S. Estimates and projections are developed for quarterly and annual time series. Demographics2060 provides access to U.S. by county projections to 2060. Estimates and projections are being updated quarterly to assess the how, when, where of the the economic recovery. These data are available to sponsors/subscribers. How & Why Washington Metropolitan Area County Demographics are Changing .. goto top The Washington Metropolitan Area, as defined by OMB and technically named Washington-Arlington-Alexandria, DC-VA-MD-WV MSA, is comprised of the counties and county-equivalent areas as shown in the map graphic below. The graphic shows how counties have gained population (blue and green) and lost population (orange and red) during the period 2010 to 2019. Click graphic for larger view; expand browser window for best quality view.  .. click graphic for larger view .. view developed with ProximityOne CV XE GIS and related GIS project. WMA Economy Overview .. goto top Per Capita Personal Income. In 2019, the WMA had a per capita personal income (PCPI) of $74,385. This PCPI ranked 13th in the U.S. and was 132 percent of the national average, $56,490. The 2019 PCPI reflected an increase of 2.8 percent from 2018. The 2018-2019 national change was 3.5 percent. In 2009, the PCPI of the WMA was $56,500 and ranked 5th in the U.S. The 2009-2019 compound annual growth rate of PCPI was 2.8 percent. The compound annual growth rate for the nation was 3.7 percent. Total Personal Income, In 2019, the WMA had a personal income of $467,176,430*. This personal income ranked 5th in the U.S. In 2009, the personal income of WMA was $314,209,360* and ranked 4th in the U.S. Total GDP. In 2019, the WMA produced $559,061,958 in current-dollar total GDP*. This GDP ranked 5th among MSAs and accounted for 2.9 percent of the U.S. metropolitan portion total. In 2009, the total GDP of WMA was $400,016,027 and ranked 4th among MSAs. In 2019, the WMA real GDP grew 1.6 percent; the 2018-2019 U.S. metropolitan portion change was 2.1 percent. The 2009-2019 compound annual growth rate for WMA real GDP was 1.7 percent; the compound annual growth rate for the U.S. metropolitan portion was 2.3 percent. WMA County Population & Components of Change 2010-2019 interactive table Click column header to sort; again to sort other direction. Click ShowAll button between queries to refresh. Usage notes below table. See related Interactive Tables Main Page Usage Notes Click buttons below table: - Population Trends - Birth Trends - Death Trends - Migration: International, Domestic, Net Trends - Group Quarters Trends - Housing Trends - Median Housing Income Trends Comparing WMA to the United States -- Demographic-Economic Insights .. goto top Use the Insights feature of the ProximityOne CV XE GIS software to develop Insights reports similar to those shown below. Install CV XE GIS to create your own reports with updated data and for geography of interest. Comparing the Washington Metropolitan Area to other metros, states or the U.S. - these reports provide insights into how the WMA compares to the U.S. • WMA to U.S. 2019 5 year • WMA to U.S. 2019 1 year Compare any of the WMA component counties with one-another or to the WMA overall. - these reports compare Alexandria with WMA overall. • Alexandria to WMA 2019 5 year .. note in above, compare percent of 1-unit detached housing units in Alexandria is 13.7% & WMA overall at 46.3% .. compare median housing value in Alexandria is $572,900 & WMA overall at 424,000. • Alexandria to WMA. 2019 1 year Fortune 1000 Companies .. goto top
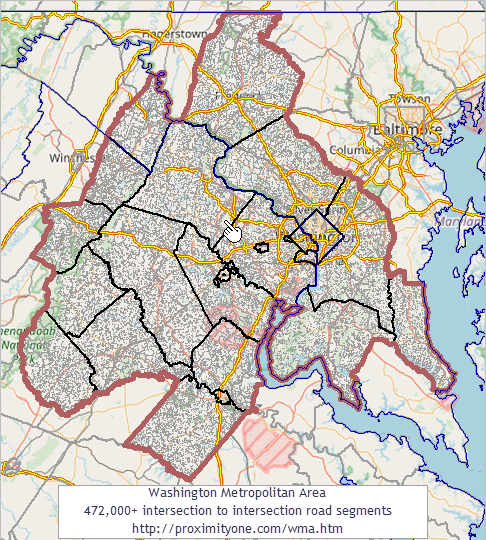
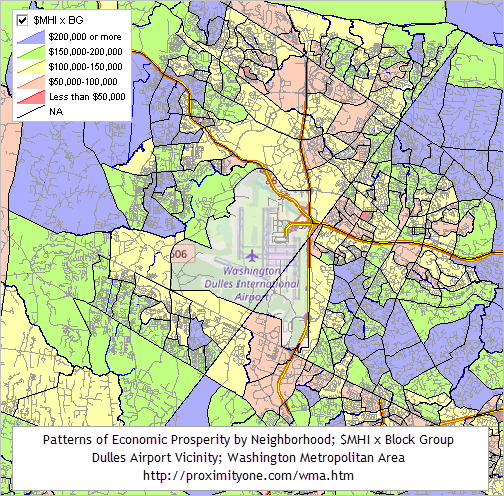
Illustrative WMA Applications .. goto top Use the WMA GIS project on your computer to develop applications/views as illustrated below. WMA Intersection to Insersection Road Segments .. goto top Based on the Census 2020 TIGER 2020 vintage digital map database; forming boundaries for the Census 2020 census blocks and other geography. Use this shapefile in GIS applications for routing and navigation applications. On your computer, add markers and overlays/layers having unique meaning for your operations. Click graphic for larger view; expand browser window for best quality view.  .. view developed with ProximityOne CV XE GIS and related GIS project. Patterns of Economic Prosperity by Block Group; Zoom-in to Dulles Airport Vicinity .. goto top Based on median household income by block group, the following graphic shows the above roads/streets as an overlay showing patterns of economic prosperity. Use this shapefile in GIS applications to examine market or service areas selecting subject matter assocatied with your business, organization or campaign On your computer, add markers and overlays/layers having unique meaning for your operations. Click graphic for larger view; expand browser window for best quality view.  .. view developed with ProximityOne CV XE GIS and related GIS project. Center for Regional Analysis .. goto top The ProximityOne Center for Regional Analysis (CRA) develops and applies demographic economic data and related analytical tools to assess the situation, trends and outlook for regional areas. ProximityOne User Group Join the ProximityOne User Group to keep up-to-date with new developments relating to geographic-demographic-economic decision-making information resources. Receive updates and access to tools and resources available only to members. Use this form to join the User Group. Additional Information ProximityOne develops geographic-demographic-economic data and analytical tools and helps organizations knit together and use diverse data in a decision-making and analytical framework. We develop custom demographic/economic estimates and projections, develop geographic and geocoded address files, and assist with impact and geospatial analyses. Wide-ranging organizations use our software, data and methodologies to analyze their own data integrated with other data. Follow ProximityOne on Twitter at www.twitter.com/proximityone. Contact ProximityOne (888-364-7656) with questions about data covered in this section or to discuss custom estimates, projections or analyses for your areas of interest. |
|
|