
|
|
|
-- examine demographic-economic characteristics; comparing areas May 2022 .. use the Demographic-Economic Insights (Insights) tool to create side-by-side comparative analysis demographic-economic profiles. Choose from thousands of geographic areas. Selectively choose geographic areas using pick-from-list or geographies stored in a file. Demographic-Economic Insights is a feature of the ProximityOne CV XE GIS and Demographic-Economic Data Explorer (DEDE). The Insights tool (Version 22.1) has been added as a feature of the Demographic-Economic Data Explorer (DEDE) effective May 2022. Several enhancements have also been introduced. .. summary level added: 250: American Indian Reservations, Alaska Native Areas, Hawaiian Homelands .. choose to use data from ACS 2019 or ACS 2020. Brief overview of using DEDE Tools>Insights ... .. install and start DEDE version 05.04.22 or more recent version. .. with DEDE running, select Tools>Insights from main menu; wait for the Insights form/user interface to open. .. create this DEDE Insights view to create a comparative analysis profile: 1. edit the GeoFilter edit box and add new/replacement text "sumlev='250' .or. sumlev='050'" .. after making the edit, dbl-click the edit box. .. the listbox of geographies updates (lower left) showing only areas for these two summary levels. 2. click the Open button by GeoFilter edit box. .. in the dialog box, select file "dei_rinconres_sdcty.txt" .. this file contains codes to develop a comparative analysis profile: -- Rincon Reservation compared to San Diego County 3. to generate the profile, click "Run from File" button. .. if the profile does not generate correctly in the grid, click the Run from File button again. .. the grid populates with the profile .. wait for "done" message to appear in statusbar. 4. optionally save grid content to XLS or HTML format. .. click Open checkbox by Save as HTML .. click Save as HTML button .. new HTML file opens. User Interface with above settings: ..  Illustrative HTML files (one for each 2019 and 2020 ACS data) .. 2019 Profile Saved as HTML .. 2020 Profile Saved as HTML Using Insights with CV XE GIS ... With CV running, start Insights by clicking Analytics>Insights from the main menu tool bar. The initial display/report may take 15 seconds depending your computer and connectivity details. This operation requires Internet and makes use of certain server-based data. Insights Version 22 can be used with any version of CV XE GIS. CV XE GIS Level 1 or higher is required to use all features. Topics • 01 Start-up View • 02 What What You Can Do Using These Resources • 03 Getting Started - Operations • 04 Subject Matter Updates • 05 U.S. Demographic-Economic Insights Start-Up View The start-up is shown in the graphic below and features a demographic-economic side-by-side comparison of Los Angeles County, CA and Orange County, CA. Once the profile is shown in the grid, optionally click the SaveHTM button, saving the grid display as an HTML file ready to publish, share with others. Click this link to view the report/profile.  .. click graphic for larger view The default display uses the ACS 2019 5-year estimates, available for all geographic areas. Since the start-up selects two counties each over 65,000 population, the ACS 2019 1-year can be used (providing more recent data). Selecting the ACS 1-year radiobutton (upper left control panel) and clicking the Run from File button (top left) the grid is repopulated with ACS 2019 1-year data. Click this link to view the report/profile using ACS 2019 1-year data. What You Can Do Using These Resources .. goto top See more about creating insights below. Create profiles similar to the one shown above for these geographies listed below. .. using base data from the 2019 American Community Survey (most current data available) .. 1-year or 5-year programs Examples .. to view Insights report, click 5-year or 1-year link to right of geoagraphic area type. .. compare any one of these geographies with any one from another type of geography • United States .. compare U.S. & Texas .. 5-year .. 1 year .. text file • States .. compare states .. California & New York .. 5-year .. 1 year .. text file • Census tracts .. compare a census tract to a county .. Honolulu .. 5-year .. 1 year not available .. text file .. use your browser with the Visual Data Analytics Mapserver to view this tract (or any geographic area) .. tract 15-003-000600 shown with cross-hatch and located in the Diamond Head area of Honolulu  • Census tracts .. compare a census tract to a county .. Fairfax, VA .. 5-year .. 1 year not available .. text file • Census tracts .. compare two tracts .. in Maui County & Honolulu County .. 5-year .. 1 year not available .. text file • Cities/Places .. compare city (Austin, TX) to county (Travis, TX) .. 5-year .. 1 year .. text file • Counties .. compare county (Travis, TX) to state (Texas) .. 5-year .. 1 year .. text file • Counties .. compare county (Fairfax, VA) to state (Virginia) .. 5-year .. 1 year .. text file • ZIP Codes .. compare ZIP code to an intersecting census tract (Scottsdale, AZ) .. 5-year .. text file click graphic for larger view .. 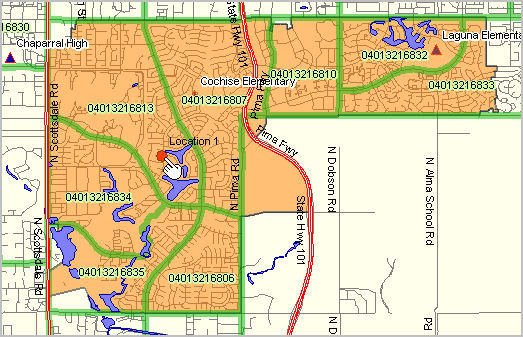 • ZIP Codes .. compare ZIP code to an intersecting census tract (Huntington Beach, CA) .. 5-year .. text file insights in context of a Congressional Community .. CC 0648013 shown with orange boundary first, the tract code is determined using the CV XE GIS LBD feature for an address:  then the Insights text file is set up using the ZIP code & tract code used in the Insights file then run, CV XE GIS map showing geo-relationships .. CC-ZIP-Tract .. click graphic for larger view ..  • Metropolitan Areas.. compare two metros .. Los Angeles & Chicago .. 5-year .. 1 year .. text file • School Districts .. compare school district to state .. Wichita USD & Kansas .. 5-year .. 1 year .. text file • Congressional Districts .. compare city (Irvine, CA) to Congressional District (CA 48) .. 5-year .. 1 year .. text file Notes: .. 5-year means based on 5-year estimates; these estimates are centric to 2017 .. 1-year means based on 1-year estimates; these estimates are for 2019 .. "1-year not available" means one or both areas is under 65,000 population Standardized Subject Matter The profiles include data from subject matter sets: • General demographics "D items" as shown in profile • Social characteristics "S items" as shown in profile • Economic characteristics "E items" as shown in profile • Housing characteristics "H items as shown in profile All estimates for 2019 in this version; 5-year data centric to 2017; 1-year data for calender 2019. Select 1-year or 5-year data as appropriate (same scope of sucbject matter) • Tracts and ZIP code areas have only 5-year data tabulated. • Other areas under 65,000 population have only 5-year data tabulated. • 1-year data available for areas other than tracts/ZIPs that have populaiton 65,000 or more. • 1-year estimates preferred when available, data are more recent that the 5-year estimates. • When using tracts, ZIPs and areas under 65,000, it might be preferred to use 5-year estimates for even states and the U.S. Getting Started .. goto top Insights Version 21.1 can be used with any version of CV XE GIS. • CV XE GIS Level 1 or higher is required to use all features. • Install the CV XE GIS (CV) software on a Windows computer using this installer. .. if already installed, re-install if your version is dated after 3/1/21. • With CV running, select Analytics>Insights from the main menu, wait for Insights form to appear. Operations .. goto top With CV XE GIS running, start Insights from the main menu Analytics>Insights. The Insights form appears: The listbox shown at lower left includes geographic area codes and names for available geographies. The first three characters are the Summary Level (sumlev). The summary level codes (3 characters and must use lead 0s) and associated geographic area type name are as follows: 010 United States 040 State 050 County 140 Census Tract 160 City/Place (1,000 population or more) 300 Metropolitan Statistical Area (MSA) 860 ZIP Code Area 970 School District - Unified The start-up shows only California counties (based on the GeoFilter preset with the value The GeoFilter may be modified with CV XE GIS Levels 1 and higher. To display a profile for any area, dbl-click the area/item in the listbox at lower left. .. the start-up defaults to use of the ACS2019 5-year data. for eligible areas (65,000 population or over) optionally use radiobutton to select 1-year .. the profile displays in the grid. .. optionally save the grid content as an XLS or HTML file. .. wait for the profile to completely display before clicking SaveHTM or SaveXLS. .. "done" appears in the statusbar when complete. Using GeoFilter • GeoFilter is an edit box located above the grid. • GeoFilter is used to set a filter on the scope of geography displayed in the geography listbox. • The start-up GeoFilter text shows .. using this filter will show all geolistings that are in California (CA) and are counties (050) • Logical operators (e.g. and) must use a period (.) immediately preceeding and following the term "and". .. for example: .and. or .or. .. see more about expressions & syntax • By dbl-clicking the GeoFilter edit box, that filter is applied to the GeoList listbox. • The Reset button reloads the default setting. • Dbl-clicking an empty GeoFilter edit box will show all geographies available . Using Run from File To display a comparison profile of two areas, use the Run from File button. .. the Run from File operation uses the "GeoFile" .. a text file whose path/name shown in edit box below the button .. clicking the Run button with start-up default generates the Los Angeles-Orange County report. .. at completion of display of comparison areas in the grid, the "done" message appears in the status bar. .. wait for the "done" update before saving the grid display as XLS or HTML. The GeoFile is a two line text file. For convenience, these should be located in the default data folder c:\cvxe\1. .. there is a line for each area .. two lines/rows in this version. .. the summary level (see above) is the first three characters. .. the summary level is followed by the geocode, exact widthn number of characters as shown in listbox. .. lead zeroes must be retained in the summary level and the geocode. .. line one for the U.S. would be "01000000" (omit quote characters). .. text may optionally follow the geocode (suggested). .. use notepad to make the file; an editor will be added to this version .. see examples in the above illustrative profile (click link "text" to view the file. .. geographies specified in the GeoFile must appear in the geo listbox. - to select from any available geographies, empty the GeoFilter edit box and dbl-click the edit box. - the geo listbox will then repopulate, this may take 30 seconds. Creating Insights .. goto top Most basically, these data/tools enable you to understand the "lay of the land" in demographic-economic terms. These data do this is a way that is unique among all other data resources. The nature of the standardized subject matter makes it possible to compare many types of geo Not a panacea, these data have at least these limitations: • the data are estimates and subject to errors of estimation • the data lag and are based on a recent, but past, statistical survey .. they cannot directly tell us about today or the future • there are more detailed data available using the API or detailed subject matter table. Subject Matter Updates .. goto top Insights subject matter updates, for CV Level 1 and higher users .. - starting March 2021 the scope of the profile will be extended for counties. .. quarterly updates. .. includes BLS QCEW quarterly business establishment data (updated quarterly) by type of business .. the March 9 release data will provide data for 2020Q3 .. see calendar http://proximityone.com/whatsnew.htm .. the June 29 release data will provide data for 2020Q4 and so on Insights, for CV Level 1 and higher users .. looking ahead .. we plan these additions: - Census sourced building permits; number of units and valuation by type of unit (places & counties) .. data for 2020; release date ~5/3/21; added to Insights ~5/15/21 - Census sourced population and components of change (counties) .. estimates for 7/1/20; release date ~5/4/21; added to Insights ~5/15/21 - Census sourced housing units estimates (counties) .. estimates for 7/1/20, release date ~5/27/21; added to Insights ~6/15/21 - Census 2020 data as released .. the first of these data additions is expected by 10/15/21 (all Insights geo levels) ProximityOne Situation & Outlook S&O demographic-economic estimates & projections - selected projections to 2060 - extensive additional items available to S&O subscribers (an optional add-on) State of the Nation .. goto top Use these to obtain insights into the "State of the Nation". The U.S. demographic economic insights report tells us that in 2019 (based on 2019 1-year estimates), the total resident population was estimated to be 328,239,523. The median age was 38.5 years. The percent high school graduates was 88.6%. The number of housing units was 139,686,209. The percent owner occupied housing units was 64.1%. These measures are roughly the same today, at the end of 2020, even with the pandemic impact. Some other measures in the report as not as reflective "as of today". While data shown here do not fully summarize the state of the Nation, there provide many insights. The same can said for any of the geographic areas covered. To obtain a better picture of the state of the Nation, we need supplementary subject matter, more up-to-date data and trending data that give clues into what's happening. Support Using these Resources .. goto top Learn more about demographic economic data and related analytical tools. Join us in a Data Analytics Lab session. There is no fee for these Web sessions. Each informal session is focused on a specific topic. The open structure also provides for Q&A and discussion of application issues of interest to participants. ProximityOne User Group Join the ProximityOne User Group to keep up-to-date with new developments relating to geographic-demographic-economic decision-making information resources. Receive updates and access to tools and resources available only to members. Use this form to join the User Group. Additional Information ProximityOne develops geographic-demographic-economic data and analytical tools and helps organizations knit together and use diverse data in a decision-making and analytical framework. We develop custom demographic/economic estimates and projections, develop geographic and geocoded address files, and assist with impact and geospatial analyses. Wide-ranging organizations use our software, data and methodologies to analyze their own data integrated with other data. Follow ProximityOne on Twitter at www.twitter.com/proximityone. Contact ProximityOne (888-364-7656) with questions about data covered in this section or to discuss custom estimates, projections or analyses for your areas of interest. |
|
|