
|
|
|
-- the 2020 U.S. Population is more racially and ethnically diverse than 2010 -- examine demographic diversity thousands of geographic areas -- interactive table showing diversity and race/ethnic composition for all congressional districts & congressional communities October 2023 .. based on the 2020 Census the Diversity Index for the 118th Congressional Districts ranged from 12.5% (Kentucky 05) to 78.5% (Hawaii 02). Use the interactive table below to view, rank, compare, each/all the Diversity Index by 118th Congressional District and Congressional Community. View the diversity characteristics and race/ethnic composition for your congressional district .. click here. The Diversity Index tells us how likely two people chosen at random will be from different race and ethnicity groups. For example, in 2010, there was a 54.9% chance that two people chosen at random would be from different racial and ethnic groups, while in 2020 there was a 61.1% chance. People may have different perceptions of what it means for a population to be diverse. Here, the concept of racial and ethnic diversity refers to representation and the relative size of different racial and ethnic groups within a population. Diversity is maximized (a value of 100.0) when all groups are represented in an area and have equal shares of the population. Among states, the 2020 diversity index ranged from 18.5% (Maine) to 76% (Hawaii). Patterns of Diversity by 118th Congressional District .. develop variations of this view using VDA GIS .. developed using Census 2020 DHC data released August 2023 .. top interval, blue, is 61.1% diversity index and above .. the 2020 U.S. diversity index value .. see more about 118th Congressional Districts .. click graphic for larger view; showing CD code and diversity index. 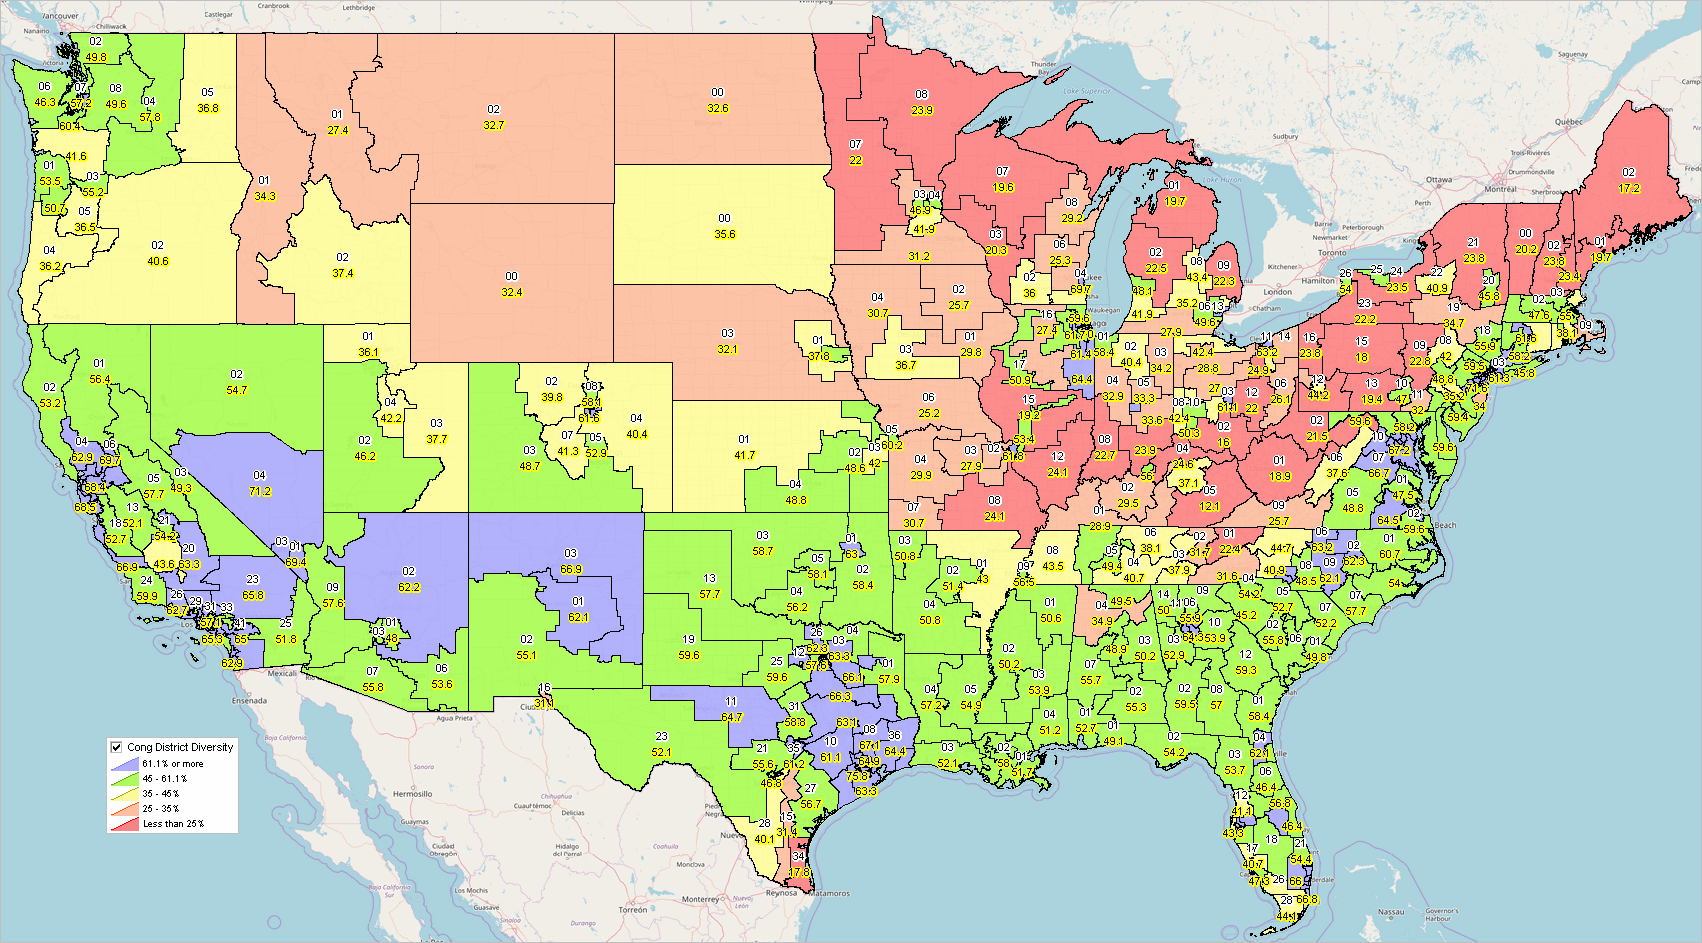 Demographic Analytics .. goto top The Demographic Analytics (DA) tool is used to create the diversity index and related demographic attributes for wide-ranging geography. See details about how the diversity index is computed below. DA has been used to compute the Diversity Index (DI) dataset used to develop the interactive table below. View the DI in the DA narrative comparative analysis profile. For example, the diversity index in 2020 was 64.8% for Phoenix, AZ compared to 61.5% for Maricopa County, AZ. View the complete narrative comparative analysis profile for these areas. Congressional Communities & Diversity .. goto top The diversity of a congressional district typically varies widely throughout the district. Diversity by congressional community, subdivisions of congressional districts, can better document/describe the diversity throughout a congressional district. Congressional Communities (CCs) are mutually exclusive geographic areas, generally sets of contiguous census blocks, that nest within a congressional district (CD) and fully, exactly exhaust all of the congressional district area. For example, use the table below to determine that there are 17 CCs comprising California CD 47 .. that have a diversity index ranging from 35.6 to 72.1. Congressional District & Congressional Community Diversity -- 2020 .. goto top .. 436 118th Congressional Districts & 7,377 Congressional Communities .. view your CD/CCs .. key in your state+cd code below table, click Find CD; table refreshes. then click Diversity header column to rank ascend/descend. .. more usage notes below table. Click here to map your area .. opens new page/tab .. more about this feature .. when map interface opens, enter an address or zip code (example 22202) in search bar, then press enter, the map view zooms to your location. .. click the marker to view the associated census tract; it shows as cross-hatched. .. select Congressional Districts (CDs) in top left dropdown to view a CD. then click the marker (press enter again in search bar if needed to re-display marker). zoom out to view whole cross-hatched area. .. in legend at left click on the two Congressional Community (CCs) checkboxes the CC boundary and code now appear in context of CDs. More about Mapping Congressional Communities (CCs) Suppose you want to view all CCs contained within CD CA 47. • Start Open VDA Web GIS • Set active layer to Cong Comm (upper left dropdown) • Click the circleA rightmost button below map to start Table/Grid • Above grid .. enter SQL Filter stcd='0647' (exactly this text stcd='0647') and click Query • Grid refreshes with 17 CCs in CA 47 • Click "Highlight all that meet query" button below map .. map zooms to these 17 CCs • Optionally navigate for perfect view. Interactive Table Usage Notes .. Click ShowAll button between queries. .. The above table is an interactive table. Use the buttons below the table to manage interactive operations. Within the table itself, navigate up and down with vertical and horizontal scroll bars. Use mouseover for expanded description of the subject matter header cells Click a header cell to sort one direction, click again to sort the other direction. The CD/CC code, left column, contains a 7 character code for the congressional district/congressional community. The leftmost 4 characters are the congressional district (CD) code. The CD code is the state FIPS code plus the CD code in that state. The rightmost 3 characters are the congressional community code (a unique sequence code in the corresponding CD). The CD/CC code is always seven characters, all numbers and contains no blanks. SumLev dropdown. Click to select only 500 Congressional Districts or 501 Congressional Communities. How to save your CC or CD data .. .. Copy row to clipboard. Click a row in the table and it turns blue. Right-click to copy that row to clipboard. .. With a spreadsheet application open, click ctrl-V to paste those cells into the spreadsheet for further data use. Find CD button. Key in CD code (4 characters, all numeric) then click Find CD. .. e.g., 5108 for Virginia CD 08 .. see state codes in upper right state scroll list. .. the table refreshes with CD row and all component CC rows. Up to 5 CDs operation. Click this button to select only the CD codes in edit boxes. Always 4 characters. Up to 5 CCs operation. Click this button to select only the CC codes in edit boxes. Always 7 characters. Items in Table - CD/CC Code - St -- State USPS abbreviation - SumLev -- summary level - Diversity - Total Population - Hispanic - Pct Hispanic - NonHisp White alone - %NonHisp White alone - NonHisp Black alone - %NonHisp Black alone - NonHisp AIAN alone - %NonHisp AIAN alone - NonHisp Asian alone - %NonHisp Asian alone - NonHisp NHOPI alone - %NonHisp NHOPI alone - NonHisp Other alone - %NonHisp Other alone - NonHisp Two+ Races - %NonHisp Two+ Races How Diversity is Computed -- goto top Diversity Index Equation DI=1- (H² + W² + B² + AIAN² + Asian² + NHPI² + SOR² + Multi² ) H is the proportion of the population who are Hispanic or Latino. W is the proportion of the population who are White alone, not Hispanic or Latino B is the proportion of the population who are Black or African American alone, not Hispanic or Latino AIAN is the proportion of the population who are American Indian and Alaska Native alone, not Hispanic or Latino Asian is the proportion of the population who are Asian alone, not Hispanic or Latino NHPI is the proportion of the population who are Native Hawaiian & Other Pacific Islander alone, not Hispanic or Latino SOR is the proportion of the population who are Some Other Race alone, not Hispanic or Latino MULTI is the proportion of the population who are Two or More Races, not Hispanic or Latino ProximityOne User Group -- goto top Join the ProximityOne User Group to keep up-to-date with new developments relating to metros and component geography decision-making information resources. Receive updates and access to tools and resources available only to members. Use this form to join the User Group. Data Analytics Web Sessions Learn more about accessing and using demographic-economic data and related analytical tools. Join us in a Data Analytics Lab session. There is no fee for these one-hour Web sessions. Each informal session is focused on a specific topic. The open structure also provides for Q&A and discussion of application issues of interest to participants. Additional Information ProximityOne develops geodemographic-economic data and analytical tools and helps organizations knit together and use diverse data in a decision-making and analytical framework. We develop custom demographic/economic estimates and projections, develop geographic and geocoded address files, and assist with impact and geospatial analyses. Wide-ranging organizations use our tools (software, data, methodologies) to analyze their own data integrated with other data. Follow ProximityOne on Twitter at www.twitter.com/proximityone. Contact us (888-364-7656) with questions about data covered in this section or to discuss custom estimates, projections or analyses for your areas of interest. |
|
|