|
|
|
School Attendance Zones Main Situation & Outlook - S&O Desktop - S&O Profiles|Reports > Comparative > Narrative > Site Analysis Data Resources Guide - projections to 2060 Related Sections - Applications Gallery - States - Congressional District - School Districts - Counties - Cities/Places - Tracts/Neighborhoods - Block Groups - Census Blocks - ZIP Codes - Urban Areas Estimates-Projections - 2060 Demographic ... all county interactive table - 2030 Demographic-Economic - Single Year of Age Ranking Tables National Scope Demographic Change 2000-2010 - States - Metros - Congressional District - School Districts - Counties - Cities/Places - Census Tracts |
School Attendance Zone Demographics -- Northshore School District, Washington
This section provides a visual analysis of demographic-economic patterns of Northshore School District, WA school attendance zones (SAZ). The maps were developed using the CV XE GIS and associated SAZ geodemographic database. Develop wide-ranging variations of these maps and tabular data on your own computer; integrate your own data; add other types of geography; zoom-in to specific schools and streets. Contact us for more information (mention school attendance zones). Use the interactive table at http://proximityone.com/saz.htm to view, compare, rank SAZs based on demographic attributes provided for each SAZ. Unlike enrollment and administratively reported data for schools, these demographic-economic data are for the SAZ total population including age, gender, race/origin, educational attainment, employment by industry/occupation, income/poverty, language spoken, housing age, housing structure, housing value, housing value , among many other attributes. See more about these data (below, in this section). Northshore School District WA -- Northshore School District bold brown boundary; pointer shows county boundary -- cities bold black boundary and cross-hatched fill pattern 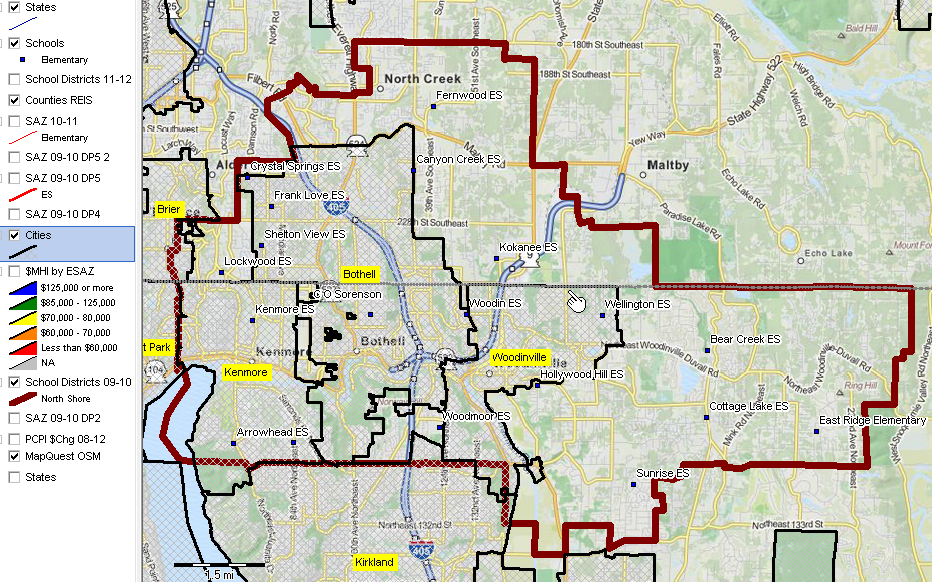 Northshore School District WA Elementary School Attendance Zones -- patterns of median household income; see $MHI intervals by color in legend left of map -- elementary schools shown as blue markers with white school name labels 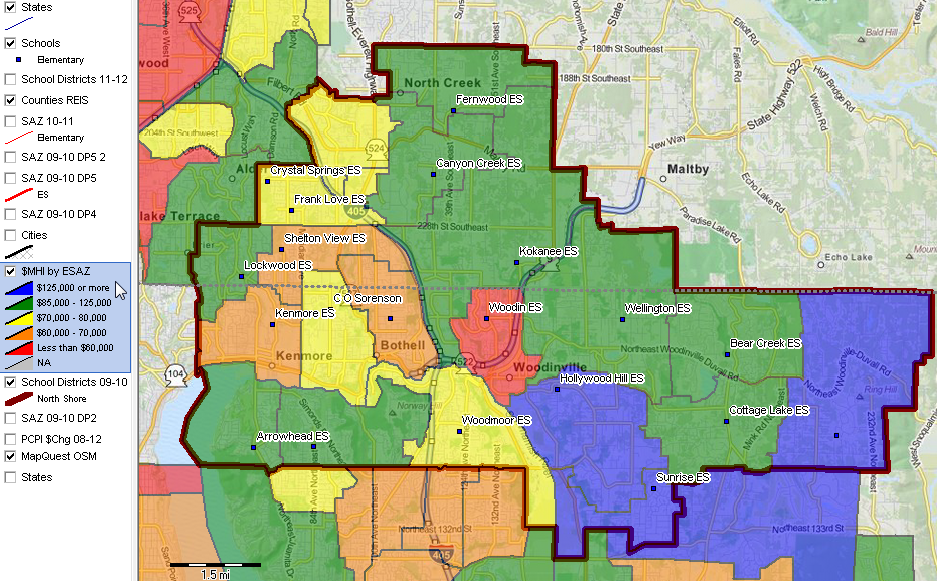 Northshore School District WA Elementary School Attendance Zones -- composite view showing combined features in two above views 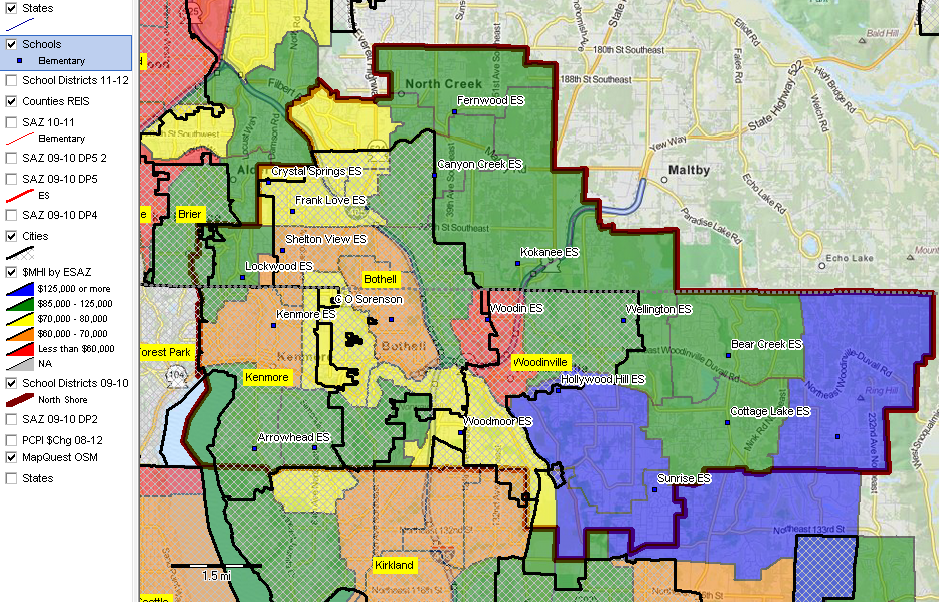 About the Data & Usage School attendance zones are part of an important collection of small area geographies useful to understand demographic-economic patterns, characteristics and trends. Related geographies include census blocks, census block groups, census tracts, ZIP code areas and school districts. A School Attendance Zone (SAZ) is a geographic area served by an individual K-12 school. SAZ geographic and demographic-economic data are used by schools, school districts, researchers, policy makers and other stakeholders to examine relationships between areas served by schools and related geographic areas (e.g., city/county). Wide-ranging decision-making is made possible by visually examining school catchment areas with related geography and demographic-economic measures. Needs of the school age population can be better analyzed resulting in possible improved educational outcomes. Characteristics of the population served by a school, and its special needs, can be better understood. Awareness of the number of students in areas hit hard by natural disasters could aid relief efforts; the Department of Homeland Security can use this information for planning disaster relief programs in case of a national disaster. These resources can aid school districts in analyzing need and distributing funds/resources to schools within its system. Additional Information ProximityOne develops geographic-demographic-economic data and analytical tools and helps organizations knit together and use diverse data in a decision-making and analytical framework. We develop custom demographic/economic estimates and projections, develop geographic and geocoded address files, and assist with impact and geospatial analyses. Wide-ranging organizations use our tools (software, data, methodologies) to analyze their own data integrated with other data. Follow ProximityOne on Twitter at www.twitter.com/proximityone. Contact ProximityOne (888-364-7656) with questions about data covered in this section or to discuss custom estimates, projections or analyses for your areas of interest. |
|
|