
|
|
|
ProximityOne Weekly Update -- 09.09.24 September 9, 2024 .. topic of the week .. examining patterns of establishments, employment and earnings by county by type of business .. use this interactive table to see that for Orange County, CA in 2023, among private sector employers, the "Real Estate and Rental and Leasing" sector had the highest average annual pay of $151,150 among all sectors. Among all counties for this sector, Santa Clara, CA had the highest average annual pay of $462,468. Use the table to learn how industry sectors in one county compare to others. Examine other sectors and other counties. Learn how, why and where change in these measures might impact your organization. Read more ... Follow this weekly update to learn more about how, where, why and by how much geographic, demographic and economic change might impact you and your organization. Here we provide information on tools, data and collaborations that you can use to develop insights into an ever changing world. Welcome to this ProximityOne weekly update .. register here to receive these weekly updates by e-mail. Of note .. • Navigating the ProximityOne Website. • SiteMap • Mapping Statistical Data • User Group .. links to these weekly updates • from the archive .. GIS & Rural Communities 2023 American Community Survey (ACS) -- Release Date 9/12/24 • see the new section on the ACS 2023 program • start accessing and using these data using DEDE and VDAGIS later this week Blog • Voting Rights Act and Block Group Demographics • Hispanic Population by Specific Origin by ZIP Code Upcoming - Using iVDA for Neighborhood Insights on Your Mobile Device - Examining Patterns & Trends of the Senior Population; U.S. by County Learning & Collaboration .. goto top
Using GIS & GeoDemographics Short Course
- about .. amplify you skillset .. get your certificate .. no fee - register - 4 weekly online modules with face-to-face support start first Thursday of each month - see about 2nd September 2024 session (9/24 module 2) Weekly Web Sessions 09.10.24. Accessing & Using GeoDemographic-Economic Data Resources Every Tuesday -- 03:00 PM Eastern Time (US and Canada) Topics & Connectivity Link 09.11.24. Congressional District & Congressional Communities . a ProximityOne & Congressional Communities collaborative program Every Wednesday -- 03:00 PM Eastern Time (US and Canada) Topics & Connectivity Link 09.12.24. GIS & GeoSpatial Analytics: Examining Geographies & Subject Matter Every Thursday -- 03:00 PM Eastern Time (US and Canada) Topics & Connectivity Link Data Analytics Tools .. goto top
Visual Data Analytics Geographic Information Systems (VDAGIS) .. goto top
Click to Start VDA Web GIS Software and enhancements GIS projects, datasets and enhancements - New this week: Los Angeles Neighborhoods VDAGIS project. - New America's Cities illustrative city demographic change profiles developed using iVDA. VDAGIS is developed, maintained and supported by ProximityOne and Tsukasa Consulting. VDAGIS Projects & Datasets - Base Project updated weekly Using iVDA -- Examining Patterns of Population Growth by City within Metros ExUrban population growth rates are outpacing suburban area population growth rates for many metros. Neither suburban or exurban (the further out geography in a metro) geographies have formally defined geographic boundaries. But by examining city population growth in the exurbs reveals that exurban population is growing faster than cities in the suburbs. This is illustrated in the Dallas metro area graphic (blue colored cities outpacing green colored cities) shown below. Make maps similar to this one for your areas of interest using iVDA .. about iVDA .. click to start now. 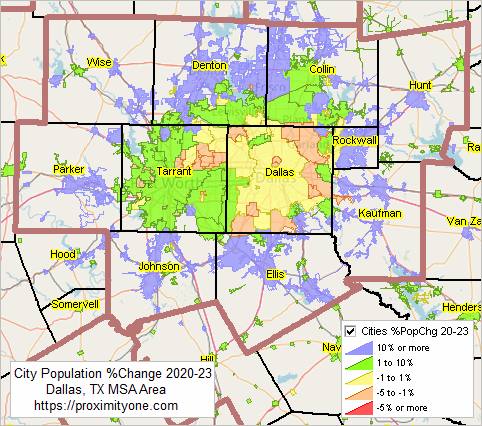 Demographic-Economic Data Explorer DEDE .. goto top DEDE is an API-based software tool that enables the user to create GIS friendly datasets from a wide range of statistical programs for a wide-range of types of geographic areas. New this week: updated quickstart. Federal Statistical System .. goto top
•
About the FSS
• Census 2020 • American Community Survey .. mosr recent: ACS 2022 • Vintage 2023 Model-based Population & Components of Change Estimates.. time series Situation & Outlook .. goto top Health, Energy & Environment .. goto top
• new topics added 9/9/24
States, Metros, Counties, Cities .. goto top Voting Rights, Congressional Districts, Legislative Districts & Congressional Communities .. goto top
• Congressional Districts
• State Legislative Districts • Congressional Communities • Voting Rights Act & Block Group Demographics Schools & School Districts .. goto top Geographic Relationship Tools & Data .. goto top New/Recent Developments/Featured Resources .. goto top
• New 2023 American Community Survey Section
• Geographic Summary Levels & Data Analytics • Examining Census Tract Characteristics • Knowing Your School District • Demographic-Economic Data Explorer (DEDE) • iVDA -- VDAGIS interactive mapping from a web page • America's Cities Demographic-Economic Patterns & Trends .. interactive mapping & table • Hispanic Population by Specific Origin by ZIP Code Area Calendar & Upcoming .. goto top • Calendar .. using the calendar .. what's new • TIGER Digital Map Database Vintage 2024 .. projected access date .. Census 9/12/24 • County Quarterly Establishments, Employment & Wages by Type of Industry .. BLS 9/5/24 • Census 2020 Modified Age & Race Census File .. Census 9/5/24 National and county-level modified age and race data by single year of age, sex, race and Hispanic origin • American Community Survey 2023 1-Year Estimates .. Census 9/12/24 • August 2024 Place/County Monthly Building Permits .. Census 9/25/24 • State Quarterly Personal Income 2024Q1 .. BEA 9/27/24 Small Area Data Reference .. goto top • Census Blocks • Block Groups • Census Tracts Establishment, Employment & Earnings by County by Type of Business .. goto top The Bureau of Labor Statistics Querterly Census of Employment and Wages (QCEW) develops quarterly/annual data based on employer reported data that provide characteristics of establishments, employment and earnings (EEE) by detailed type of business collected and tabulated by the Bureau of Labor Statistics BLS QCEW program. Derived from reports submitted by every employer subject to unemployment insurance (UI) laws, the data cover 9.5 million employers and 136.2 million full- and part-time workers. Use the updated QCEW section to access and use these data. The interactive table to see that for Orange County, CA in 2023, among private sector employers, the "Real Estate and Rental and Leasing" sector had the highest average annual pay of $151,150 among all sectors. And, that among all counties, Santa Clara, CA had the highest average annual pay of $462,468 in that sector. Use the table to learn how industry sectors in one county compares to others. ProximityOne User Group .. goto top Join the ProximityOne User Group to keep up-to-date with new developments relating to metros and component geography decision-making information resources. Receive updates and access to tools and resources available only to members. Use this form to join the User Group. Support Using these Resources .. goto top Learn more about accessing and using demographic-economic data and related analytical tools. Join us in a Web session. No fee. Each informal session is focused on a specific topic. The open structure also provides for Q&A and discussion of application issues of interest to participants. Additional Information .. goto top ProximityOne develops geographic-demographic-economic data and analytical tools and helps organizations knit together and use diverse data in a decision-making and analytical framework. We develop custom demographic/economic estimates and projections, develop geographic and geocoded address files, and assist with impact and geospatial analyses. Wide-ranging organizations use our tools (software, data, methodologies) to analyze their own data integrated with other data. Contact ProximityOne (888-364-7656) with questions about data covered in this section or to discuss custom estimates, projections or analyses for your areas of interest. |
|
|