
|
|
Situation & Outlook CV XE GIS Tools Data Resources Guide - projections to 2060 Related Sections - Situation & Outlook - Applications Gallery - States - Congressional District - School Districts - Counties - Cities/Places - Tracts/Neighborhoods - Block Groups - Census Blocks - Urban Areas Estimates-Projections - 2060 Demographic ... all county interactive table - 2030 Demographic-Economic - Single Year of Age GIS Thematic Mapping Visual Analysis Tools Ranking Tables National Scope Demographic Change 2000-2010 - States - Metros - Congressional District - School Districts - Counties - Cities/Places - Census Tracts |
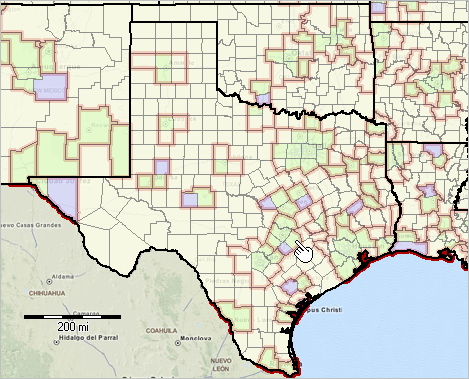
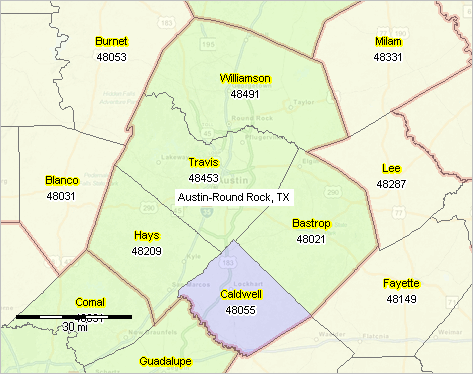
May 2016 .. we are always seeking the most current data for areas of interest. This section provides an update on accessing unpublished ACS 1-year data for many counties. Learn about how you can access ACS 1-year estimates for 85 counties for which Census released only as 5-year estimates … and why it matters. Data are tabulated from the Census Bureau American Community Survey (ACS) as 1-year estimates (for areas with population 65,000 and over) and as 5-year estimates (for areas under 65,000 population). See more about ACS 1-year versus 5-year estimates in this section. ACS 2014 1-year tabulation areas, as released by the Census Bureau included 817 of 3142 counties and 508 of 917 metros/CBSAs. There are 85 counties for which ACS 2914 1-year estimates were not released by Census but are derivable by subtracting the aggregate county components from metro totals in selected metros. County & Metro ACS 2014 1-year Estimates The following graphic shows Texas and adjacent areas: • ACS 2014 1-year estimates metros with bold brown boundaries • Counties for which ACS 2014 1-year data were tabulated and released (green). • Counties for which ACS 2014 1-year data are derivable but not released as tabulation areas (blue).  ... view developed using the CV XE GIS software. ... click map for larger view and details. The next view shows a zoom-in to the Austin, TX metro. The four green shaded counties had ACS 2014 1-year estimates tabulated and released. The fifth Austin metro county, Caldwell shaded blue, was not tabulated but the ACS 1-year data are derivable by subtracting the sum of the four counties from the metro totals. Tabulated data for Caldwell was released only as ACS 2014 5-year estimates. A similar situation exists in many metros across the country.  Why this Matters There are 85 counties for which ACS 2014 1 year data are available but not released/made available by Census as separately tabulated areas. This is important due to these considerations: • these are true annual estimates (as opposed to the other 5-year estimated counties) • they are more recent that 5-year estimates • they reflect conditions centric to one year • they enable time series/trend analysis • [as it turns out] they enable access to 1 year estimates for all counties (instead of some) in some metros Using API Tools to Examine these Data Create CSV-like files by clicking these links. When a link is clicked a new page will show the ACS 2014 1-year estimates tabulations areas. The area name, code and ACS 2014 1-year total population and related estimates are shown. • Click to retrieve county data • Click to retrieve metro data Items used in these API calls: .. B01001_001E - Total population .. B19013_001E - Median household income ($) .. B19113_001E - Median family income ($) .. B19301_001E - Per capita income Create/derive the data on your own or contact ProximityOne for more information about which counties are derivable. ProximityOne User Group Join the ProximityOne User Group to keep up-to-date with new developments relating to metros and component geography decision-making information resources. Receive updates and access to tools and resources available only to members. Use this form to join the User Group. Support Using these Resources Learn more about accessing and using demographic-economic data and related analytical tools. Join us in a Data Analytics Lab session. There is no fee for these one-hour Web sessions. Each informal session is focused on a specific topic. The open structure also provides for Q&A and discussion of application issues of interest to participants. Additional Information ProximityOne develops geodemographic-economic data and analytical tools and helps organizations knit together and use diverse data in a decision-making and analytical framework. We develop custom demographic/economic estimates and projections, develop geographic and geocoded address files, and assist with impact and geospatial analyses. Wide-ranging organizations use our tools (software, data, methodologies) to analyze their own data integrated with other data. Follow ProximityOne on Twitter at www.twitter.com/proximityone. Contact us (888-364-7656) with questions about data covered in this section or to discuss custom estimates, projections or analyses for your areas of interest. |
|
|