
|
|
|
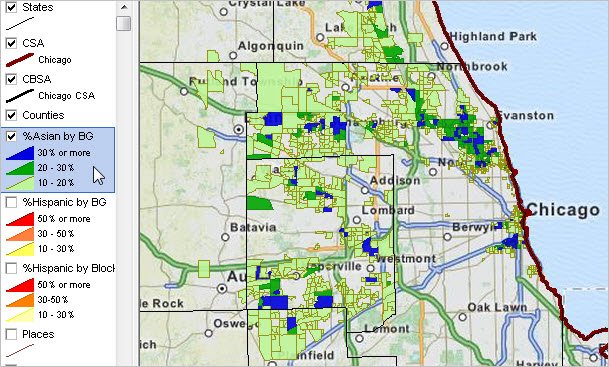
The Census Bureau API is a powerful resource that enables you to flexibly and easily access wide-ranging demographic-economic data down to the census block level. The Census API is a well-designed tool geared more toward application developers. That is, you cannot enter a Web instruction that generates a profile, map or directly usable dataset. ProximityOne has developed tools you can use to do just that -- at no cost. Direct Use of the Census API • See this summary of how to use the API to retrieve decennial census data. • See Census 2010 SF1 items available, documentation and examples. • See more about finding the right data. • Join us in a Web session for overview & Q&A. Visual Analysis of Block Group Demographic Patterns The following view of the Chicago area shows patterns of Asian and Hispanic population by block group using Census 2010 Summary File 1 data. This map has been developed using data accessed via the Census API and transitioned for visual analysis using tools reviewed below. In this example, two block group layers are displayed -- shown to the left of map in the legend (%Asian & %Hispanic). Color patterns assigned to interval values are shown for each layer in the legend. 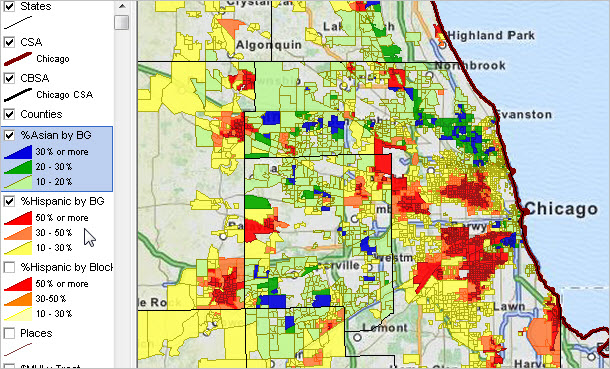 Click graphic for larger view Additional views: Asian alone ... Hispanic alone Use no-cost tools available from ProximityOne to develop similar map views for your geography and subject matter. The ProximityOne tools extend the capabilities of the Census API resource by enabling the user to create a dataset and then integrate those data into a Census-sourced shapefile to geospatially analyze the data. Details follow. 1. Use Demographic-Economic Data Extraction (DEDE) Tool The Demographic-Economic Data Extraction (DEDE), a Windows-based application, is used to programmatically control use of the Census API. The user starts DEDE, opens a geographic specifications file, a subject matter specifications file, and then clicks Run to access the specified data. The data are displayed in a spreadsheet where a row corresponds to a geographic area (block group) and columns correspond to the subject matter fields. Use the File Optionally, stop here. You now have your dataset in Excel of CSV structure for direct use. The DEDE value-added benefit is the ability to select data by a list of geographic codes, a list of subject matter items and save the API retrieved data as a dataset -- these operations are not directly available using the Census API alone. Census 2010 SF1 Table P5 Census 2010 Summary File 1 Table P5 items for a selected area (census tract in this example) is shown below.
2. Using Census API Data & GIS; Mapping & Geospatial Analysis After extracting the data using the Census API, visually/geospatially analyze the data using Geographic Information System GIS tools. See more about CV XE GIS software to perform these tasks -- available at no fee to ProximityOne User Group members. • Install CV XE GIS. • Add your User Group ID to the CV XE GIS settings. • Use the GeoGateway to add shapefiles to your GIS project. • Use the CV XE GIS dBMerge feature to integrate the DEDE data into the shapefile. • Make settings relevant to your needs; save your GIS project. Zoom to areas of interest. Change labeling/colors/appearance. Set queries to filter layers showing only select geography. Add other geography. ProximityOne User Group Join the ProximityOne User Group to keep up-to-date with new developments relating to decision-making information resources. Receive updates and access to tools and resources available only to members. Use this form to join the User Group. There is no fee. Support & DMI Web Sessions Learn more about using resources described in this section. Join us in a Decision-Making Information Web session. There is no fee for these one-hour Web sessions. Each informal session is focused on a specific topic. The open structure also provides for Q&A and discussion of application issues of interest to participants. We can address your specific questions about tools to visually analyze patterns. Additional Information ProximityOne develops geographic-demographic-economic data and analytical tools and helps organizations knit together and use diverse data in a decision-making and analytical framework. We develop custom demographic/economic estimates and projections, develop geographic and geocoded address files, and assist with impact and geospatial analyses. Wide-ranging organizations use our tools (software, data, methodologies) to analyze their own data integrated with other data. Follow ProximityOne on Twitter at www.twitter.com/proximityone. Contact ProximityOne (888-364-7656) with questions about data covered in this section or to discuss custom estimates, projections or analyses for your areas of interest. |
|
|