
|
|
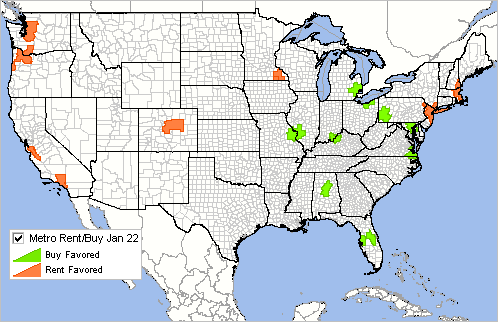
-- where buying a home is more affordable than renting -- metrics and tools to examine tenure patterns March 2022 .. housing tenure tells us about owner- versus renter-occupied housing units, the sum being occupied housing units or households. Based on ACS 2019, the number of U.S. households was 122,802,852, comprised of 78,724,862 owner-occupied units (64.1%) and 44,077,990 renter-occupied units (35.9%). Those percentages are rapidly changing; the pace varies widely by geographic area. Housing Renting versus Owning The rent versus buy decision is increasingly an option considered by many. Now that costs and interest rates are on the rise, and affordable housing non-existent in many areas, housing tenure patterns will continue to change increasingly as a result of these and other factors. This CNN Business story reviews some aspects of where buying a home is more affordable than renting and vice-versa by metro based on data developed by realtor.com. See the about metros section to examine how the metros reviewed in this section relate to all metros. This section examines housing tenure and renting vs buying in more detail and shows patterns and decision-making factors using GIS resources with a broader array of data. Updated monthly this section provides access to timely information of interest to a range of stakeholders. The expense of renting versus buying is of course one of many factors involved in determining the how and where to live location. The American Community Survey (ACS2020) provides extensive data on tenure (owner versus renter occupancy). Use the VDA Web GIS to examine some of the demographic-economic factors. View metros in context of counties, cities and neighborhood level attributes. Examine the demographics of how these areas are changing. See this VDA metros application topic. Visually Relating Preferred Buying vs Renting -- January 2022 The following graphic shows the largest 10 metros where renting is preferred to buying (orange) and the largest 10 metros where buying is preferred to renting (green). Click graphic to view larger map that shows more detail and short name for metro. The larger view also shows the rank based on tables shown below.  .. join us in a Web session where we review these data and data analytics. Top 10 Markets that Favor Renting Over Buying -- January 2022 .. goto top
Top 10 Markets that Favor Buying Over Renting -- January 2022 .. goto top
What's happening in Fresno? Contact us for more information about housing tenure in your areas of interest. Additional Information ProximityOne develops geodemographic-economic data and analytical tools and helps organizations knit together and use diverse data in a decision-making and analytical framework. We develop custom demographic/economic estimates and projections, develop geographic and geocoded address files, and assist with impact and geospatial analyses. Wide-ranging organizations use our tools (software, data, methodologies) to analyze their own data integrated with other data. Follow ProximityOne on Twitter at www.twitter.com/proximityone. Contact us (888-364-7656) with questions about data covered in this section or to discuss custom estimates, projections or analyses for your areas of interest. |
|
|