
|
|
|
Census tract demographic-economic data are used in a wide range of analyses. While census tract boundaries are coterminous with county boundaries, tract boundaries are generally not coterminous with city/place boundaries. It is often desirable to view/use a list of census tracts that intersect within a city/place. This section illustrates steps to determine census tracts partly or wholly contained within a city/place and access related demographic-economic data. While there are many ways to perform this task, steps here make use of the Census Bureau FactFinder web-based resource. Columbus, OH in Context of Counties The following graphic shows the city of Columbus, OH (orange fill pattern) in context of counties (bold black boundaries). Columbus is used in this section to illustrate steps and operations. Columbus is mainly located in Franklin County but also partly located in Delaware and Fairfield counties. The pointer is located near a part of the city located in Fairfield county. Click graphic for a larger view which shows a census tract layer. A mini-profile is shown for that census tract; the census tract is partly within the city and partly outside the city. 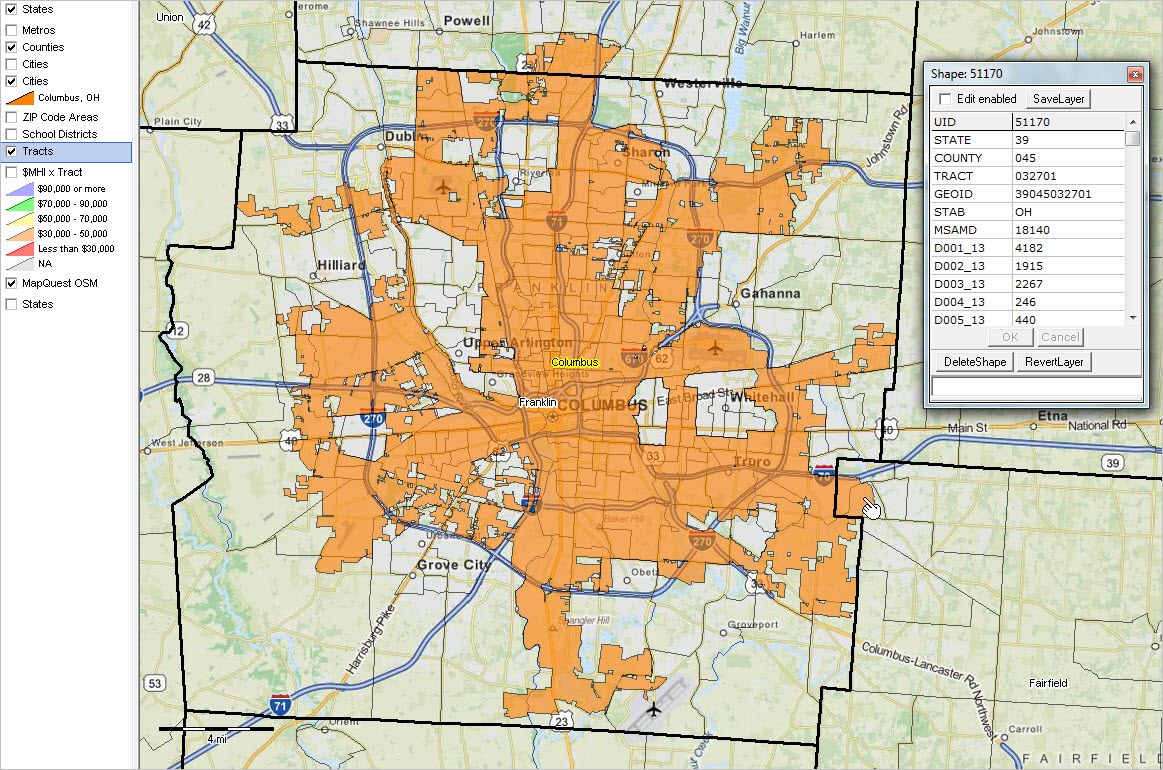 - click graphic for larger view; view developed using CV XE GIS - larger view shows census tract boundaries; in larger view see attributes of tract 39045032701 (pointer) Steps to Acquire Census Tract Codes & Demographics within a City • Start Census FactFinder -- http://factfinder.census.gov. ... open in a separate window so this section can be viewed more easily. • Select Advanced Search. • Click "Show Me All" 1. Select Geographies • Click the Geographies button located below Topics (left side of page) and then select the Name tab. • In the text box under "Enter a geography name ...", key-in "All Census Tracts (or parts) within ___" (no quotes) ... enter city/place name for ___ For example, if the place is Columbus, OH, the text box would contain: All Census Tracts (or parts) within Columbus, OH • Click "Go". ... the screen will appear similar to view shown below. • Click the checkbox by "All census tracts (or parts) fully within/partially within Columbus, OH". • Next click the Add button. ... the upper left section now shows the geography selection: ... "All census tracts (or parts) fully within/partially within Columbus, OH" 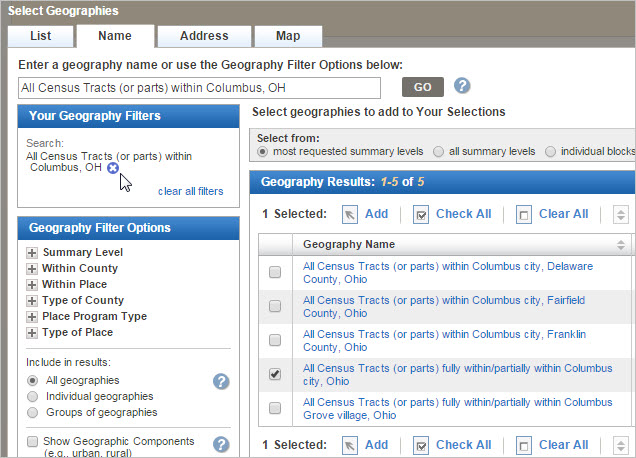 - click graphic for larger view. 2. Census 2010 Census Tracts and Total Population • Click the Topics button (left side of page). • Select Dataset; the list expands; select Census 2010 SF1 100% Data 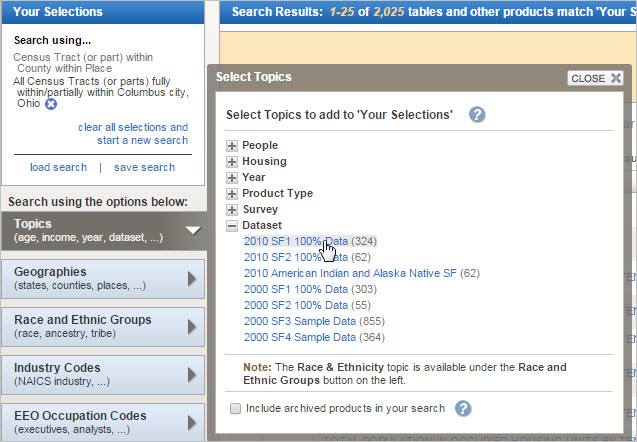 - click graphic for larger view. • Close the "Select Topics" window (Close X) and the following view appears. • Click the checkbox by P1 Total Population, then click Download (above the Table listing section). 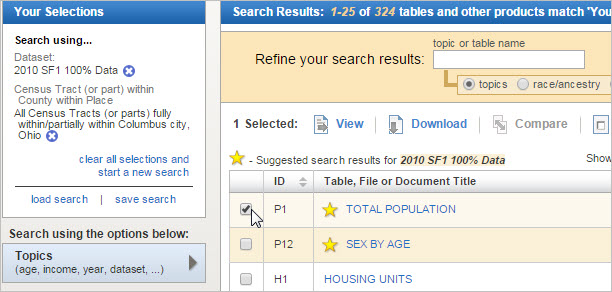 - click graphic for larger view. • Click OK for the download file to be created. • When "Your file is complete" appears, click DOWNLOAD button; download proceeds. • Your local unzip utility will show four files in the zip file (see below). • The file containing the census tract codes and total population is "DEC_10_SF1_P1_with_ann.csv". • Extract the highlighted file (see below) to a folder such as c:\temp. 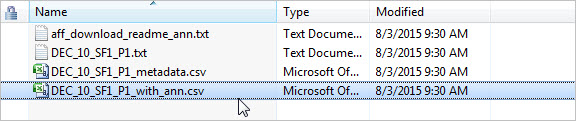 - click graphic for larger view. • To view the extracted file, start Excel and import comma-delimited text data. • In the Excel prompts, be sure to load column 2 as a text column. • The resulting file appears as shown below. There is a row/record for each census tract. • The numeric column at right is total population. • Note that the sum of these rows (on Column D) is 787,033. ... 787,033 is the same as the Census 2010 total population for Columbus, OH. ... this helps confirm that the set of tracts is correct. 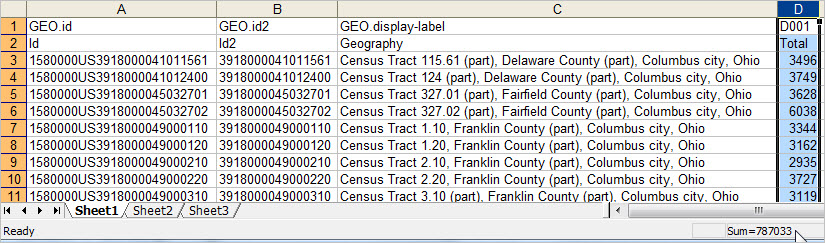 - click graphic for larger view. Further Uses of the Census Tracts File The Census 2010 census tracts for Columbus, OH is now on the local computer. Proceed through similar steps for any city/place. In the above example, Census 2010 population data were extracted for each tract. Other wide-ranging Census 2010 subject matter can be extracted by selecting other tables. The file provides a list of all census tracts intersecting with the city. Although split census tract (split by blocks) demographics are not available from the American Community Survey (ACS), this same list of tracts can be used to access ACS data for all tracts intersecting with the city. ProximityOne User Group Join the ProximityOne User Group to keep up-to-date with new developments relating to metros and component geography decision-making information resources. Receive updates and access to tools and resources available only to members. Use this form to join the User Group. Support Using these Resources Learn more about accessing and using demographic-economic data and related analytical tools. Join us in a Data Analytics Lab session. There is no fee for these one-hour Web sessions. Each informal session is focused on a specific topic. The open structure also provides for Q&A and discussion of application issues of interest to participants. Additional Information ProximityOne develops geographic-demographic-economic data and analytical tools and helps organizations knit together and use diverse data in a decision-making and analytical framework. We develop custom demographic/economic estimates and projections, develop geographic and geocoded address files, and assist with impact and geospatial analyses. Wide-ranging organizations use our tools (software, data, methodologies) to analyze their own data integrated with other data. Follow ProximityOne on Twitter at www.twitter.com/proximityone. Contact ProximityOne (888-364-7656) with questions about data covered in this section or to discuss custom estimates, projections or analyses for your areas of interest. |
|
|