

|
|
ProximityOne Main VDAGIS Related Sections - States - Metros - Congressional District - Counties - Cities/Places - Tracts/Neighborhoods - Block Groups - Census Blocks - ZIP Codes - Urban Areas |
Kansas Demographic Economic Situation & Outlook -- updated monthly
January 2025. .. today's topic .. of the 626 Kansas cities, 65 of these cities have a population of more 5,000 or more. Learn more about extended characteristics of Kansas cities in context of other geography using tools and data described in this section. See all Kansas cities interactive table below. Examine Kansas demographic-economic characteristics and how they are changing using the KSDE data and tools described in this section. Use these data and tools to examine subject matter and geography of interest. Drill down to any city and examine census block demographics. Create views like shown in the graphic below. Or for your city/area like shown below. See getting started details below. This section is updated monthly. Topics • About KSDE • Benefits • Kansas Cities Demographic Interactive Table • Getting started using KSDE • Interactive mapping & geospatial analysis • GIS Project Layers & Fields • Using KSDE .. selected topics .. interactively examine - employment and unemployment by block group - patterns of housing unit change, 2020-2024, by census block - K-12 school characteristics across the state - educational attainment by census tract - housing units by year structure built by block group • Using the iVDA Table/Query Feature • Adding other data • Kansas metropolitan areas • FAQ & related notes Kansas Metropolitan Statistical Areas The following graphic, created using KSDE, shows Kansas Metropolitan Statistical Areas (MSAs - green fill pattern) and Micropolitan Statistical Areas (MISAs - orange fill pattern). Together, the MSAs and MISAs comprise the 15 Kansas Core-Based Statistical Areas (CBSAs). See more about Kansas CBSAs below. 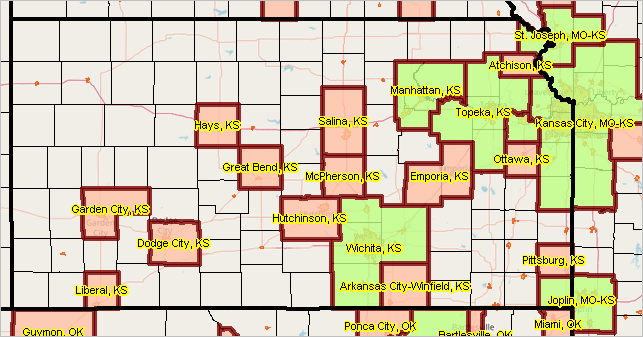 How & Why Kansas County Population is Changing 2020-2023 The following graphic, created using KSDE, shows how a county is changing (layers for gaining or losing population) and why a county is changing (interval for mainly net migration and interval for mainly natural change) for the period 4/1/20 - 6/30/23. See inset legend panel. Congressional Districts, a separate layer, are shown with bold brown boundaries. 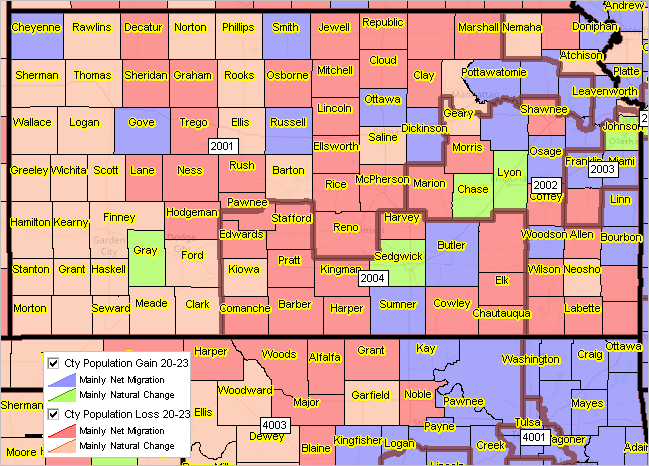 The Kansas Demographic Economic (KSDE) GIS project enables you to view/analyze demographic-economic characteristics for many types of geography. Examine schools, school districts, metros, counties, cities, townships, congressional districts, congressional communities, census tracts, block groups, ZIP codes and census blocks. This section provides access to the KSDE tools and data. Benefits KSDE is an important resource for: • Businesses .. site location, market analytics, customer analysis • State & local planners .. assessing housing situation .. • First responders, law enforcement, emergency services .. locational & incident analytics • Congressional Districts & Congressional Communities • School districts .. school & school attendance zone characteristics .. planning & evaluation • Learners & researchers This website, related tools & data and collaborative framework are intended to: • Facilitate access to & use of geographic, demographic, economic data • Show how data are used in decision-making, planning, evaluation & planning • Equip stakeholders to actually do these things • Provide a forum for networking and collaboration Visit the Registration section to register/receive updates Getting Started .. goto top KSDE may be used with these tools: • Option 1 .. Online with iVDA .. nothing to install • Option 2 .. VDA Desktop .. uses Windows desktop .. most advanced • Option 3 .. CV XE GIS Desktop .. uses Windows desktop .. see more options The start-up view for any option is shown in the following graphic. This view shows county boundaries and urban areas (orange). 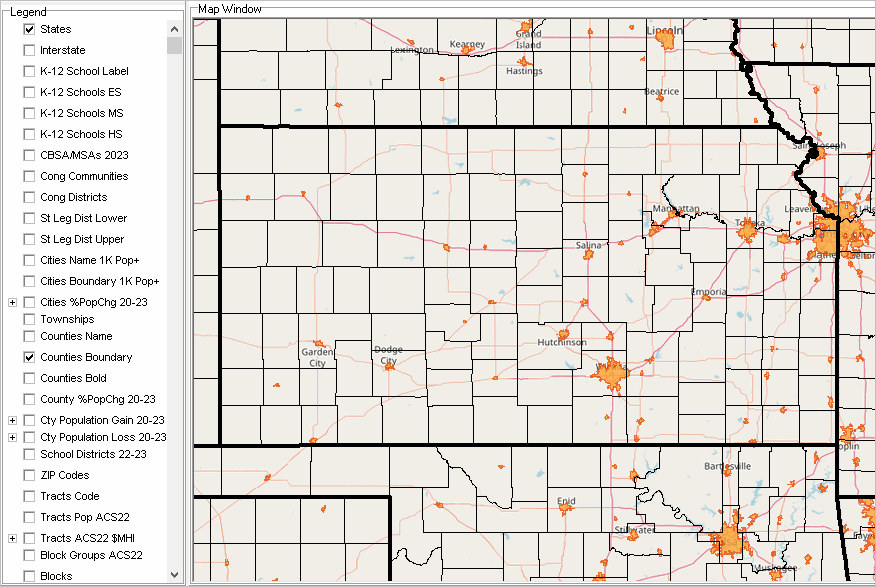 Interactive mapping & geospatial analysis -- option 1 -- Online -- using iVDA .. goto top .. part of the broader VDA GIS framework In the iVDA frame below, enter an address in the searchbar and press enter. .. enter a location/address .. example: 2309 Iowa St, Lawrence, KS 66046 .. the map view zooms-in and places a blue triangle at the location. Navigate Zoom using +/- buttons below map window. To view census tracts with census tract codes, ckeck-on the "Tracts Codes" layer in legend panel. To remove the Urban Areas (orange fill pattern) uncheck the "Urban Areas" layer. Click the blue marker and see the census tract highlights in the map .. and a demographic profile is displayed in the lower left. .. here you can examine hundreds of demographic subject matter items. The default active layer is the "Tracts Code" layer; meaning you can click anywhere in the map now and get its profile. .. or click any layer in the legend panel to select it the active layer. iVDA is presented below in an interactive mapping window .. watch video Interactive mapping & geospatial analysis -- option 1a -- Online -- using VDAW4 .. goto top Optionally use VDAW4, an alternative to iVDA, providing a larger screen. .. operations are like those for iVDA. .. the active layer is "Counties Boundary" .. click a county to view the demographic time series in lower left panel. .. check on the "Counties Name" in the legend panel to show county names .. Click to start KSDE using VDAW4 Option 2 & Option 3 Using VDA Desktop or CV XE GIS use the "KSDE.GIS" project. • Click to download the KSDE project and datasets .. this downloads the KSDE.zip file. after downloading, unsip the KSDE zip file to c:\ksde .. the expanded data must be in this folder, not as subfolder Option 2 -- VDA Desktop • Click to install the VDA Desktop software on a Windows computer .. skip if installed. - take all default settings. • see the VDA Desktop user guide for operational details • Start VDA Desktop using the desktop icon. • With VDA Desktop running, use File>Open and open c:\ksde\ksde.gis - the start-up view shown above appears. Option 3 -- CV XE GIS • Click to install the CV XE GIS software on a Windows computer .. skip if installed. - take all default settings. • see the CV XE GIS user guide for operational details • Start CVXE using the desktop icon. • With CVXE GIS running, use File>Open>Dialog and open c:\ksde\ksde.gis - the start-up view shown above appears. Guidance in getting started .. iVDA, VDA Desktop or CV XE GIS • request a zoom meeting. • join us in an every Tuesday web session to ask questions and view KSDE in operation. Using KSDE .. examining the local area employment situation ..goto top .. examining patterns of employment status by block group .. the following graphic shows patterns of the unemployment rate by block group .. large swaths of blue, low unemployment, may be misleading. .. these rural areas typically also have a low labor force participation rate. .. there are relatively high numbers of the population not in the labor force. 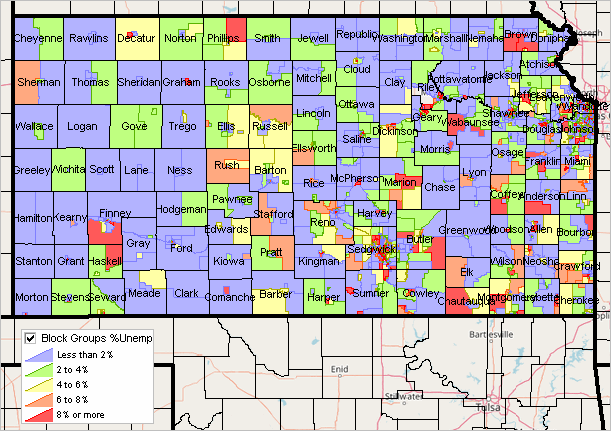 Using KSDE .. examining patterns of housing unit change, 2020-2024 .. goto top .. examining patterns of housing unit change, 2020-2024, by census block in a city or other type of area. .. using the blocks layer in the Winfield city area .. do this for any city 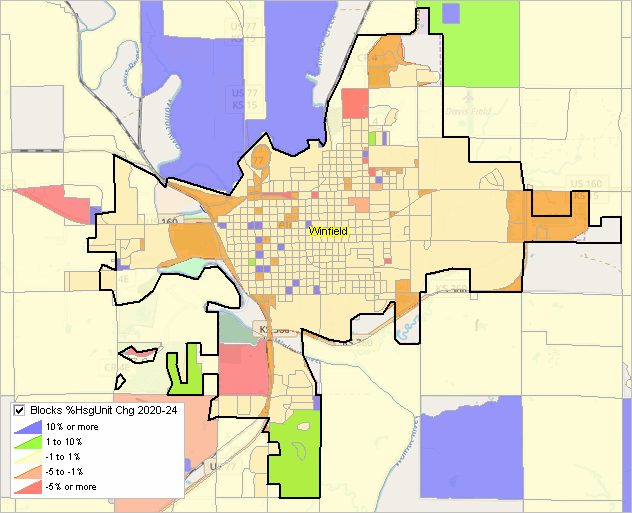 Comparing Winfield city & Cowley County using America's Demographics • Winfield & Cowley County, KS Narrative Profile Layers & Fields .. goto top The following list of layers are included in KSDE. The layers are shown in the legend panel of KSDE. The items in each layer are described in the next section Layer Details.
States
Interstate K-12 School Label K-12 Schools ES K-12 Schools MS K-12 Schools HS CBSA/MSAs 2023 Congressional Communities Congressional Districts State Legislative Districts - Lower State Legislative Districts - Upper Cities Name 1K Pop+ Cities Boundary 1K Pop+ Cities %PopChg 20-23 Townships Counties Name Counties Boundary Counties Bold County %PopChg 20-23 Cty Population Gain 20-23 Cty Population Loss 20-23 School Districts 22-23 ZIP Codes Tracts Code Tracts Pop ACS22 Tracts ACS22 $MHI Block Groups ACS22 Census Blocks Urban Areas BaseLayer1 States1 Extended Field Descriptions for "Itemset1" in Tracts Layers
GEOID=Tract Code
ST=State aland=Land area sqmt awater=Water area sqmt D001=D001 Total Population D002=D002 Male D003=D003 Female D005=D005 Under 5 Years D006=D006 5 to 9 Years D007=D007 10 to 14 Years D008=D008 15 to 19 Years D009=D009 20 to 24 Years D010=D010 25 to 34 Years D011=D011 35 to 44 Years D012=D012 45 to 54 Years D013=D013 55 to 59 Years D014=D014 60 to 64 Years D015=D015 65 to 74 Years D016=D016 75 to 84 Years D017=D017 85 Years and Over D018=D018 Median age (years) D019=D019 Under 18 years D020=D020 16 years and over D021=D021 18 years and over D022=D022 21 years and over D023=D023 62 years and over D024=D024 65 years and over D036=D036 One Race D037=D037 One Race -- White D038=D038 One Race -- Black or African American D039=D039 One Race -- American Indian and Alaska Native D044=D044 One Race -- Asian D052=D052 One Race -- Native Hawaiian and Other Pacific Islander D057=D057 One Race -- Some Other Race D058=D058 Two or more races D073=D073 Hispanic or Latino (of any race) D074=D074 Hispanic or Latino (of any race) -- Mexican D078=D078 Not Hispanic or Latino D079=D079 Not Hispanic or Latino -- White Alone D080=D080 Not Hispanic or Latino D088=D088 Total housing units D089=D089 Citizen 18 and Over Population D090=D090 Citizen 18 and Over Population - Male D091=D091 Citizen 18 and Over Population - Female S001=S001 Total Households S002=S002 Total Households -- Married-couple family S004=S004 Total Households -- Cohabitating couple household S006=S008 Total Households -- Householder living alone male S010=S012 Total Households -- Householder living alone female S016=S016 Average household size S017=S017 Average family size S018=S018 Population in Households S053=S053 School Enrollment -- Pop 3 Yrs & Over Enrolled in School S054=S054 School Enrollment -- Pop 3 Yrs & Over Enrolled in School -- Nursery School Preschool S055=S055 School Enrollment -- Pop 3 Yrs & Over Enrolled in School -- Kindergarten S056=S056 School Enrollment -- Pop 3 Yrs & Over Enrolled in School -- Elementary School (Grades 1-8) S057=S057 School Enrollment -- Pop 3 Yrs & Over Enrolled in School -- High School (Grades 9-12) S058=S058 School Enrollment -- Pop 3 Yrs & Over Enrolled in School -- College or Graduate School S059=S059 Educational Attainment -- Pop 25 Yrs & Over S060=S060 Educational Attainment -- Pop 25 Yrs & Over -- Less than 9th Grade S061=S061 Educational Attainment -- Pop 25 Yrs & Over -- 9th to 12th Grade No Diploma S062=S062 Educational Attainment -- Pop 25 Yrs & Over -- High School Graduate (Incl Equivalency) S063=S063 Educational Attainment -- Pop 25 Yrs & Over -- Some College No Degree S064=S064 Educational Attainment -- Pop 25 Yrs & Over -- Associate's Degree S065=S065 Educational Attainment -- Pop 25 Yrs & Over -- Bachelor's Degree S066=S066 Educational Attainment -- Pop 25 Yrs & Over -- Graduate or Professional Degree S067=S067 Educational Attainment -- Pop 25 Yrs & Over -- Percent High School Graduate or Higher S068=S068 Educational Attainment -- Pop 25 Yrs & Over -- Percent Bachelor's Degree or Higher S079=S079 Residence 1 Year Ago -- Population 1 Year and Over S080=S080 Residence 1 Year Ago -- Same House S081=S081 Residence 1 Year Ago -- Different House in US or abroad S082=S082 Residence 1 Year Ago -- Different House in US S083=S083 Residence 1 Year Ago -- Different House in US -- Same County S084=S084 Residence 1 Year Ago -- Different House in US -- Different County S085=S085 Residence 1 Year Ago -- Different House in US -- Different County -- Same State S086=S086 Residence 1 Year Ago -- Different House in US -- Different County -- Different State S087=S087 Residence 1 Year Ago -- Abroad S089=S089 Place of Birth -- Native S090=S090 Place of Birth -- Native -- Born in U.S. S091=S091 Place of Birth -- Native -- Born in U.S. -- State of Residence S092=S092 Place of Birth -- Native -- Born in U.S. -- Different State S093=S093 Place of Birth -- Native -- Born in PR, US Island Areas or Born Abroad to American Parents S094=S094 Place of Birth -- Foreign Born S095=S095 U.S. Citizenship Status -- Foreign-Born Population S096=S096 U.S. Citizenship Status -- Foreign-Born Population -- Naturalized U.S. Citizen S097=S097 U.S. Citizenship Status -- Foreign-Born Population -- Not a U.S. Citizen S112=S112 Language Spoken at Home -- Pop 5 Yrs & Over S113=S113 Language Spoken at Home -- Pop 5 Yrs & Over -- English Only S114=S114 Language Spoken at Home -- Pop 5 Yrs & Over -- Language Other Than English S115=S115 Language Spoken at Home -- Pop 5 Yrs & Over -- Language Other Than English -- Speak English Less Than Very Well S116=S116 Language Spoken at Home -- Pop 5 Yrs & Over -- Language Other Than English -- Spanish S117=S117 Language Spoken at Home -- Pop 5 Yrs & Over -- Language Other Than English -- Spanish -- Speak English Less Than Very Well S152=S152 Computers and Internet Use -- Total Households S153=S153 Computers and Internet Use -- Households with a Computer S154=S154 Computers and Internet Use -- Households with a Broadband Internet Subscription E001=E001 Employment Status -- Population 16 Years+ E002=E002 Employment Status -- in Labor Force E003=E003 Employment Status -- Civilian Labor Force E004=E004 Employment Status -- Employed E005=E005 Employment Status -- Unemployed E006=E006 Employment Status -- Armed Forces E007=E007 Employment Status -- Not in Labor Force E008=E008 Employment Status -- Civilian Labor Force E009P=E009 Employment Status -- Percent Unemployed E026=E026 Civilian Employed Population 16 Years+ E027=E027 Occupation -- Management, business, science, and arts E028=E028 Occupation -- Service occupations E029=E029 Occupation -- Sales and office occupations E030=E030 Occupation -- Natural resources, construction & maintenance E031=E031 Occupation -- Production, trans and material moving E033=E033 Industry -- Agriculture Forestry Fishing & Hunting & Mining E034=E034 Industry -- Construction E035=E035 Industry -- Manufacturing E036=E036 Industry -- Wholesale Trade E037=E037 Industry -- Retail Trade E038=E038 Industry -- Transportation & Warehousing & Utilities E039=E039 Industry -- Information E040=E040 Industry -- Finance & Insurance & Real Estate & Rental & Leasing E041=E041 Industry -- Prof, Scientific, & Management & Admin & Waste Mgmt Svc E042=E042 Industry -- Educational Services & Health Care & Social Assistance E043=E043 Industry -- Arts, Entertainment, Recreation, Accommodation & Food Services E044=E044 Industry -- Other Services Except Public Administration E045=E045 Industry -- Public Administration E047=E047 Class of Worker -- Private Wage & Salary Workers E048=E048 Class of Worker -- Government Workers E049=E049 Class of Worker -- Self-Employed, Not Inc Business Workers E050=E050 Class of Worker -- Unpaid Family Workers E052=E052 Total Households -- Income and Benefits -- Less Than $10,000 E053=E053 Total Households -- Income and Benefits -- $10,000 to $14,999 E054=E054 Total Households -- Income and Benefits -- $15,000 to $24,999 E055=E055 Total Households -- Income and Benefits -- $25,000 to $34,999 E056=E056 Total Households -- Income and Benefits -- $35,000 to $49,999 E057=E057 Total Households -- Income and Benefits -- $50,000 to $74,999 E058=E058 Total Households -- Income and Benefits -- $75,000 to $99,999 E059=E059 Total Households -- Income and Benefits -- $100,000 to $149,999 E060=E060 Total Households -- Income and Benefits -- $150,000 to $199,999 E061=E061 Total Households -- Income and Benefits -- $200,000 or More E062=E062 Median Household Income E063=E063 Mean Household Income E064=E064 Income and Benefits -- Households -- with Earnings E065=E065 Income and Benefits -- Households -- with Earnings -- Mean Earnings $ E066=E066 Income and Benefits -- Households -- with Social Security E067=E067 Income and Benefits -- Households -- with Social Security -- Mean Social Security Income $ E068=E068 Income and Benefits -- Households -- with Retirement Income E069=E069 Income and Benefits -- Households -- with Retirement Income -- Mean Retirement Income $ E070=E070 Income and Benefits -- Households -- with Supplemental Security Income E071=E071 Income and Benefits -- Households -- with Supplemental Security Income -- Mean Supplemental Security Income $ E072=E072 Income and Benefits -- Households -- with Cash Public Assistance Income E073=E073 Income and Benefits -- Households -- with Cash Public Assistance Income -- Mean Cash Public Assistance Income $ E074=E074 Income and Benefits -- Households -- with Food Stamp/Snap Benefits in the Past 12 Months E075=E075 Income and Benefits -- Families E076=E076 Income and Benefits -- Families -- Less Than $10,000 E077=E077 Income and Benefits -- Families -- $10,000 to $14,999 E078=E078 Income and Benefits -- Families -- $15,000 to $24,999 E079=E079 Income and Benefits -- Families -- $25,000 to $34,999 E080=E080 Income and Benefits -- Families -- $35,000 to $49,999 E081=E081 Income and Benefits -- Families -- $50,000 to $74,999 E082=E082 Income and Benefits -- Families -- $75,000 to $99,999 E083=E083 Income and Benefits -- Families -- $100,000 to $149 999 E084=E084 Income and Benefits -- Families -- $150,000 to $199 999 E085=E085 Income and Benefits -- Families -- $200,000 or More E086=E086 Median Family Income E087=E087 Mean Family Income E088=E088 Per Capita Income E089=E089 Nonfamily Households E090=E090 Nonfamily Households -- Median Nonfamily Income E091=E091 Nonfamily Households -- Mean Nonfamily Income E092=E092 Median Earnings for Workers E093=E093 Median Earnings for Male Full-Time Year-Round Workers E094=E094 Median Earnings for Female Full-Time Year-Round Workers E095=E095 Civ Noninst Population E096=E096 Civ Noninst Population -- Health Insurance Coverage -- .. with Health Insurance Coverage E097=E097 Civ Noninst Population -- Health Insurance Coverage -- ... with Private Health Insurance Coverage E098=E098 Civ Noninst Population -- Health Insurance Coverage -- ...... with Public Health Coverage E099=E099 Civ Noninst Population -- Health Insurance Coverage -- .... No Health Insurance Coverage E119P=E119 Percent Families whose income past 12 onths below poverty level E128P=E128 Percent All People whose income past 12 onths below poverty level H001=H001 Total Housing Units H002=H002 Occupied Housing Units H003=H003 Vacant Housing Units H004=H004 Homeowner Vacancy Rate H005=H005 Rental Vacancy Rate H007=H007 Total Housing Units -- Units in Structure -- 1-Unit Detached H008=H008 Total Housing Units -- Units in Structure -- 1-Unit Attached H009=H009 Total Housing Units -- Units in Structure -- 2 Units H010=H010 Total Housing Units -- Units in Structure -- 3 or4 Units H011=H011 Total Housing Units -- Units in Structure -- 5 to 9 Units H012=H012 Total Housing Units -- Units in Structure -- 10 to 19 Units H013=H013 Total Housing Units -- Units in Structure -- 20 or More Units H014=H014 Total Housing Units -- Units in Structure -- Mobile Home H015=H015 Total Housing Units -- Units in Structure -- Boat, RV, Van H017=H017 Total Housing Units -- Year Built -- 2020 or later H018=H018 Total Housing Units -- Year Built -- 2010 to 2019 H019=H019 Total Housing Units -- Year Built -- 2000 to 2009 H020=H020 Total Housing Units -- Year Built -- 1990 to 1999 H021=H021 Total Housing Units -- Year Built -- 1980 to 1989 H022=H022 Total Housing Units -- Year Built -- 1970 to 1979 H023=H023 Total Housing Units -- Year Built -- 1960 to 1969 H024=H024 Total Housing Units -- Year Built -- 1950 to 1959 H025=H025 Total Housing Units -- Year Built -- 1940 to 1949 H026=H026 Total Housing Units -- Year Built -- 1939 or earlier H037=H037 Total Housing Units -- Rooms -- Median Rooms H046=H046 Tenure -- Owner-Occupied H047=H047 Tenure -- Renter-Occupied H048=H048 Tenure -- Average Household Size of Owner-Occupied Unit H049=H049 Tenure -- Average Household Size of Renter-Occupied Unit H051=H051 Year Householder Moved into Unit -- 2019 or later H052=H052 Year Householder Moved into Unit -- 2015 to 2018 H053=H053 Year Householder Moved into Unit -- 2010 to 2014 H054=H054 Year Householder Moved into Unit -- 2000 to 2009 H055=H055 Year Householder Moved into Unit -- 1990 to 1999 H056=H056 Year Householder Moved into Unit -- 1989 or earlier H058=H058 Occ housing units -- No Vehicles Available H059=H059 Occ housing units -- Vehicles Available -- 1 Vehicle Available H060=H060 Occ housing units -- Vehicles Available -- 2 Vehicles Available H061=H061 Occ housing units -- Vehicles Available -- 3 or More Vehicles Available H063=H063 House Heating Fuel -- Utility Gas H064=H064 House Heating Fuel -- Bottled Tank or LP Gas H065=H065 House Heating Fuel -- Electricity H066=H066 House Heating Fuel -- Fuel Oil Kerosene Etc. H067=H067 House Heating Fuel -- Coal orCoke H068=H068 House Heating Fuel -- Wood H069=H069 House Heating Fuel -- Solar Energy H077=H077 Occupants per Room -- 1.00 or Less H078=H078 Occupants per Room -- 1.01 to 1.50 H079=H079 Occupants per Room -- 1.51 or More H081=H081 Value -- Less Than $50 000 H082=H082 Value -- $50,000 to $99,999 H083=H083 Value -- $100,000 to $149,999 H084=H084 Value -- $150,000 to $199,999 H085=H085 Value -- $200,000 to $299,999 H086=H086 Value -- $300,000 to $499,999 H087=H087 Value -- $500,000 to $999,999 H088=H088 Value -- $1,000,000 or More H089=H089 Median Housing Value H090=H090 Owner-Occupied Units H091=H091 Mortgage Status -- Housing Units with a Mortgage H092=H092 Mortgage Status -- Housing Units Without a Mortgage H126=H126 Occupied Units Paying Rent H127=H127 Gross Rent -- Less Than $500 H128=H128 Gross Rent -- $500 to $999 H129=H129 Gross Rent -- $1,000 to $1,499 H130=H130 Gross Rent -- $1,500 to $1,999 H131=H131 Gross Rent -- $2,000 to $2,499 H132=H132 Gross Rent -- $2,500 to $2,999 H133=H133 Gross Rent -- $3,000 or More H134=H134 Median Rent Block Group Level Data .. goto top
01001_001E TotPopA23 Total Population
B01001_002E MPopA23 Male B01001_026E FPopA23 Female B02001_002E White1A23 White alone B02001_003E Black1A23 Black or African American alone B02001_004E AIAN1A23 American Indian and Alaska Native alone B02001_005E Asian1A23 Asian alone B02001_006E NHOPI1A23 Native Hawaiian and Other Pacific Islander alone B02001_007E Other1A23 Some other race alone B02001_008E MultiA23 Two or more races B03002_012E HispA23 Hispanic (any race) B01001_003E A0004MA23 Male: Under 5 years B01001_004E A0509MA23 Male: 5 to 9 years B01001_005E A1014MA23 Male: 10 to 14 years B01001_006E A1517MA23 Male: 15 to 17 years B01001_027E A0004FA23 Female: Under 5 years B01001_028E A0509FA23 Female: 5 to 9 years B01001_029E A1014FA23 Female: 10 to 14 years B01001_030E A1517FA23 Female: 15 to 17 years B09020_001E Pop65upA23 Population 65 years and over B11002_001E PopHHA23 Population in Households B11001_001E HHA23 Total Households B11001_002E FamA23 Family Households B15002_001E Pop25upA23 Population 25 years and over B15002_011E EAHSMA23 Male: High school graduate (includes equivalency) B15002_015E EABMA23 Male: Bachelor's degree B15002_016E EAMMA23 Male: Master's degree B15002_017E EAPMA23 Male: Professional school degree B15002_018E EADMA23 Male: Doctorate degree B15002_028E EAHSFA23 Female: High school graduate (includes equivalency) B15002_032E EABFA23 Female: Bachelor's degree B15002_033E EAMFA23 Female: Master's degree B15002_034E EAPFA23 Female: Professional school degree B15002_035E EADFA23 Female: Doctorate degree B29001_001E VATOTA23 Total Citizen, Voting-Age Population B29001_002E VA1829A23 Total Citizen, Voting-Age Population 18 to 29 years B29001_003E VA3044A23 Total Citizen, Voting-Age Population 30 to 44 years B29001_004E VA4564A23 Total Citizen, Voting-Age Population 45 to 64 years B29001_005E VA65UPA23 Total Citizen, Voting-Age Population 65 or more years B25003_001E TotHsgA23 Total housing units B25003_002E OwnOccA23 Owner occupied units B25003_003E RntOccA23 Renter occupied units B25002_003E VacantA23 Vacant units B25105_001E MDMTHHCA23 Median Monthly Housing Costs (Dollars) B19013_001E MHIA23 Median Household Income B19113_001E MFIA23 Median Family Income B25077_001E MHVA23 Median housing value B25064_001E MdRentA23 Median gross rent B19083_001E GiniA23 Gini Index of Income Inequality B23025_001E POP16UPA23 Population 16 years and over B23025_002E LFA23 In labor force B23025_003E CLFA23 Civilian labor force B23025_004E EMPA23 Employed B23025_005E UNEMPA23 Unemployed B23025_006E AFA23 Armed Forces B23025_007E NILFA23 Not in labor force Using KSDE .. the iVDA Table/Query Feature .. goto top .. examining K-12 school characteristics across the state .. or any one school Consider the application where you want to examine elementary schools across the state that meet a certain criteria. Use the iVDA Table/Query tool to perform these operations. The following graphic illustrates use of the iVDA Table/Query feature with the K-12 Elementary Schools layer using KSDE. The yellow markers show K-12 Elementary Schools. See steps to create this view below the graphic. 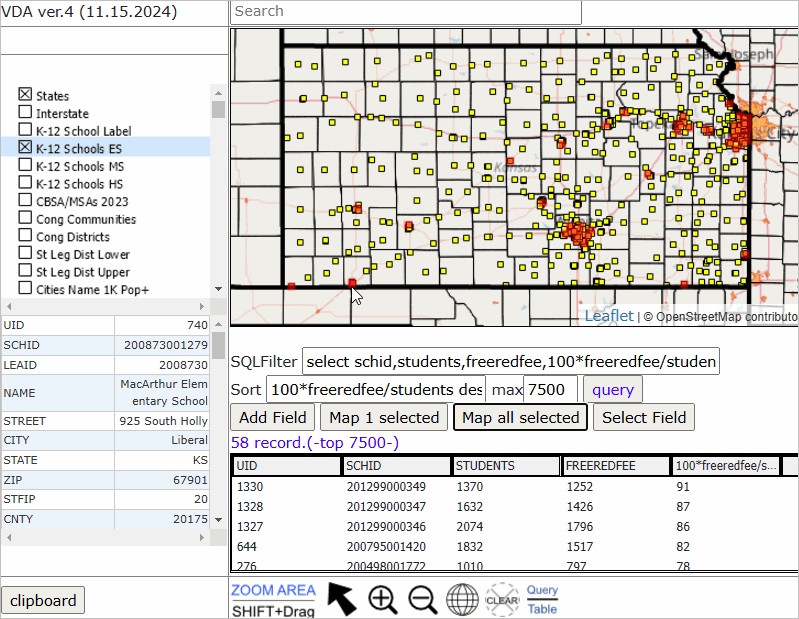 Here are more details about using the Table/Query feature. Use the Table/Query feature with any layer. Click the layer in the legend panel; it turns blue; it is the active layer. Start the Table/Query feature by clicking the Table/Query button below the map window at the right. Click this button results in the view refreshing; the map window at the top, the table/grid below the map window. Each row shows attributes of a school. Set a Query In the SQL Filter edit box, key in a query. In this example the query is (not fully visible): &nbpp; select schid,students,freeredfee, 100*freeredfee/students where students>500The query says show the selected items for all schools in this table with more than 500 students. In this example, the "selected items" are: schid,students,freeredfee, 100*freeredfee/students .. schid - school id .. students - number of students .. freeredfee - number of students in free and reduced fee price lunch program .. 100*freeredfee/students - computed value -- percent freeredfee In this example, the "where" clause restricts the set of schools to those with more than 500 students. Sort Rows in Table Optionally set the sort order or the ways rows are displayed in the table. .. enter the sort items and order (DESC or ASC) and in SORT edit boz. 100*freeredfee/students DESCPerform the Query .. click the "Query" .. the table refreshes showing the results in the table. .. there are 58 schools in the state that meet this criteria. .. see that the rows are sorted the item 100*freeredfee/students in descending order. Show Selected Schools in Map Window .. click the "Map All Selected" button to show schools meeting the criteria in the refreshws map view. .. selected schools now show in the map with an orange highlight color. Use the Identify Tool to View Attributes of a School .. in the Map Window, click on a school and view its profile in the lower left panel. End of this subsection on Table/Query. Examining Educational Attainment by Census Tract .. goto top This subsection reviews use of KSDE to examine educational attainment by census +ract .. how many and which census tracts have an %high school educational attainment of 80& or more? .. select the census tract layer "Tracts Pop ACS22". .. we use the field S067 Educational Attainment -- Pop 25 Yrs & Over -- % High School Graduate or Higher .. start Table/Query (see application above) End of this subsection on Educational Attainment. Examining Housing Units by Year Structure Built by Block Group .. goto top The following graphic shows patterns of housing units by year structure built by block group in the Wichita area. At glance you can see where older housing was built before 1939 (blue pattern). .. areas (block groups) with no color have no housing units built before 1939. .. the number of housing units today is shown by the upper label. .. the percent of housing units built before 1939 is shown by the lower label. Click graphic for larger view. 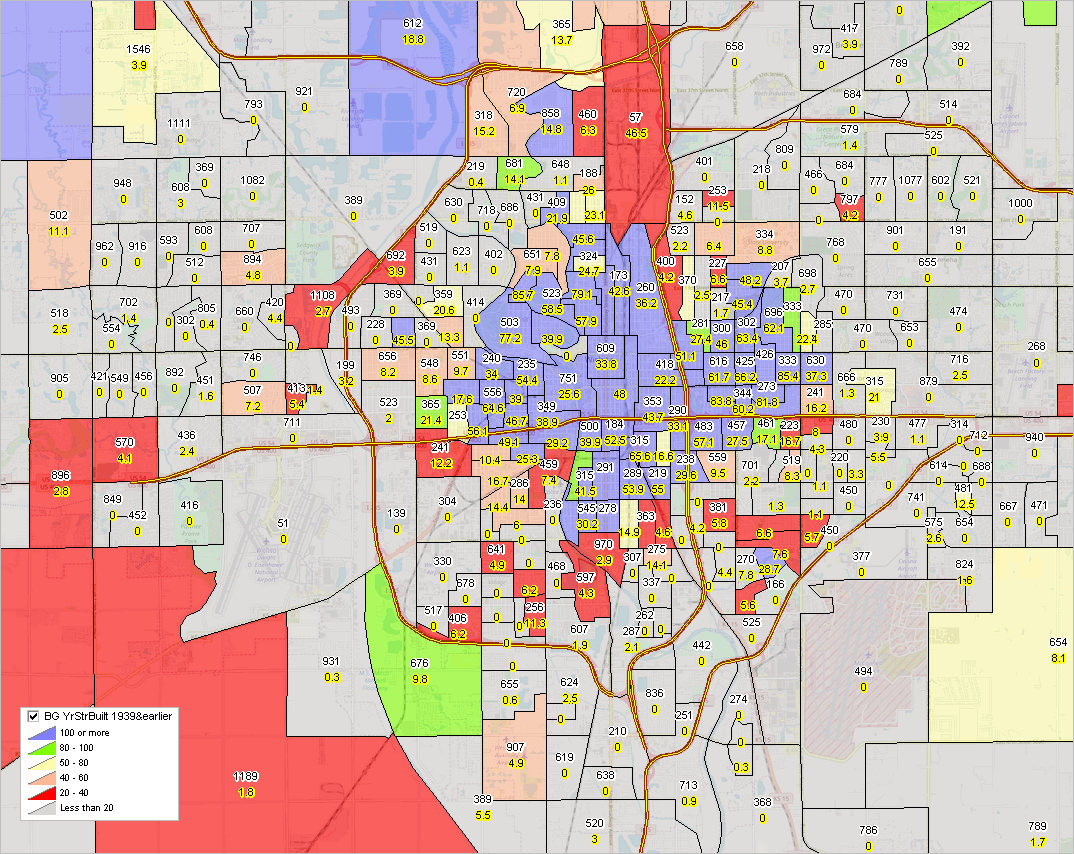 End of this subsection on housing units by year structure built. Adding Data .. goto top While KSDE provides a broad array of geographic, demographic, economic and other data, users can add layers to mix-in yet other data using VXEGIS or VDA Desktop. For example, examine patterns of a "concentrated disadvantaged index" for residents by block group or census tract. Such an index might be based on a computed value mixing ACS 5-year estimates for poverty, education, rent and labor force participation rate. Another example would be to develop and add data not readily accessible such as land use, brownfields/remediation, architectural innovation to assess where/how new housing might be added. These data might be developed from a city/county tax parcel shapefile. Water Features .. water areas .. unzip this zip file to c:\ksde folder. .. https://www2.census.gov/geo/tiger/TIGER2024/AREAWATER/tl_2024_20035_areawater.zip .. these are county-by-county files; this file is for Cowley County, KS (20035) .. with CV XE GIS running, add the Water Area layer to KSDE.GIS project. .. using the layer editor place this layer towards the top in the legend panel; color the area and boundary blue. .. linear water features .. unzip this zip file to c:\ksde folder. .. https://www2.census.gov/geo/tiger/TIGER2024/LINEARWATER/tl_2024_20035_linearwater.zip .. these are county-by-county files; this file is for Cowley County, KS (20035) .. with CV XE GIS running, add the linear water ayer to KSDE.GIS project. .. using the layer editor place this layer towards the top in the legend panel; color the line blue. Join us in weekly web sessions to discuss how these data can be added. Kansas Cities -- Population & Population Change 2020-2023 -- interactive table .. goto top the interactive table below shows a row for each of the Kansas 625 cities. as an illustrative example, click the link for the Abilene to view a demographic analytics narrative profile. - "message us" (click lower right button) to have a link/profile added for your city of interest. use mouse-over on header column to view extended item/column name. see usage notes below table. Usage Notes Use mouse-over on header column to view extended item/column name. Click ShowAll button to reset table. • View "Up to 5 Cities" .. enter 5 City codes in the 5 edit boxes then click button "Up to 5 Cities" .. the default selection of cities: 2079000 Wichita 2053775 Overland Park 2036000 Kansas City 2052575 Olathe 2071000 Topeka Table Column Descriptions CityName State USPS GeoID City Type Population Base2020 Population 2020 Population 2021 Population 2022 Population 2023 PopChg 22_23 %PopChg 22_23P PopChg 20_23 %PopChg 20_23P Land Area SqMi 2023 Water Area SqMi 2023 Population Density 2023 Kansas Core-Based Statistical Areas (CBSAs) .. goto top The following graphic, created using KSDE, shows Kansas Metropolitan Statistical Areas (MSAs - green fill pattern) and Micropolitan Statistical Areas (MISAs - orange fill pattern). Together, the MSAs and MISAs comprise the 175 Kansas Core-Based Statistical Areas (CBSAs).  Kansas Metropolitan Statistical Area Demographic Characteristics .. goto top The folowing graphic lists all 2023 vintage CBSAs. See corresponding U.S. by CBSAs interactive table. 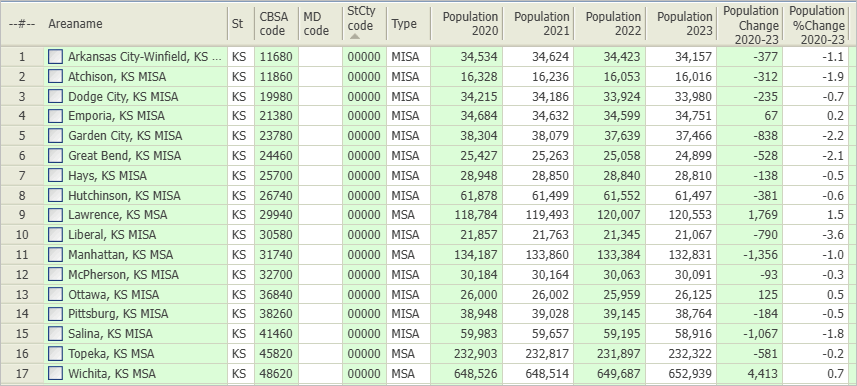 Metropolitan Statistical Areas (MSAs) and Micropolitan Statistical Aarea (MISAs) are geographic areas that includes a county or counties with an urban area of at least 10,000 plus adjacent counties with a high degree of economic and social integration. Together, the MSAs and MISAs comprise the 15 Kansas Core-Based Statistical Areas (CBSAs). The Office of Management and Budget (OMB) defines CBSAs. CBSA designations: • MSAs have at least one urban area with a population of 50,000 or more • MISAs have at least one urban area with a population of 10,000 to 49,999 MSAs and MISAs are made up of counties, including the county with the urban area and any adjacent counties with a high degree of social and economic integration. This integration is usually measured by commuting ties. Other characteristics of metropolitan and micropolitan areas: Metropolitan divisions A metropolitan area with a population of 2.5 million or more can be divided into smaller groups of counties called metropolitan divisions. Combined statistical areas Adjacent MSAs and MSAs can be combined to form a Combined Statistical Area (CSA) if they meet certain criteria. Terms of Use .. goto top There is no warranty for any aspect of any aspect of KSDE. The user is solely responsible for use of KSDE. Frequently Asked Questions .. goto top Q Is there a cost to use KSDE? A No, anyone can use the KSDE Online at no fee. Government agencies can use KSDE with VDA Desktop or CV XE GIS at no fee. Q Are specialized staff required to use KSDE? A No. Q Are training and advisory support available? A Yes. See below. Q Can I add my own data? A Yes, using CV XE GIS or VDA Desktop .. Windows desktop versions Related notes To use the KSDE project with iVDA, use https://proximityone.com/ksde.htm#ivda .. that deployment of iVDA uses the KSDE project. .. the deployment of iVDA at https://proximityone.com/ivda.htm uses the “Base” project Support Using these Resources .. goto top Learn more about accessing and using demographic-economic data and related analytical tools. Join us in a Data Analytics Lab session. There is no fee for these one-hour Web sessions. Each informal session is focused on a specific topic. The open structure also provides for Q&A and discussion of application issues of interest to participants. Additional Information ProximityOne develops geodemographic-economic data and analytical tools and helps organizations knit together and use diverse data in a decision-making and analytical framework. We develop custom demographic/economic estimates and projections, develop geographic and geocoded address files, and assist with impact and geospatial analyses. Wide-ranging organizations use our tools (software, data, methodologies) to analyze their own data integrated with other data. Contact us (888-364-7656) with questions about data covered in this section or to discuss custom estimates, projections or analyses for your areas of interest. |
|
|