
|
|
|
CV XE GIS Tools Data Resources Guide - projections to 2060 Related Sections - Applications Gallery - States - Congressional District - School Districts - Counties - Cities/Places - Tracts/Neighborhoods - Block Groups - Census Blocks - Urban Areas Demographic-Economic Estimates-Projections GIS Thematic Mapping Visual Analysis Tools Ranking Tables National Scope Demographic Change 2000-2010 - States - Metros - Congressional District - School Districts - Counties - Cities/Places - Census Tracts |
Atlanta-Sandy Springs-Roswell, GA Metro Demographic Change: 2015 to 2040 .. population projections to 2040 by age group: 25 year demographic outlook
September 2015. Current demographic estimates are important as they tell us "where we are now" for a geographic area. Demographic projections tell us how the population size and composition might change in the future. Current (2015) demographic estimates and projections to 2040 are described in this section for the Atlanta-Sandy Springs-Roswell, GA metropolitan statistical area (see about counties included). The 2015 population of 5,651,601 is projected to grow to 7,014,382 in 2040, an increase of 1,362,781 population (24.1 percent growth). See more about these projections and terms of use. These data provide a picture of the future and how the population size and composition might change. Knowing about how the population size and composition might change is important to most all private and public sector planning needs. These data can help stakeholders gain insights into the size of the workforce 25 years ahead and population distribution by age. The projections help business assess where and how the demand/sales of their products and services might change. The projections provide a basis to set goals and targets for the future. Demographic estimates and projections reviewed here are not "futurist" points of view. These data have been developed using models and historical data. Projections tell us about the future that we cannot know. They provide information about the future based on what we know now and expect to change from year to year. As a result, projections need to be updated annually and reflect our changing knowledge of actual events. Projections reflect assumptions about birth rates, survival rates and migration. Alternative projections might be developed for alternative assumptions about how these factors will change. In this section only one set of projections is reviewed, the most likely. Atlanta-Sandy Springs-Roswell, GA MSA Counties The following map shows the metro with bold boundary. Counties are labeled with county name and state-county FIPS code. Click graphic for larger view. 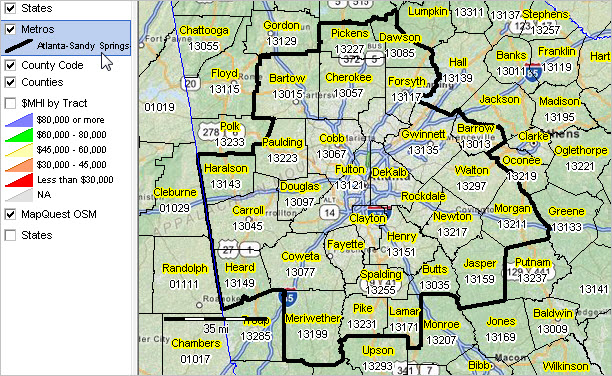 -- view developed with CV XE GIS software.. Atlanta-Sandy Springs-Roswell, GA MSA Population Projections to 2040 by Age Group
.. single year of age projections are developed by county, metro and state annually to 2060 .. data are available as profiles, data files and shapefiles for mapping and GIS applications. Atlanta-Sandy Springs-Roswell, GA MSA -- Population Estimates & Components of Change: 2010-2014 The following table shows historical Census Bureau-sourced population estimates and components of change. Census Bureau estimates are updated annually and lag one year behind the current year. The Census Bureau does not develop state, metro or county projections.
Atlanta Metro by County: Population Characteristics & Trends Metropolitan areas are defined as one or more contiguous counties based on a set of demographic-economic criteria. Counties comprising the Atlanta metro are shown below. Click county code link to view county components of change and estimates by age/race-origin, 2010-2014.
Atlanta Metro Patterns of Economic Prosperity by Neighborhood The following map shows ACS 2013 estimates of median household income (MHI) by census tract. See the color/data legend at left of map. Census tracts average 4,000 population and sub-divide counties. 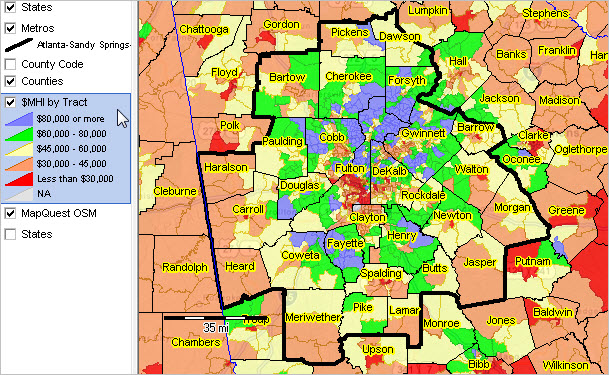 View developed with CV XE GIS software. See this section to learn about making custom metro maps. About These Projections and Terms of Use Current estimates (as of 2015) and projections (to 2040) have been developed by ProximityOne. These data may be used for any purpose provided that ProximityOne is referenced as the source and no fee is charged for their use. These data have no guarantee nor warranty as to accuracy or any other feature. The user is solely responsible for any possible use. ProximityOne User Group Join the ProximityOne User Group to keep up-to-date with new developments relating to metros and component geography decision-making information resources. Receive updates and access to tools and resources available only to members. Use this form to join the User Group. Support Using these Resources Learn more about accessing and using demographic-economic data and related analytical tools. Join us in a Data Analytics Lab session. There is no fee for these one-hour Web sessions. Each informal session is focused on a specific topic. The open structure also provides for Q&A and discussion of application issues of interest to participants. Additional Information ProximityOne develops geodemographic-economic data and analytical tools and helps organizations knit together and use diverse data in a decision-making and analytical framework. We develop custom demographic/economic estimates and projections, develop geographic and geocoded address files, and assist with impact and geospatial analyses. Wide-ranging organizations use our tools (software, data, methodologies) to analyze their own data integrated with other data. Follow ProximityOne on Twitter at www.twitter.com/proximityone. Contact us (888-364-7656) with questions about data covered in this section or to discuss custom estimates, projections or analyses for your areas of interest. |
|
|