 in context of median household income patterns by census tract in Atlanta .. visual analysis using GIS tools ..")
|
|
|
American Community Survey 2014 Interactive Tables -- examining demographic-economic patterns
January 2016. Use the interactive tables described in this section to examine, view, compare, rank and assess demographic-economic patterns and characteristics of interest for wide-ranging geography based on ACS 2014 data. It is very important to understand the demographic-economic make-up and patterns for wide-ranging geographies. Community and neighborhood challenges and opportunities are shaped by demographic-economic dynamics. Knowing more about "where we are now" is essential to understanding needs for policy and program management. The quality and precision of business marketing and operational plans and decisions can be improved using these data. School districts can better understand their school district community using these data. Elected officials and policymakers can better understand the needs and characteristics of constituents who they represent. Students can benefit by using these data in studies and research by attaching real world data to support, document and analyze topics of interest. Data from the American Community Survey 2014 (ACS 2014) are key to these uses, users and processes. See more about the importance of these data. The ACS 2014 interactive tables are part of a larger set of tables comprised of multi-sourced data that are updated frequently. Additional ACS 2014 tables will be added. Join the User Group to receive updates as tables are added. Median Household Income by ZIP Code Area; Los Angeles Area Illustrating integration of data in tables using GIS tools & geospatial analysis. Larger view illustrates ZIP code area labeling and use of mini-profile feature 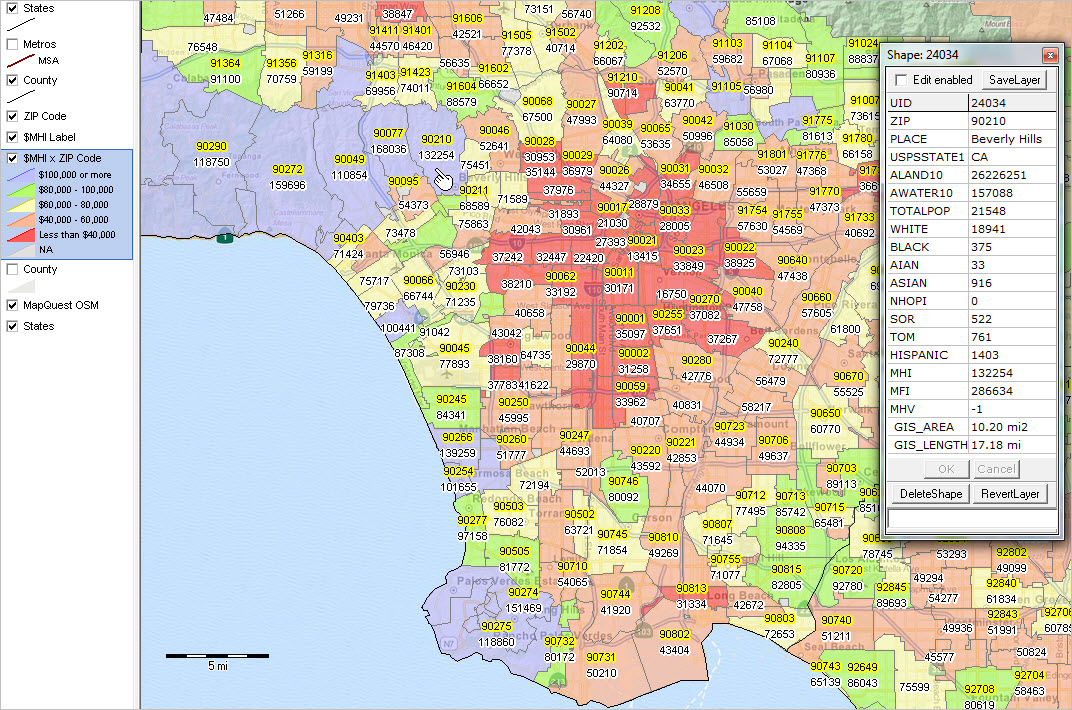 View developed with CV XE GIS software. Click graphic for larger view; expand browser window for best quality view. Using the Tables The interactive tables are organized by type of geography (e.g., ZIP codes) using a standardized structure. There are four types of subject matter for each type of geography (general demographic, social, economic and housing). There is a table/web page for each combination of geography by type of subject matter. Within each table there is a row that corresponds to a geographic area. Also within each table, columns provide geographic names and codes and a set of subject matter data standardized across all geographies. Similarly designed table controls are provided at the below the table. Usage notes are located below the table. Terms of Use These data may be used for any purpose, except that the data may not be bulk downloaded nor used to create similar interactive tables. There is no warranty of any type with regard to any aspect of the data, table or Web pages. The user is solely responsible for any use. It is requested that any use of any table reference the source of the data (ACS 2014), ProximityOne and a link to the Web page. Data Analytics ProximityOne has developed these interactive tables as part of a broader set of data analytics tools and data resources. Data shown in the tables are available in dataset structure (CSV, DBF, Excel) on a fee basis. These data are also available as data integrated into shapefiles for GIS applications and geospatial analysis. Most geographic table sections also provide access to ready-to-use GIS projects/datasets. These data are integrated with yet other data to develop/update the Situation & Outlook database and information system, ProximityOne Data Service, Situation & Outlook Metro Reports and other products. These data are also used in the ProximityOne Certificate in Data Analytics and custom service/study applications Where's Waldo? Use this interactive tool to key in an address and determine geographic codes (geocodes) that might be useful. After keying in an address, click Find button. If the address is located, the page refreshes with a set of geocodes presented below the demographic-economic statistical summary. ACS 2014 Tables & Datasets ACS summary data are are tabulated and released annually as 1-year and 5-year estimates. These data are all estimates, subject to errors of estimation and other errors, based on household surveys. • ACS 1-year estimates (for areas 65,000 population or more) become available in September; e.g. the ACS 2014 1-year estimates became available in September 2015. • ACS 5-year estimates (all geographies) become available in December; e.g. the ACS 2014 5-year estimates became available in December 2015. • See this section for more information about 1-year versus 5-year estimates and comparing ACS data over time. Table listing provided below are separated into two groups as to data source: ACS 1-year and ACS 5-year. All tables are U.S. national scope. ACS 2014 1-Year Tables Data in these tables are centric to mid-2014. U.S., State, CBSA/Metro - General Demographics .. Social Characteristics .. Economic Characteristics .. Housing Characteristics 114th Congressional Districts - General Demographics .. Social Characteristics .. Economic Characteristics .. Housing Characteristics ACS 2014 5-Year Tables Data in these tables are centric to mid-2012 (mid-point of survey period 2010-2014). Census Tracts - General Demographics .. Social Characteristics .. Economic Characteristics .. Housing Characteristics ZIP Code Areas - General Demographics .. Social Characteristics .. Economic Characteristics .. Housing Characteristics School Districts - General Demographics .. Social Characteristics .. Economic Characteristics .. Housing Characteristics State Legislative Districts - General Demographics .. Social Characteristics .. Economic Characteristics .. Housing Characteristics Importance of the ACS Data The American Community Survey provides "richer" demographic-economic characteristics for wide-ranging U.S. national scope statistical and political geography. Only ACS sourced data provide details on topics such as income and poverty, labor force and employment, housing value and costs, educational participation and attainment, language spoken at home, among many related items. The approximate 600 items accessible via the dataset are supplemented by a wide range of additional subject matter. ProximityOne User Group Join the ProximityOne User Group to keep up-to-date with new developments relating to metros and component geography decision-making information resources. Receive updates and access to tools and resources available only to members. Use this form to join the User Group. Support Using these Resources Learn more about accessing and using demographic-economic data and related analytical tools. Join us in a Data Analytics Lab session. There is no fee for these one-hour Web sessions. Each informal session is focused on a specific topic. The open structure also provides for Q&A and discussion of application issues of interest to participants. Additional Information ProximityOne develops geodemographic-economic data and analytical tools and helps organizations knit together and use diverse data in a decision-making and analytical framework. We develop custom demographic/economic estimates and projections, develop geographic and geocoded address files, and assist with impact and geospatial analyses. Wide-ranging organizations use our tools (software, data, methodologies) to analyze their own data integrated with other data. Follow ProximityOne on Twitter at www.twitter.com/proximityone. Contact us (888-364-7656) with questions about data covered in this section or to discuss custom estimates, projections or analyses for your areas of interest. |
|
|