
|
|
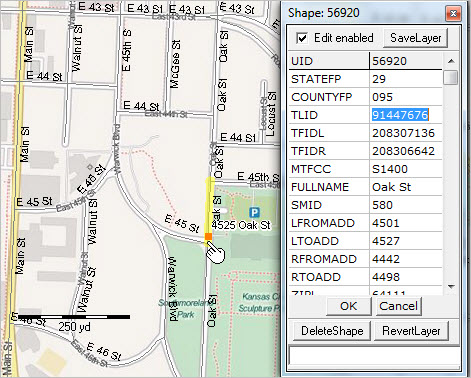
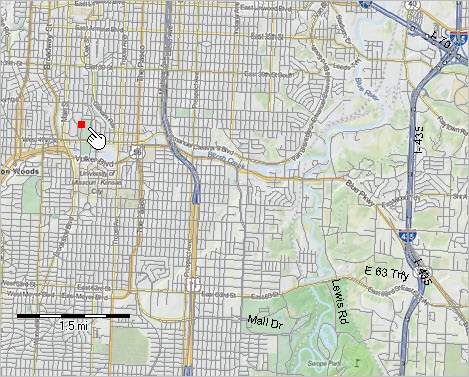
Enter an address on a Google Maps page, or many other similar Web-based "find address" tools, and view that address on a map. View street detail easily. But a view of the digital road segment is not available. Answers to these questions are not available: • what are the demographic-economic attributes for that location? • what are the left and right side address ranges for that road segment? • what are the geocodes on the left and right sides of that road segment? • what are the end-point coordinates for the road segment? • how does that road segment (the route) extend through the city or county? Use methods described in this section to answer these types of questions and examine "Address to Digital Road Segment" relationships. An example is used that features an address shown as a red marker in the banner graphic at the top of this page. That address is also used in the interactive data access form below. Use these resources and methods for most addresses in the U.S. Tools reviewed here are available at no fee. Viewing Address/Location in Context of Digital Roads In the following graphic, a geocoded address (point shapefile) is shown as a red marker (see pointer) in context of roads (streets/lines shapefile). The Identify tool is used to show the profile of associated road segment (TLID=91447676) -- an intersection to intersection segment of Oak St. Performing a query on the roads shapefile/layer to locate ID 91447676, the segment is displayed as yellow-highlighted. This application/view is reviewed in this section.  Finding Address Attributes Use the form below to find attributes for an address. To get started, click the Find button with default settings. Results are returned/displayed on this same page. More in general, key in an address of interest, select the type of geography (more about this below) and click Find. Try your own addresses of interest; use this tool to meet recurring address lookups. Not clear on all the steps? Join us in a Data Analytics Lab session, get answers to questions.
Enter address details ...
See information about content displayed below. Refresh page to remove content displayed below.
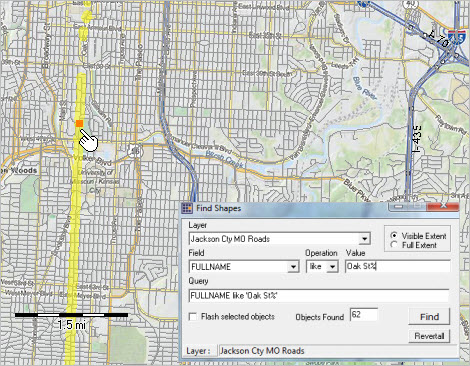
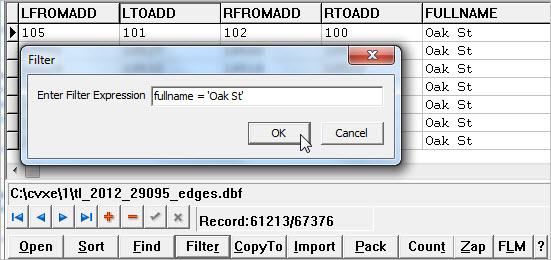
Click Find to show results demographic-economic characteristics and geocodes ... (feature tested for use with Firefox, Safari, Internet Explorer & Chrome) About the Data Content and Structure When the Find button (above) is clicked, this page refreshes with returned data based on your query -- the values entered/selected in the section above the Find button. The first portion of the data displayed provide a structured display of selected subject matter items (ACS 5-year estimates) for the type of geography selected (e.g. tracts) for that area in which the address is located. The scope of those items could be substantially expanded. Following that portion of the display are the geographic attributes displayed as JSON output resulting from the geocoder processing of the address. This is the display content below the text "Summary of address sent and matched results:". Road Segment Attributes See road segment attributes for this address under "Summary of address sent and matched results:" and "Address: {". See that the road segment ID is shown by "tigerLineId": "91447676". This ID uniquely identifies this road segment among all of the more than 45 million road segments in the U.S. (see more detail in related section). Viewing the Address with GIS Tools 1. Install CV XE GIS software (if already installed, skip step 1). .. Install package -- Windows 32/64 .. Start-up Readme 2. After installation, with CV XE GIS running, open a GIS project: .. Use File>Open>Dialog and open the GIS project named c:\cvxe\1\cvxe_us2.gis. Perform these steps: 2.1. In the Legend Panel, uncheck layers $MHI x BG and Locations. 2.2. Use the Add Layer button to add the layer c:\cvxe\1\$$address1.shp. .. address used in this application now appears as red marker .. this single point shapefile was created using the CV XE Tools>FindAddress 2.3. In Legend Panel, check layer Jackson Cty MO roads. .. now, all roads in the county can be viewed with marker. .. optionally zoom-in to develop view like shown at top of this page.  .. view developed with ProximityOne CV XE GIS and related GIS project. 2.4. Use the CV XE GIS Tools>FindShape tool to show all occurrences of "Oak St" .. on the FindShape form the FULLNAME field is selected and set to "like" Oak St%. .. all road segments having name like "Oak St%" are highlighted in yellow.  .. view developed with ProximityOne CV XE GIS and related GIS project. 2.5. Use the CV XE GIS Database>dBrowse feature to show all occurrences of "Oak St" as a table. .. there are 155 road segment, shown in the next graphic with left and right-side address ranges. .. optionally export for use in other applications.  Not clear on all the steps? Join us in a Data Analytics Lab session, get answers to questions. Census Block Code See section starting with "2010 Census Blocks". In the default address run, the census block shows as "GEOID": "290950066002016": ... state: 29 ... county: 095 ... tract: 006600 ... block: 2016. Other items, such as the TIGER/Line segment ID and segment side, can also be important for some applications. Any given address or location is contained with several types of statistical areas (e.g. census tract or block group) and political areas (e.g. city or county). We may want to know the demographic-economic characteristics of a location for any one or several of these geographies. Use the interactive tool on this page to access those data. For example, access/view the median household income of the location/address block group or the median household income the location/address city. ProximityOne User Group Join the ProximityOne User Group to keep up-to-date with new developments relating to metros and component geography decision-making information resources. Receive updates and access to tools and resources available only to members. Use this form to join the User Group. Support Using these Resources Learn more about accessing and using demographic-economic data and related analytical tools. Join us in a Data Analytics Lab session. There is no fee for these one-hour Web sessions. Each informal session is focused on a specific topic. The open structure also provides for Q&A and discussion of application issues of interest to participants. Additional Information ProximityOne develops geographic-demographic-economic data and analytical tools and helps organizations knit together and use diverse data in a decision-making and analytical framework. We develop custom demographic/economic estimates and projections, develop geographic and geocoded address files, and assist with impact and geospatial analyses. Wide-ranging organizations use our tools (software, data, methodologies) to analyze their own data integrated with other data. Follow ProximityOne on Twitter at www.twitter.com/proximityone. Contact ProximityOne (888-364-7656) with questions about data covered in this section or to discuss custom estimates, projections or analyses for your areas of interest. |
|
|