|
|
|
Related Sections - Situation & Outlook - Applications Gallery - States - Congressional District - School Districts - Counties - Cities/Places - Tracts/Neighborhoods - Block Groups - Census Blocks - Urban Areas Demographic-Economic Estimates-Projections GIS Thematic Mapping Visual Analysis Tools Ranking Tables National Scope Demographic Change 2000-2010 - States - Metros - Congressional District - School Districts - Counties - Cities/Places - Census Tracts |
114th Congressional District Members & Demographic-Economic Patterns
See related section 114th Congressional District: Median Income & Housing Value. The same interactive table is used. The associated GIS project differs some. 114th Congressional District Hard Line Republican Incumbents The following graphic illustrates use of the ACS 2014 data to develop a thematic pattern map of median household income by 114th Congressional District. This graphic makes use of one subject matter item among hundreds of ACS subject matter items tabulated. Incumbent are shown as hard line republicans (red square markers) and other incumbents (yellow circle markers). Incumbent locations (city-state) were geocoded enabling the view of incumbents by their city-state location. It is easy to see in the map view that there are no Hard Line Republican Incumbents (HLRIs) in California. Click graphic for larger view showing legend and mini profile example.  -- view developed using CV XE GIS software and related GIS project. -- see details below on this page for information about the data used to develop the above view. -- click above graphic for larger view with county overlay; illustrates mini-profile. • zoom-in view of Houston area 114th Congressional District Members & Patterns of Economic Prosperity
Republicsns as blue square markers; Democrats as red circular markers. 114th Congressional Districts with patterns of ACS 2014 median family income. 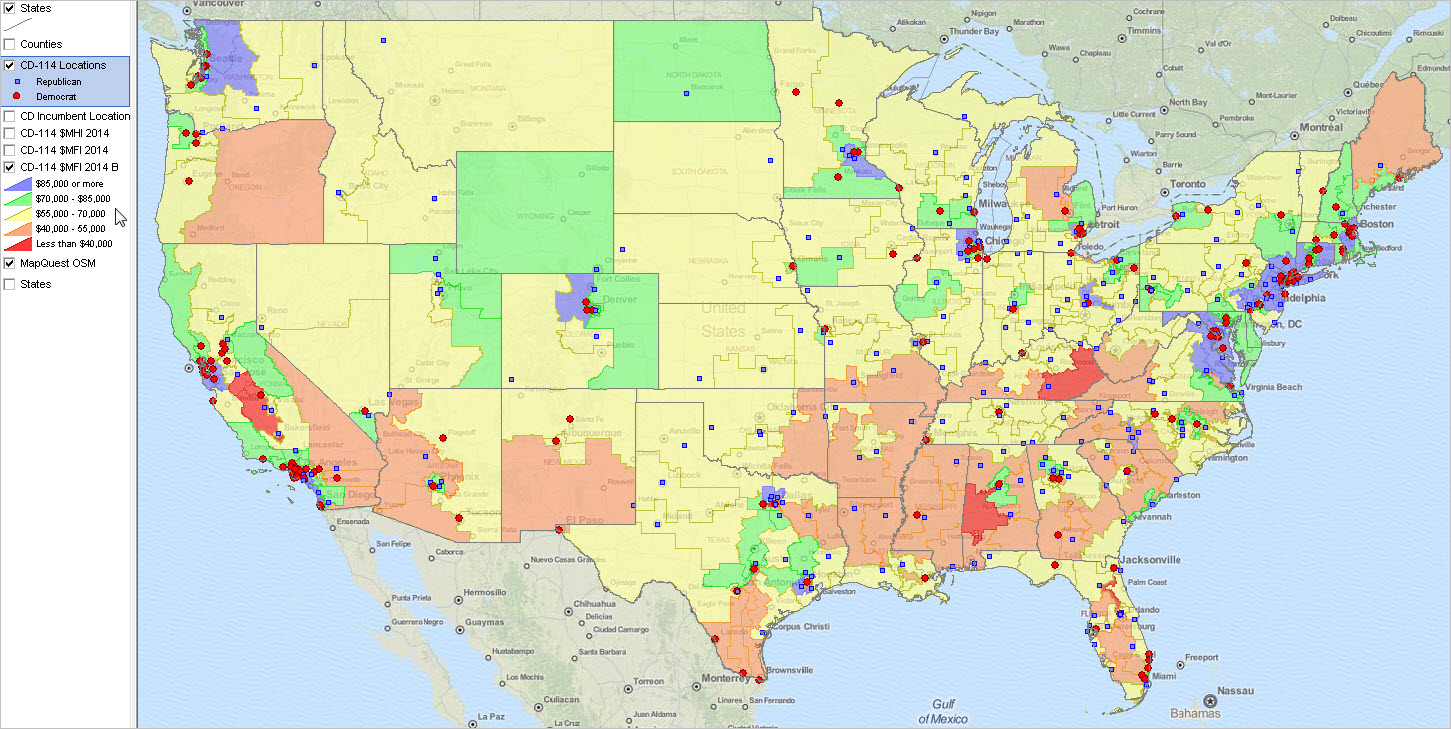 -- view developed using CV XE GIS software and related GIS project. Create reference/pattern maps for any CD or region, optionally integrated with other geography and subject matter, using the CV XE GIS software and related GIS project. The Feature column in the interactive table (shown below) contains a 1 for incumbents who are members of the House Freedom Caucus. Use the Feature dropdown below the table to select only those members who are members of the Caucus. After selecting these members, dbl-click the header of any column to sort on that column. For example, you can see that the 2014 $MHI ranges between $39,872 and $94,749 compared to $24,429 to $115,291 for all members. How about members in one state? Click the ShowAll button. Use this "step-down" sequence example: select Arizona. Select Republican. Select Hard Line. At any step, you can sort on any column. 114th Congress Incumbents by Location/Attribute & Demographic-Economic Patterns -- interactive table Click column header to sort; click again to sort other direction. Click ShowAll between queries. Table initially ranked on state-CD in descending order View maps of individual districts - opens new page ... create custom CD maps - opens new page See related Ranking Tables Main Page Table Usage Columns/Fields These items are also included in the GIS project CD shapefile FirstName - incumbent first name (as of September 2015) LastName - incumbent last name (sort or query on this item Party St - state CD - Congressional district code STCD - State USPS abbreviation + congressional district code CD114 - State FIPS code + congressional district code ALAND - Congressional district land area (square meters) WLAND - Congressional district water area (square meters) Population 2013 Population 2014 PopCh 2013-14 -- population change 2013-2014 %PopCh 2013-14 -- percent population change 2013-2014 MHI 2013 -- median household income 2013 MHI 2014 -- median household income 2014 MHI Change 2013-14 -- median household income change 2013-2014 %MHI Change 2013-14 -- median household income percent change 2013-2014 MFI 2013 -- median family income 2013 MFI 2014 -- median family income 2014 MFI Change 2013-14 -- median family income change 2013-2014 %MFI Change 2013-14 -- median family income percent change 2013-2014 MHV 2013 -- median housing value 2013 MHV 2014 -- median housing value 2014 MHV Change -- median housing value change 2013-14 %MHV Change -- median housing value percent change 2013-14 About the GIS Project & ACS 2014 Dataset The ACS 2014 dataset used to create the view above was developed using the ProximityOne Demographic-Economic Data Extraction (DEDE) software. The DEDE API tools were used to extract ACS 2013 items and ACS 2014 items. Those data were then integrated into a metro shapefile using the ProximityOne CV XE GIS software. Once the 2013 and 2014 data are available, wide-ranging analytics can be performed. Map views shown above provide examples. Subject matter items are listed above. The larger map view profile shows field values for a selected CD (see pointer). For example, the MHI2013 (median household income, 2013) for MO 04 is $43,857 and MHI2014 (median household income, 2014) $45,674. 2014 marks the first time that analysts are able to compare annual change in $MHI (or any other ACS item) for the 114th Congressional Districts. U.S. Median Household Income and Median Family Income ACS Income of Households ... includes the income of the householder and all other individuals 15 years old and over in the household, whether they are related to the householder or not. Because many households consist of only one person, median household income is usually less than median family income. The median divides the income distribution into two equal parts: one-half of the cases falling below the median income and one-half above the median. For households and families, the median income is based on the distribution of the total number of households and families including those with no income. The median income for individuals is based on individuals 15 years old and over with income.
Support Using these Resources Learn more about demographic-economic data and related analytical tools. Join us in a Data Analytics Lab session. There is no fee for these one-hour Web sessions. Each informal session is focused on a specific topic. The open structure also provides for Q&A and discussion of application issues of interest to participants. ProximityOne User Group Join the ProximityOne User Group to keep up-to-date with new developments relating to metros and component geography decision-making information resources. Receive updates and access to tools and resources available only to members. Use this form to join the User Group. Additional Information ProximityOne develops geographic-demographic-economic data and analytical tools and helps organizations knit together and use diverse data in a decision-making and analytical framework. We develop custom demographic/economic estimates and projections, develop geographic and geocoded address files, and assist with impact and geospatial analyses. Wide-ranging organizations use our tools (software, data, methodologies) to analyze their own data integrated with other data. Follow ProximityOne on Twitter at www.twitter.com/proximityone. Contact ProximityOne (888-364-7656) with questions about data covered in this section or to discuss custom estimates, projections or analyses for your areas of interest. |
|
|