
|
|
|
Visually compare the geographic relationship between block groups or census tracts by using the CV XE GIS GeoGateway feature. The GeoGateway feature can be thought of as a "mapcompiler" -- selectively add shapefiles as layers to a GIS project. Cupertino, CA Study Area The graphic below shows the start-up view of the GIS project that will be used in this section. 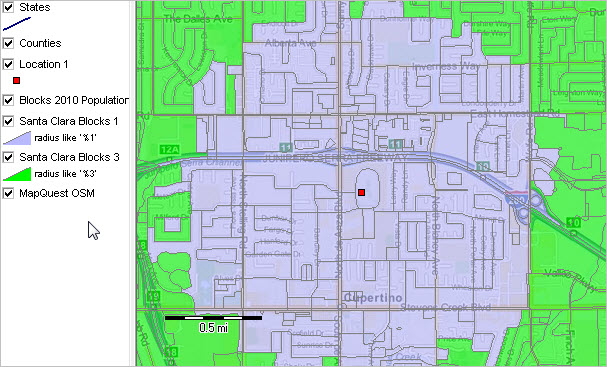 -- view developed using CV XE GIS software. The red marker shows the location of 1 Infinite Circle, Cupertino, CA. Census blocks with blue fill pattern are within 1-mile distance from the address/location. Census blocks with green fill pattern are within 3-mile distance from the address/location. Block groups, census tracts and roads will be added to this GIS project through steps described in this section. The resulting views are shown below. You can use the resources and procedures described in this section to develop similarly constructed maps for anywhere in the U.S. While the applications shown here illustrate use of map compiler, or GIS project development tool, for block groups and census tracts, the CV XE GeoGateway can be used to select and combine any of the TIGER/Line shapefiles. Location-Based Demographic-Economic Characteristics Applications used in this section illustrate viewing block group and census tract geography related to the related interactive Location-Based Demographics tool (LBD). Use the LBD tool to access/display demographic-economic data for any address. Among options are to access/display data by block group or census tract. GIS Project Start-up & Development The following steps are required to operationally proceed with mapcompiler steps: • Install the CV XE GIS software (level 1 or higher) if not already installed. • Unzip the CAPS1 GIS project fileset to the folder c:\cv_caps (new folder). • Start CV XE GIS; use File>Dialog>Open to open the GIS project c:\cv_caps\caps_06085_zoom1.gis. .. the view will be similar to the view shown above. Summary of Steps to Add Layers 1. Start File>GeoGateway; a new form appears. 2. Add the Santa Clara CA census tracts shapefile/layer. 3. Add the Santa Clara CA block groups shapefile/layer. 4. Add the Santa Clara CA edges/roads shapefile/layer. 5. Close GeoGateway form; perform mapping and analytical operations. Step-by-Step Details 1. Start File>GeoGateway; a new form appears. 2. Add the Santa Clara CA census tracts shapefile/layer. In the "1. Select Geographic Scope" section, scroll down to CA 06085 Santa Clara County. - dblclick, name appears in "Selected Area". In the "2, Select Shapefile/GeoFile Type" section, dblclick Census Tracts. Click Download button (in "File to Download" Section) - respond to prompts In "Add Layer to Project" ... - select GEOID10 as "Shape Label" - select Blue as "Area Outline color" - select White as "Label Outline color" - key-in 90 as "Area Outline width" - click Add Layer to Project button 3. Add the Santa Clara CA block groups shapefile/layer. In the "2, Select Shapefile/GeoFile Type" section, dblclick Block Groups. Click Download button (in "File to Download" Section) - respond to prompts In "Add Layer to Project" ... - select GEOID10 as "Shape Label" - select Red as "Area Outline color" - select Yellow as "Label Outline color" - key-in 30 as "Area Outline width" - click Add Layer to Project button 4. Add the Santa Clara CA edges/roads shapefile/layer. In the "2, Select Shapefile/GeoFile Type" section, dblclick Edges/Roads. Click Download button (in "File to Download" Section) - respond to prompts In "Add Layer to Project" ... - select Black as "Label Outline color" - click Add Layer to Project button 5. Close GeoGateway form; perform mapping and analytical operations. The map view should now appear as shown below. The settings used in the GeoGateway tool were used to set the initial view of the block group layer (red boundary with yellow geocode) and census tract layer (blue boundary with white label). The address 1 Infinite Loop is located in block group 060855081013 (06-085-508101-3) and census tract 060855508101 (06-085-508101). Study Area with Block Groups and Census Tracts Layers 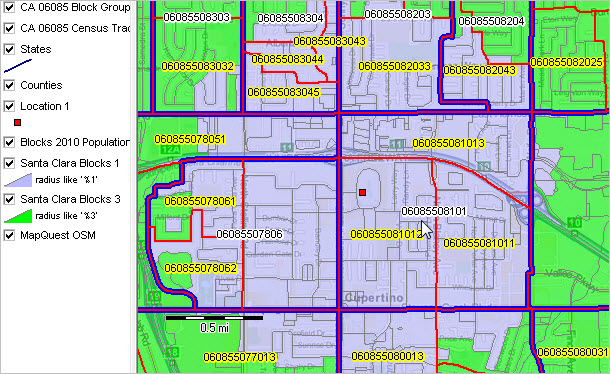 Use the Location-Based Demographics tool (LBD) with the default address (1 Infinite Loop, Cupertino, CA). See how these geocodes and demographic-economic characteristics for the above block group and census tract can be retrieved. Study Area with Block Groups, Census Tracts & Roads Layers Identify tool is used to click on road segment including 1 Infinite Loop. The tabular mini-profile shows selected attributes of the road segment. 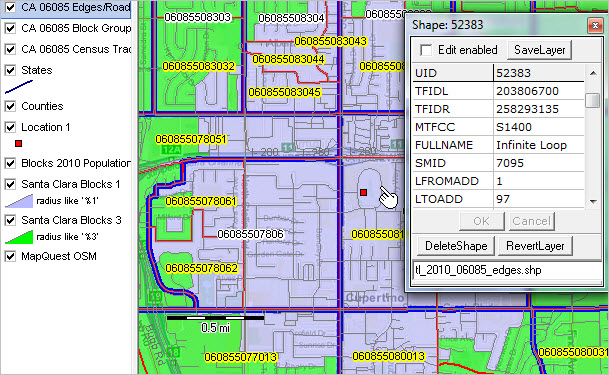 Creating Your Own Custom Maps To create your own custom maps, start at the top by opening the original base project. Navigate to a county/region of interest and proceed with steps outlined above for your county of interest. ProximityOne User Group Join the ProximityOne User Group to keep up-to-date with new developments relating to metros and component geography decision-making information resources. Receive updates and access to tools and resources available only to members. Use this form to join the User Group. Support Using these Resources Learn more about accessing and using demographic-economic data and related analytical tools. Join us in a Data Analytics Lab session. There is no fee for these one-hour Web sessions. Each informal session is focused on a specific topic. The open structure also provides for Q&A and discussion of application issues of interest to participants. Additional Information ProximityOne develops geographic-demographic-economic data and analytical tools and helps organizations knit together and use diverse data in a decision-making and analytical framework. We develop custom demographic/economic estimates and projections, develop geographic and geocoded address files, and assist with impact and geospatial analyses. Wide-ranging organizations use our tools (software, data, methodologies) to analyze their own data integrated with other data. Follow ProximityOne on Twitter at www.twitter.com/proximityone. Contact ProximityOne (888-364-7656) with questions about data covered in this section or to discuss custom estimates, projections or analyses for your areas of interest. |
|
|