
|
|
|
Academy Awards, Hollywood & Statistics
"Hollywood" thrives on statistics. Hollywood is more than a place, it is a central figure in the motion picture business and reflects something worldwide. Every week box office receipts are closely watched and often big news. The motion picture industry is big business and its activities and contributions are measured in many ways by Federal statistical agencies -- often the only source of data on key attributes of the industry. The motion picture industry is defined by type of business/NAICS category 5121. See a partial summary of business/economic data sources for that sector. As for the demographics of "Hollywood", the Census Bureau records a de facto history of the people that made Hollywood ... through the decennial census. 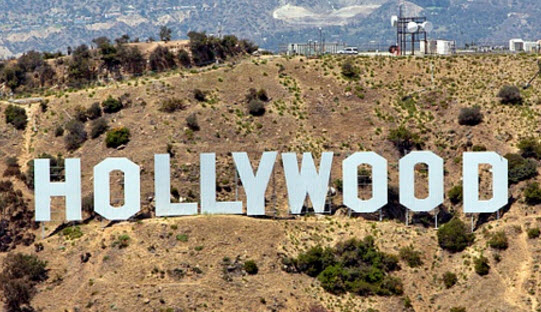 > >-- see about the Hollywood sign This section ties together some of these data about Hollywood, the Academy Awards, statistics and data used to build statistical data. Among other data, here we look at decennial census respondent data, like that of Katherine Hepburn -- read on to view more celebrity census respondent data. Attributes of these well known decennial census respondents (e.g., age, gender, race and related housing/household items) are merged together with other respondent data, like yours and mine, to develop summary statistics. This section draws substantially on data and information developed by the Census Bureau. On February 28, 2016, the Academy of Motion Picture Arts and Sciences hosts the 88th Academy Awards at the Dolby Theater in Los Angeles, CA (see Los Angeles city ACS 5-year demographic-economic characteristics, ACS 1-year demographic-economic characteristics). During the televised ceremony, the Academy will award Oscar trophies in 24 categories, including Best Actor, Best Actress, Best Picture, and Best Original Score. The Oscars will be attended by residents of the Los Angeles metro area (see profile) including Los Angeles County (see about age-gender patterns) and Orange County. About Hollywood There is not a California city named Hollywood; West Hollywood is the closest thing. The Oscars event is held in the city of Los Angeles. The location is shown in the following graphic (red marker) in context with West Hollywood and Beverly Hills (red boundaries). This map was developed using TIGER/Line city/places shapefile. 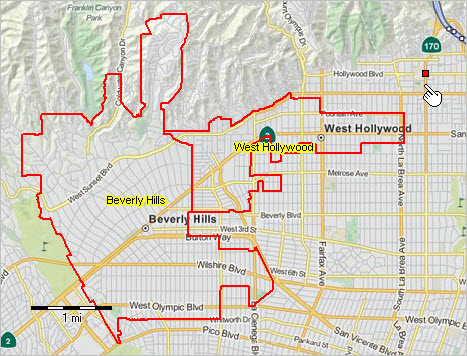 - view developed using CV XE GIS and related GIS project/datasets. Using data from the American Community Survey, we can view/analyze patterns of economic prosperity by ZIP code in the Beverly Hills area (red boundary). 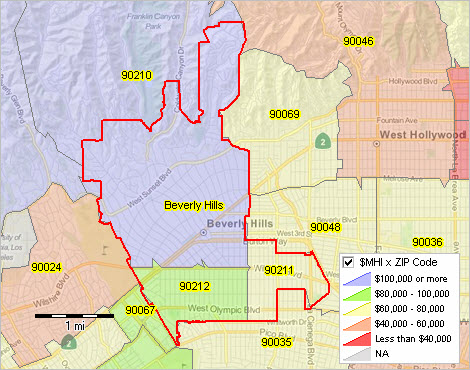 - view developed using CV XE GIS and related GIS project/datasets. More Subject Matter Detail: PUMAs. Develop custom estimates of actors and other occupations relevant to the motion picture industry using the American Community Survey Public Use Microdata Samples (PUMS). These individual population and housing respondent records enable you to develop estimates for areas with 100,000 population or more. Estimates may be developed for Public Use Microdata Areas (PUMAs). The area covered by West Hollywood and Beverly Hills is roughly equivalenced by PUMA 0603731. See map showing this area; PUMA 0603731 shown by blue boundary. Los Angeles County is subdivided into 69 PUMAs. K-12 Education. The Beverly Hills city is almost coterminous with Beverly Hills Unified School District (see BHUSD ACS 5-year demographic-economic characteristics and population pyramid). West Hollywood city is a part of the Los Angeles Unified School District (see LAUSD ACS 5-year demographic-economic characteristics, ACS 1-year demographic-economic characteristics and population pyramid. The Academy Awards & Data about Famous Celebrity Respondents -- based on data from the decennial censuses -- expand browser for best quality view of questionnaire respondent data (pdf) The first Academy Awards ceremony was held on May 16, 1929. Fifteen Oscar trophies honored the motion picture industry's actors, actresses, directors, and others for work in 1927-1928. In the years that followed, the addition of new categories honored actors and actresses in supporting roles (1936), visual effects (1939), costume design (1948), sound editing (1963), and animated feature (2001). Today the Academy Awards have evolved into a much anticipated event featuring some of the world's most beloved figures from the entertainment and fashion industries. Learn more about the ceremony and the industries it honors using data from the Census Bureau and other federal statistical agencies. Some details are summarized below. Data Confidentiality. Following the "72 year rule", pursuant to Public Law 95-416, census respondent data is held confidential for 72 years. Individual respondent data are released to the public by the National Archives and Records Administration (NARA) after 72 years. NARA released the 1930 census records in April 2002 and the 1940 census records on April 2, 2012. Individual respondent data show below is from the 1940 or earlier censuses. Louis B. Mayer, of Metro-Goldwyn-Mayer (MGM), founded the Academy of Motion Picture Arts and Sciences in 1927 to mediate labor disputes and improve the movie industry's image. The Academy's 36 founding members included actors Douglas Fairbanks, Harold Lloyd, and Mary Pickford; directors Cecil B. DeMille and Raoul Walsh; producers Harry and Jack Warner; and writers Bess Meredyth and Carey Wilson. In 1929—the year of the first Academy Awards ceremony—80 million tickets to hit films like Rio Rita starring Bebe Daniels, The Desert Song featuring music by Irving Berlin, and The Cocoanuts starring Groucho, Harpo, Chico, and Zeppo Marx earned $720 million. In 2015, Movie Web site Box Office Mojo reported that domestic audiences purchased 1.33 billion movie tickets for a total annual box office gross of approximately $11.1 billion. Soon after the founding of the Academy of Motion Picture Arts and Sciences, data from the 1930 Census showed that 93,804 people listed their occupation as actor, dancer, showmen, or athlete. In 1940, the number increased to 97,361. In May 2014, the U.S. Bureau of Labor Statistics reported that 69,400 people worked as actors, 20,100 were dancers or choreographers, 58,900 were film and video editors and camera operators, 64,400 were multimedia artists and animators, and 122,600 worked as producers and directors. The National Broadcasting Company (NBC) first televised the Academy Awards ceremony in 1953. In that year, 20.4 million American households owned a television. Since 1978, 98 percent or more of all American households reported owning at least one television. The 1959 film Ben-Hur, starring Charlton Heston, won a single-film record 11 Academy Awards. Since then, two movies—Titanic (1997) and The Lord of the Rings: The Return of the King (2003)—have tied that record. Walt Disney holds the men's record for most Academy Award wins with 22. Costume designer Edith Head holds the women's record with 8. Katherine Hepburn won the most Academy Awards for acting for her roles in Morning Glory (1933), Guess Who's Coming to Dinner (1967), The Lion in Winter (1968), and On Golden Pond (1981). John Ford is the most awarded director, winning for The Informer (1934), The Grapes of Wrath (1939), How Green Was My Valley (1940), and The Quiet Man (1951). For many, movies are not complete without popcorn. According to the U.S. Department of Agriculture, the census of agriculture found that 1,040 farms produced more than 785.7 million pounds of popcorn in 2012. Approximately 45 percent of the nation's popcorn is grown in Nebraska, followed by Indiana (19 percent), Illinois (12 percent), Ohio (11 percent), South Dakota (3.5 percent), and Iowa (2.4 percent). Hollywood Iconic Sign Real estate developer H.J. Whitley erected the Hollywood Sign in 1923. Situated on Mount Lee in the Santa Monica Mountains, the sign—originally reading "Hollywoodland"—advertised Whitley's housing development in the Hollywood area of Los Angeles, CA. Today, the sign is an iconic landmark symbolizing the state's entertainment industry. The following map view shows the sign location at the pointer near top of map in context with the Oscar's ceremony location shown by the red marker near the bottom of the map. Click graphic for larger view. 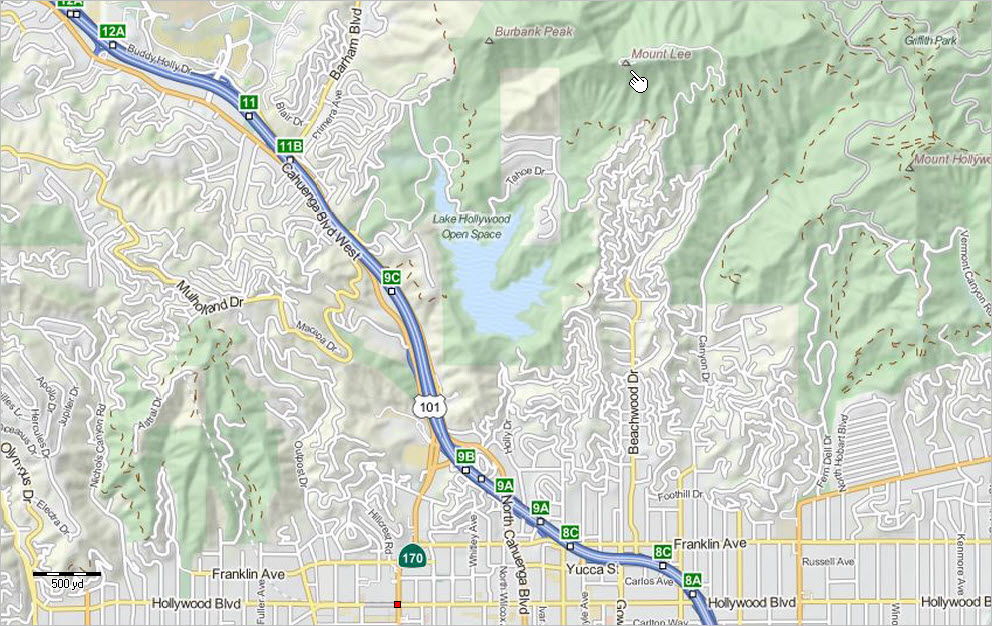 .. view developed with ProximityOne CV XE GIS and related GIS project. ProximityOne User Group Join the ProximityOne User Group to keep up-to-date with new developments relating to geographic, demographic, economic and business data. Receive updates and access to tools and resources available only to members. Use this form to join the User Group. Support Using these Resources Learn more about accessing and using demographic-economic data and related analytical tools. Join us in a Data Analytics Lab session. There is no fee for these one-hour Web sessions. Each informal session is focused on a specific topic. The open structure also provides for Q&A and discussion of application issues of interest to participants. Additional Information ProximityOne develops geodemographic-economic data and analytical tools and helps organizations knit together and use diverse data in a decision-making and analytical framework. We develop custom demographic/economic estimates and projections, develop geographic and geocoded address files, and assist with impact and geospatial analyses. Wide-ranging organizations use our tools (software, data, methodologies) to analyze their own data integrated with other data. Follow ProximityOne on Twitter at www.twitter.com/proximityone. Contact us (888-364-7656) with questions about data covered in this section or to discuss custom estimates, projections or analyses for your areas of interest. |
|
|