Proximity Home Page


PUMA 2010 Main

  Situation & Outlook
  - S&O Desktop
  - S&O Profiles|Reports
    > Comparative
    > Narrative
    > Site Analysis

  Related Sections
  - Applications Gallery
  - States
  - School Districts
  - Metros
  - Congressional District
  - Counties
  - Tracts/Neighborhoods
  - Block Groups
  - Census Blocks
  - ZIP Codes
  - Urban Areas

  Estimates-Projections
  - 2060 Demographic
    ... all county interactive table
  - 2030 Demographic-Economic
  - Single Year of Age

  GIS Thematic Mapping
    Visual Analysis Tools

  Ranking Tables
    National Scope
    Demographic Change
    2000-2010
  - States
  - Metros
  - Congressional District
  - School Districts
  - Counties
  - Cities/Places
  - Census Tracts
 
Florida Public Use Microdata Area (PUMA) Reference Maps
Decision-Making Information
  ProximityOne
  information resources & solutions
  (888) DMI-SOLN
  (888) 364-7656


Visual analysis with ProximityOne tools
click graphic for info; hover to pause

 
visually analyze clients/markets
site analysis using 1 mile radius

S1

$median household income
patterns by census tract - Houston

hover to pause

113th Congressional Districts

Click for info

US Asian Indian population 2010

Click for info

geocoded students and school
McKinney ISD, TX

Click for info

geocoded students and school
with tax parcels & streets

Click for info

high school attendance zones
with schools by type

Click for info

%high school graduates by
census tract - Puerto Rico

Click for info

Austin, TX MSA counties &
places 10K+ population markers

Click for info

Appalachia counties (green) &
coalfield counties (orange)

Click for info

China provinces percent urban &
cities (markers) by state plan

Click for info

Honolulu census tracts (red)
& census blocks


Central Park area NYC

Click for info

Kansas City Metro & Counties
Home Depot locations (markers)

Click for info

World Cities; focus on Spain

Click for info

PUMA Map Views by State

    Alabama
    Alaska
    Arizona
    Arkansas
    California
    Colorado
    Connecticut
    Delaware
    District of Columbia
    Florida
    Georgia
    Hawaii
    Idaho
    Illinois
    Indiana
    Iowa
    Kansas
    Kentucky
    Louisiana
    Maine
    Maryland
    Massachusetts
    Michigan
    Minnesota
    Mississippi
    Missouri
    Montana
    Nebraska
    Nevada
    New Hampshire
    New Jersey
    New Mexico
    New York
    North Carolina
    North Dakota
    Ohio
    Oklahoma
    Oregon
    Pennsylvania
    Rhode Island
    South Carolina
    South Dakota
    Tennessee
    Texas
    Utah
    Vermont
    Virginia
    Washington
    West Virginia
    Wisconsin
    Wyoming
    Puerto Rico

Public Use Microdata Areas (PUMAs) provide most detailed U.S. wall-to-wall geography (2,378 areas) for which current year demographic-economic data are available. The 2010 vintage PUMAs will be used throughout the 2010s with annually updated demographic-economic data. This section provides 2010 vintage reference maps for Florida.

PUMA Demographic-Economic Characteristics
View, rank, compare ACS 2012 data for these PUMAs:
  General Demographics .. Social Characteristics .. Economic Characteristics .. Housing Characteristics

Maps shown in this section depict 2010 vintage PUMAs with red boundaries and PUMA codes as yellow labels. The maps have been developed using the CV XE GIS software and show the PUMA shapefile boundaries in context of an MapQuest OpenStreetMap tile layer. Install CV XE GIS on your computer to view PUMA thematic pattern maps and add other layers to the views such as census tracts and city/place boundaries.

These maps might be most effectively used on a device such as iPad that supports easy scrolling and gesture zoom-in/out/pan. Use the map graphical views in combination with tabular PUMA list/component views and interactive query tools located at http://proximityone.com/puma2010.htm. Codes displayed in the maps are 5-digit PUMA codes unique to this state. The PUMA GEOID code (7-character), unique nationally, is comprised of the state FIPS code plus 5-digit PUMA code. Codes always include lead zeroes.

Select views for other states using the links provided at right.

Florida


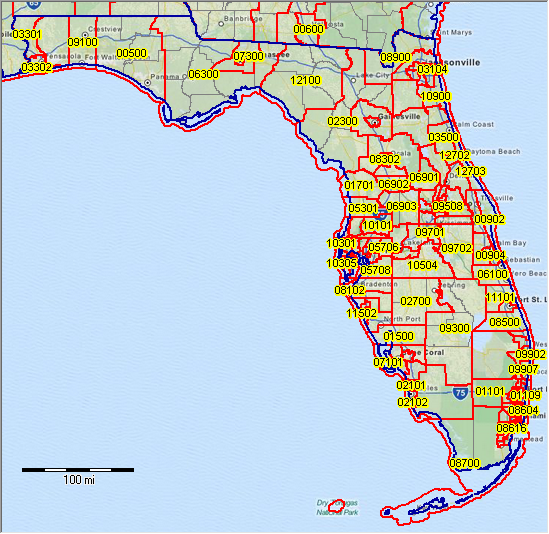
Fort Lauderdale Area Zoom-in


Fort Myers Area Zoom-in


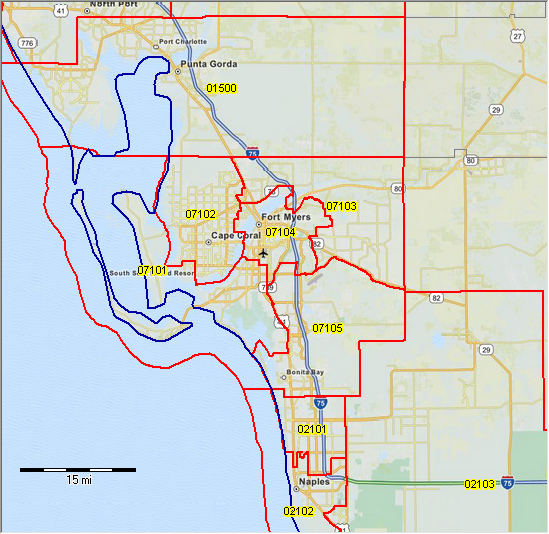
Gainesville Area Zoom-in


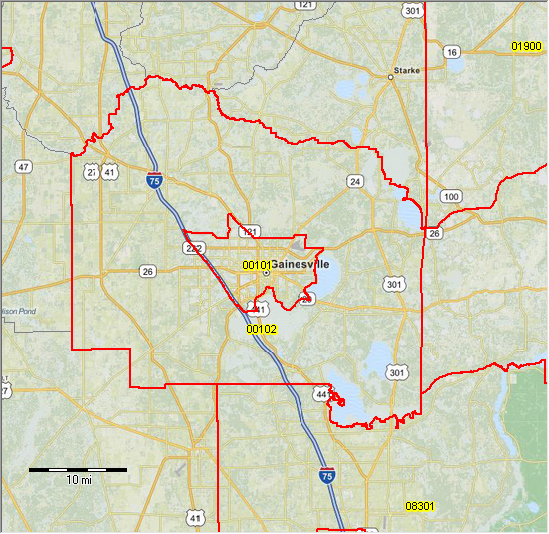
Homestead Myers Area Zoom-in


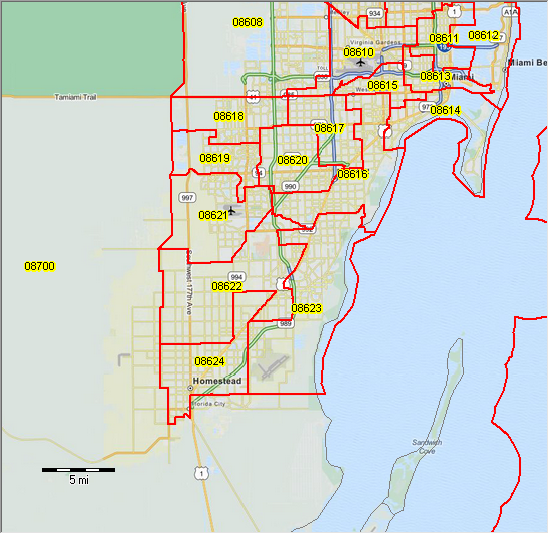
Jacksonville Area Zoom-in


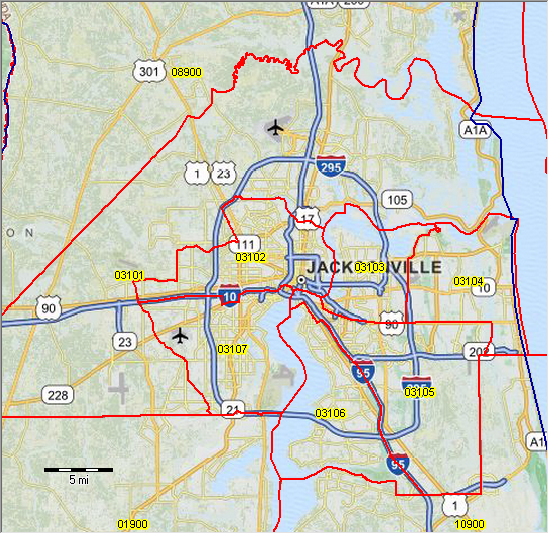
Miami Beach Area Zoom-in


Palm Beach Area Zoom-in
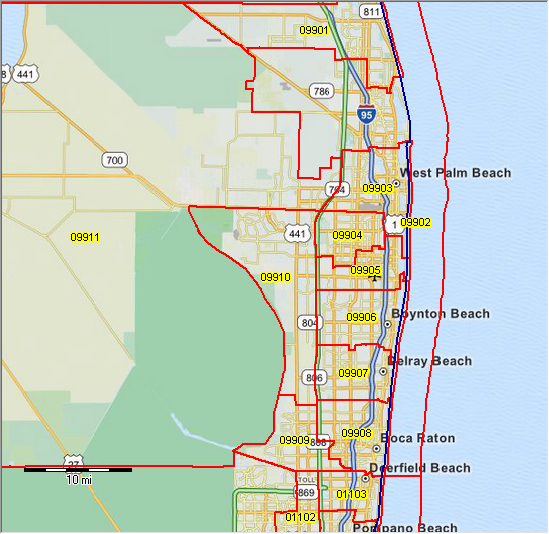

Tampa Area Zoom-in


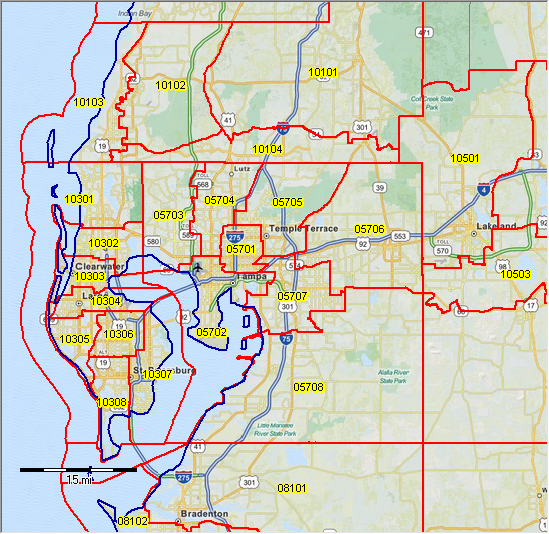
Additional Information
ProximityOne develops geographic-demographic-economic data and analytical tools and helps organizations knit together and use diverse data in a decision-making and analytical framework. We develop custom demographic/economic estimates and projections, develop geographic and geocoded address files, and assist with impact and geospatial analyses. Wide-ranging organizations use our tools (software, data, methodologies) to analyze their own data integrated with other data. Follow ProximityOne on Twitter at www.twitter.com/proximityone. Contact ProximityOne (888-364-7656) with questions about data covered in this section or to discuss custom estimates, projections or analyses for your areas of interest.


Copyright © . Proximity. All Rights Reserved.
Sitemap | Contact Us | News