Proximity Home Page


PUMS Data

  Situation & Outlook
  - S&O Desktop
  - S&O Profiles|Reports
    > Comparative
    > Narrative
    > Site Analysis

  Related Sections
  - Applications Gallery
  - States
  - School Districts
  - Metros
  - Congressional District
  - Counties
  - Tracts/Neighborhoods
  - Block Groups
  - Census Blocks
  - ZIP Codes
  - Urban Areas

  Estimates-Projections
  - 2060 Demographic
    ... all county interactive table
  - 2030 Demographic-Economic
  - Single Year of Age

  GIS Thematic Mapping
    Visual Analysis Tools

  Ranking Tables
    National Scope
    Demographic Change
    2000-2010
  - States
  - Metros
  - Congressional District
  - School Districts
  - Counties
  - Cities/Places
  - Census Tracts
 
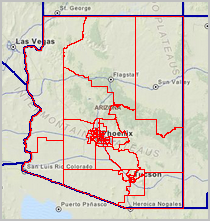
Census 2000 Public Use Microdata Areas (PUMAs)
  -- using Census 2000 PUMA boundaries/shapefiles
Decision-Making Information
  ProximityOne
  information resources & solutions
  (888) DMI-SOLN
  (888) 364-7656


Visual analysis with ProximityOne tools
click graphic for info; hover to pause

 
visually analyze clients/markets
site analysis using 1 mile radius

S1

$median household income
patterns by census tract - Houston

hover to pause

113th Congressional Districts

Click for info

US Asian Indian population 2010

Click for info

geocoded students and school
McKinney ISD, TX

Click for info

geocoded students and school
with tax parcels & streets

Click for info

high school attendance zones
with schools by type

Click for info

%high school graduates by
census tract - Puerto Rico

Click for info

Austin, TX MSA counties &
places 10K+ population markers

Click for info

Appalachia counties (green) &
coalfield counties (orange)

Click for info

China provinces percent urban &
cities (markers) by state plan

Click for info

Honolulu census tracts (red)
& census blocks


Central Park area NYC

Click for info

Kansas City Metro & Counties
Home Depot locations (markers)

Click for info

World Cities; focus on Spain

Click for info

Arizona 2010 PUMAs
click for larger & more detailed views


Public Use Microdata Areas (PUMAs) provide most detailed U.S. wall-to-wall geography for which custom-defined demographic estimates can be developed using Public Use Microdata Sample (PUMS) data. More about PUMS. Summary statistics are also tabulated for PUMAs for selected statistical programs.

Census 2000 5-percent Public Use Microdata Area (PUMA) boundaries and shapefiles are used with Census 2000 Public Use Microdata Sample (PUMS) and American Community Survey (ACS) 2011 and earlier years. Starting with ACS 2012, the 2010 vintage PUMAs are used.

2010 PUMAs. See the following related sections:
  • Public Use Microdata Areas -- Census 2010
  • Public Use Microdata Samples
  • Install CV XE GIS to access and use 2000 & 2010 PUMA shapefiles
  • Use CV XE Crosstabs to:
      - create custom estimates using PUMS data
      - save custom estimates into shapefile structure for pattern analysis/thematic mapping

Additional Information
ProximityOne develops geographic-demographic-economic data and analytical tools and helps organizations knit together and use diverse data in a decision-making and analytical framework. We develop custom demographic/economic estimates and projections, develop geographic and geocoded address files, and assist with impact and geospatial analyses. Wide-ranging organizations use our tools (software, data, methodologies) to analyze their own data integrated with other data. Follow ProximityOne on Twitter at www.twitter.com/proximityone. Contact ProximityOne (888-364-7656) with questions about data covered in this section or to discuss custom estimates, projections or analyses for your areas of interest.


Copyright © . Proximity. All Rights Reserved.
Sitemap | Contact Us | News