
|
|
Largest School Districts -- characteristics & trends among the largest 100 school districts -- expanding insights through data analytics
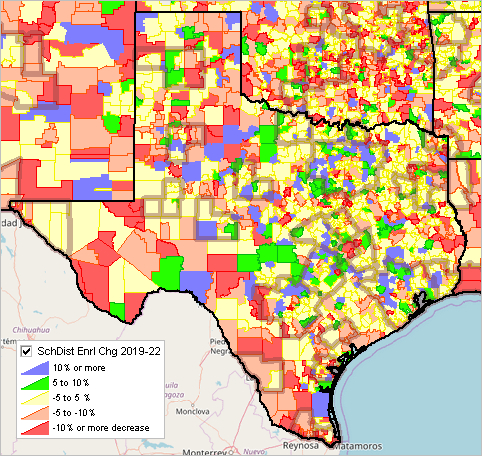
.. this section provides tools and data to examine characteristics of the 100 largest school districts for the 2018-19 and 2021-22 school years and change over time. These data are based on enrollment data reported by school districts and released by NCES in December 2022. See about school districts/local education agencies number and type below. In the aggregate, enrollment changed from 10.7 to 10.3 million among these districts, a ~420,000 enrollment decrease. The year 2018-19 was chosen to avoid pandemic impact; the 2021-22 data are the most recent data available for all districts. Many of these districts are whole county equivalents which cause them to cluster is some states. Yet the group includes 23 districts in Texas. One reason to choose the largest districts was to examine 2021 ACS 1-year demographic-economic estimates. See this example of a detailed profile for Clark County School District, NV (Las Vegas). This requires the population to be 65,000 or more (62 districts). All districts included in the largest 100 have 2021-22 enrollment of 47,000 or more. • View, sort, rank, query districts using the interactive table below. • Use VDA Web GIS to examine characteristics of all school districts. Patterns of Enrollment Change by School District.. goto top The following graphic shows patterns of 2018-19 to 2021-22 school year percent enrollment change by school district for the Texas region. Create similar thematic pattern maps using the VDA Web GIS .. for anywhere in the U.S. Use VDA Web GIS to develop a similar view for any district or region of interest. Metros are shown in the map graphic as an overlay with semi-transparent bold boundary.  .. click graphic for larger view. Largest Schoool Districts, 2018-19 - 2021-22 Interactive Table .. goto top Initial view shows districts ranked in descending order on 2021-22 elrollment. Click column header to sort; click again to sort other direction. See related Interactive Tables Page Using the Interactive Table Columns/Subject Matter Items From NCES CCD 2022 - Name - St - LEAID - Enrollment 2018-19 - Enrollment 2021-22 - Enrollment Change 2019-22 - Enrollment %Change 2019-22 From Census SAIPE 2021 Estimates (for use in Title I Allocations) - Total Population 2021 - Population Age 5-17 2021 - Population Age 5-17 in Poverty 2021 - Population Age 5-17 %in Poverty 2021 Local Education Agencies by Type; CCD 2021-22 .. goto top There were 19,713 local education agencies (LEAs) included in the 2021-22 CCD datatase. The number and type of LEAs are shown in the following table.
A supervisory union is an education agency where administrative services are performed for more than one school district by a common superintendent. Local Education Agencies by Level; CCD 2021-22 .. goto top
ProximityOne User Group Join the ProximityOne User Group to keep up-to-date with new developments relating to metros and component geography decision-making information resources. Receive updates and access to tools and resources available only to members. Use this form to join the User Group. Support Using these Resources Learn more about small area demographic-economic characteristics, ZIP code geographic drill-down and related analytical tools. Join us in a Data Analytics Lab Session. There is no fee for these one-hour Web sessions. Each informal session is focused on a specific topic. The open structure also provides for Q&A and discussion of application issues of interest to participants. Additional Information ProximityOne develops geographic-demographic-economic data and analytical tools and helps organizations knit together and use diverse data in a decision-making and analytical framework. We develop custom demographic/economic estimates and projections, develop geographic and geocoded address files, and assist with impact and geospatial analyses. Wide-ranging organizations use our tools (software, data, methodologies) to analyze their own data integrated with other data. Follow ProximityOne on Twitter at www.twitter.com/proximityone. Contact ProximityOne (888-364-7656) with questions about data covered in this section or to discuss custom estimates, projections or analyses for your areas of interest. |
|
|