
| Decision-Making Information |
|
ProximityOne information resources & solutions (888) DMI-SOLN (888) 364-7656 Put data to work more effectively. Certificate in Data Analytics Power of Combining Maps with Data Support & Technical Assistance help using these resources Metro in Regional Context 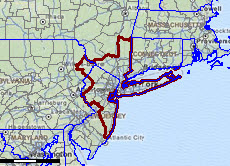 |
Situation & Outlook Report
New York-Newark-Jersey City, NY-NJ-PA Metropolitan Statistical Area (CBSA 35620)
Geographic-Demographic-Economic Characteristics -- access other areas
See about updates.
This section is no longer being updated. Access the permanent replacement section at http://proximityone.com/cbsa/1/cbsa35620.htm. Please bookmark this new URL.
Access 2018 S&O Reports, featuring county and metro projections to 2030, via the interactive table at http://proximityone.com/metros.htm. The 2018 reports are similar but have been greatly expanded and updated.
Contents of this Report
This document is organized into these sections:
1. Recent Trends & Outlook
Summary of recent business, demographic, economic trends; year-ahead & 5-year outlook.
- the Recent Trends & Outlook section, updated quarterly, covers topics about this metro such as .. assessing the implications of next jobs report .. impact of Fed''s interest rate action .. which sectors are expanding or contracting .. housing market conditions .. insights to help your planning and decision-making. The Recent Trends & Outlook section is available in the subscription edition.
2. Overview & Update
The total population of the New York-Newark-Jersey City, NY-NJ-PA MSA metro changed from 19,601,147 in 2010 to 20,095,119 in 2015, a change of 581,158 (3%). Among all 917 metros, this metro was ranked number 1 in 2010 and 1 in 2015, based on total population. Annual net migration was 40,493 (2011), 3,559 (2012), 29,020 (2013), -4,470 (2014), -4,470 (2015). View annual population estimates and components of change table. See more about population characteristics below.
This metro is projected to have a total population in 2020 of 21,577,028. The projected population change from 2010 to 2020 is 1,977,494 (10.1%). The population ages 65 years and over is projected to change from 2,631,993 (2010) to 3,872,892 (2020), a change of 1,240,899 (47.1%). See more about population projections.
Based on per capita personal income (PCPI), this metro was ranked number 19 in 2008 and 20 in 2014. among the 917 metros for which personal income was estimated.The PCPI changed from $55,231 in 2008 to $61,440 in 2014, a change of $6,209 (11.2%). Per capita personal income (PCPI) is a comprehensive measure of individual economic well-being. Use the interactive table to compare PCPI in this metro to other metros. See more about PCPI in Economic Characteristics section below.
282 metropolitan statistical areas, of the total 381, experienced an increase in real Gross Domestic Product (GDP) between 2009 and 2014. This metro ranked number 1 among the 381 metros based on 2014 GDP. The GDP (millions of current dollars) changed from $1,276,750 in 2009 to $1,558,518 in 2014 a change of $281,768 (22.07%). Real GDP (millions of real, inflation adjusted, dollars) changed from $1,276,750 in 2009 to $1,423,173 in 2014, a change of $146,423 (11.47%). GDP is the most comprehensive measure of metro economic activity. GDP is the sum of the GDP originating in all industries in the metro. See more about GDP in Economic Characteristics section below.
Attributes of driil-down, small area geography within the metro ... metros account for 65,744 of the national scope 73,056 census tracts (others are in non-metro areas). This metro is comprised of 4,700 tracts covering the metro wall-to-wall. View, rank, compare demographic-economic attributes of these tracts using the interactive tables. Use the CBSA code 35620; see table usage details below the table.
Fortune 1000 Companies with headquarters in this metro.
• ABM Industries Incorporated
• ANN INC.
• AOL Inc.
• Aeropostale, Inc.
• Alcoa Inc.
• Alleghany Corporation
• AmTrust Financial Services, Inc.
• American Express Company
• American International Group
• Annaly Capital Management, Inc.
• Apollo Global Management, LLC
• Ascena Retail Group, Inc.
• Assurant, Inc.
• Automatic Data Processing, Inc.
• Avis Budget Group, Inc.
• Avon Products, Inc.
• BGC Partners, Inc.
• Barnes & Noble, Inc.
• Becton, Dickinson and Company
• Bed Bath & Beyond Inc.
• BlackRock, Inc.
• Bristol-Myers Squibb Company
• Broadridge Financial Solutions, Inc.
• C.R. Bard, Inc.
• CA, Inc.
• CBS Corporation
• CIT Group Inc.
• Cablevision Systems Corporation
• Celgene Corporation
• Citigroup
• Coach, Inc.
• Cognizant Technology Solutions Corporation
• Colgate-Palmolive Company
• Consolidated Edison, Inc.
• Coty Inc.
• Cytec Industries Inc.
• E*Trade Financial Corporation
• Foot Locker, Inc.
• Forest Laboratories, Inc.
• Guardian Life Ins. Co. of America
• Harbinger Group Inc.
• Henry Schein, Inc.
• Hertz Global Holdings, Inc.
• Hess Corporation
• Honeywell International Inc.
• IAC/InterActiveCorp
• INTL FCStone Inc.
• ITT Corporation
• Icahn Enterprises L.P.
• International Business Machines
• International Flavors & Fragrances Inc.
• J. Crew Group, Inc.
• J.P. Morgan Chase & Co.
• JetBlue Airways Corporation
• KKR & Co. L.P.
• L-3 Communications Holdings, Inc.
• Leucadia National Corporation
• Loews Corporation
• MSC Industrial Direct Co., Inc.
• Marsh & McLennan Companies, Inc.
• MasterCard Incorporated
• McGraw Hill Financial, Inc.
• Merck & Co., Inc.
• MetLife
• Moody's Corporation
• Morgan Stanley
• Mutual of America Life Insurance Company
• NBTY, Inc.
• New Jersey Resources Corporation
• New York Community Bancorp, Inc.
• New York Life Insurance Company
• Omnicom Group Inc.
• PBF Energy Inc.
• PVH Corp.
• Pall Corporation
• Party City Holdings Inc.
• PepsiCo
• Pfizer
• Philip Morris International Inc.
• Pinnacle Foods Inc.
• Prudential Financial, Inc.
• Public Service Enterprise Group Incorporated
• Quest Diagnostics Incorporated
• Ralph Lauren Corporation
• Realogy Holdings Corp.
• Regeneron Pharmaceuticals, Inc.
• Sealed Air Corporation
• Selective Insurance Group, Inc.
• Systemax Inc.
• TIAA-CREF
• The Bank of New York Mellon Corporation
• The Blackstone Group L.P.
• The Chubb Corporation
• The Estee Lauder Companies Inc.
• The Goldman Sachs Group, Inc.
• The Interpublic Group of Companies, Inc.
• The Jones Group Inc.
• The NASDAQ OMX Group, Inc.
• The Travelers Companies, Inc.
• Tiffany & Co.
• Time Warner Cable Inc.
• Time Warner Inc.
• Towers Watson & Co.
• Toys "R" Us, Inc.
• Twenty-First Century Fox, Inc.
• Universal American Corp.
• Univision Communications Inc.
• Verizon Communications
• Viacom Inc.
• Volt Information Sciences, Inc.
• Vornado Realty Trust
• WABCO Holdings Inc.
• Warner Music Group Corp.
• Wyndham Worldwide Corporation
• Xylem Inc.
Number in this metro: 115. Extended data & analysis in subscription edition.• ANN INC.
• AOL Inc.
• Aeropostale, Inc.
• Alcoa Inc.
• Alleghany Corporation
• AmTrust Financial Services, Inc.
• American Express Company
• American International Group
• Annaly Capital Management, Inc.
• Apollo Global Management, LLC
• Ascena Retail Group, Inc.
• Assurant, Inc.
• Automatic Data Processing, Inc.
• Avis Budget Group, Inc.
• Avon Products, Inc.
• BGC Partners, Inc.
• Barnes & Noble, Inc.
• Becton, Dickinson and Company
• Bed Bath & Beyond Inc.
• BlackRock, Inc.
• Bristol-Myers Squibb Company
• Broadridge Financial Solutions, Inc.
• C.R. Bard, Inc.
• CA, Inc.
• CBS Corporation
• CIT Group Inc.
• Cablevision Systems Corporation
• Celgene Corporation
• Citigroup
• Coach, Inc.
• Cognizant Technology Solutions Corporation
• Colgate-Palmolive Company
• Consolidated Edison, Inc.
• Coty Inc.
• Cytec Industries Inc.
• E*Trade Financial Corporation
• Foot Locker, Inc.
• Forest Laboratories, Inc.
• Guardian Life Ins. Co. of America
• Harbinger Group Inc.
• Henry Schein, Inc.
• Hertz Global Holdings, Inc.
• Hess Corporation
• Honeywell International Inc.
• IAC/InterActiveCorp
• INTL FCStone Inc.
• ITT Corporation
• Icahn Enterprises L.P.
• International Business Machines
• International Flavors & Fragrances Inc.
• J. Crew Group, Inc.
• J.P. Morgan Chase & Co.
• JetBlue Airways Corporation
• KKR & Co. L.P.
• L-3 Communications Holdings, Inc.
• Leucadia National Corporation
• Loews Corporation
• MSC Industrial Direct Co., Inc.
• Marsh & McLennan Companies, Inc.
• MasterCard Incorporated
• McGraw Hill Financial, Inc.
• Merck & Co., Inc.
• MetLife
• Moody's Corporation
• Morgan Stanley
• Mutual of America Life Insurance Company
• NBTY, Inc.
• New Jersey Resources Corporation
• New York Community Bancorp, Inc.
• New York Life Insurance Company
• Omnicom Group Inc.
• PBF Energy Inc.
• PVH Corp.
• Pall Corporation
• Party City Holdings Inc.
• PepsiCo
• Pfizer
• Philip Morris International Inc.
• Pinnacle Foods Inc.
• Prudential Financial, Inc.
• Public Service Enterprise Group Incorporated
• Quest Diagnostics Incorporated
• Ralph Lauren Corporation
• Realogy Holdings Corp.
• Regeneron Pharmaceuticals, Inc.
• Sealed Air Corporation
• Selective Insurance Group, Inc.
• Systemax Inc.
• TIAA-CREF
• The Bank of New York Mellon Corporation
• The Blackstone Group L.P.
• The Chubb Corporation
• The Estee Lauder Companies Inc.
• The Goldman Sachs Group, Inc.
• The Interpublic Group of Companies, Inc.
• The Jones Group Inc.
• The NASDAQ OMX Group, Inc.
• The Travelers Companies, Inc.
• Tiffany & Co.
• Time Warner Cable Inc.
• Time Warner Inc.
• Towers Watson & Co.
• Toys "R" Us, Inc.
• Twenty-First Century Fox, Inc.
• Universal American Corp.
• Univision Communications Inc.
• Verizon Communications
• Viacom Inc.
• Volt Information Sciences, Inc.
• Vornado Realty Trust
• WABCO Holdings Inc.
• Warner Music Group Corp.
• Wyndham Worldwide Corporation
• Xylem Inc.
3. Lay of the Land & Neighborhood Patterns of Economic Prosperity go top
3.1. Lay of the Land go top
Lay of the Land. The following map shows the metro with bold boundary.
Counties are labeled with county name and state-county FIPS code.
View developed with CV XE GIS software. See this section to learn about making custom metro maps.
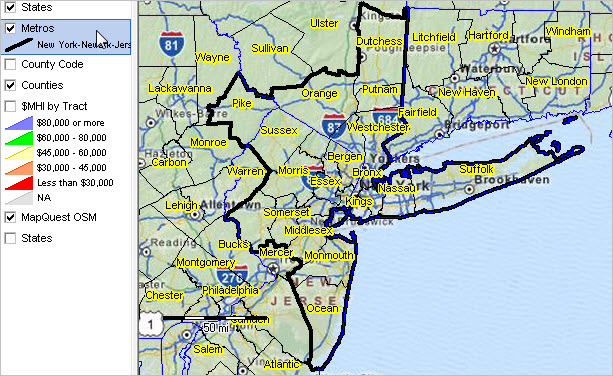
3.2. Patterns of Economic Prosperity by Neighborhood go top
Median household income by census tract (see color/data legend at left of map).
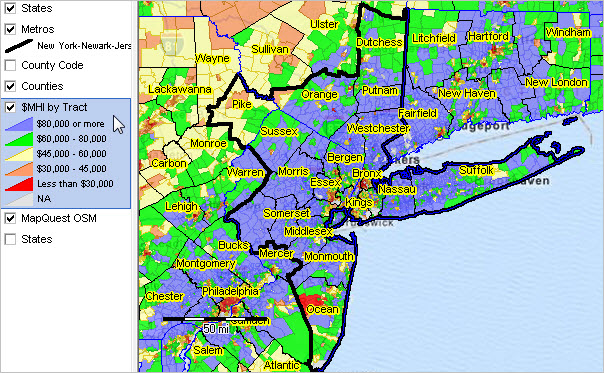
View developed with CV XE GIS software. See this section to learn about making custom metro maps.
4. Population Characteristics & Trends go top
Updated monthly, quarterly, annually. Housing market conditions and extended detail Available in subscription edition.
4.1. Component City Characteristics go top
Principal Cities (about principal cities); Click link to view city profile.
• Jersey City
• Lakewood
• New Brunswick
• New York
• Newark
• White Plains
Cities 10,000 population and over; click link to view city profile.
| Area | Census 2010 | July 1 2010 | July 1 2011 | July 1 2012 | July 1 2013 | July 1 2014 | Change 2010-14 | %Change 2010-14 |
| Asbury Park, NJ (3401960) | 16,116 | 16,115 | 15,976 | 15,878 | 15,854 | 15,778 | -337 | -2.10 |
| Babylon, NY (3603408) | 12,166 | 12,181 | 12,208 | 12,186 | 12,185 | 12,172 | -9 | -0.10 |
| Bayonne, NJ (3403580) | 63,024 | 63,165 | 64,212 | 64,802 | 65,556 | 65,975 | 2,810 | 4.40 |
| Beachwood, NJ (3404180) | 11,045 | 11,068 | 11,069 | 11,102 | 11,173 | 11,253 | 185 | 1.70 |
| Beacon, NY (3605100) | 15,541 | 14,634 | 14,555 | 14,444 | 14,293 | 14,238 | -396 | -2.70 |
| Bergenfield, NJ (3405170) | 26,764 | 26,882 | 27,060 | 27,165 | 27,300 | 27,406 | 524 | 1.90 |
| Bound Brook, NJ (3406790) | 10,402 | 10,421 | 10,479 | 10,520 | 10,511 | 11,116 | 695 | 6.70 |
| Carteret, NJ (3410750) | 22,844 | 23,098 | 23,724 | 23,902 | 24,042 | 24,114 | 1,016 | 4.40 |
| Cliffside Park, NJ (3413570) | 23,594 | 23,624 | 23,790 | 24,488 | 25,257 | 25,503 | 1,879 | 8.00 |
| Clifton, NJ (3413690) | 84,136 | 84,188 | 84,792 | 85,100 | 85,582 | 85,927 | 1,739 | 2.10 |
| Dobbs Ferry, NY (3620698) | 10,875 | 10,887 | 10,959 | 10,989 | 11,069 | 11,098 | 211 | 1.90 |
| Dover, NJ (3418070) | 18,157 | 18,156 | 18,261 | 18,318 | 18,375 | 18,313 | 157 | 0.90 |
| Dumont, NJ (3418400) | 17,479 | 17,510 | 17,633 | 17,703 | 17,789 | 17,863 | 353 | 2.00 |
| East Orange, NJ (3419390) | 64,270 | 64,120 | 64,403 | 64,409 | 64,743 | 65,078 | 958 | 1.50 |
| Eatontown, NJ (3419840) | 12,709 | 12,493 | 12,354 | 12,289 | 12,261 | 12,257 | -236 | -1.90 |
| Edgewater, NJ (3420020) | 11,513 | 11,530 | 11,699 | 12,009 | 12,297 | 12,343 | 813 | 7.10 |
| Elizabeth, NJ (3421000) | 124,969 | 125,274 | 126,063 | 126,933 | 127,880 | 128,705 | 3,431 | 2.70 |
| Elmwood Park, NJ (3421300) | 19,403 | 19,439 | 19,586 | 20,033 | 20,128 | 20,374 | 935 | 4.80 |
| Englewood, NJ (3421480) | 27,147 | 27,162 | 27,344 | 27,430 | 27,562 | 27,670 | 508 | 1.90 |
| Fair Lawn, NJ (3422470) | 32,457 | 32,505 | 32,766 | 32,896 | 33,057 | 33,549 | 1,044 | 3.20 |
| Fairview, NJ (3422560) | 13,835 | 13,874 | 13,969 | 14,183 | 14,262 | 14,317 | 443 | 3.20 |
| Floral Park, NY (3626264) | 15,863 | 15,879 | 15,918 | 15,930 | 15,951 | 15,967 | 88 | 0.60 |
| Florham Park, NJ (3423910) | 11,696 | 11,739 | 11,795 | 11,863 | 11,864 | 11,829 | 90 | 0.80 |
| Fort Lee, NJ (3424420) | 35,345 | 35,392 | 35,664 | 35,841 | 36,310 | 37,026 | 1,634 | 4.60 |
| Franklin Lakes, NJ (3424990) | 10,590 | 10,603 | 10,687 | 10,735 | 10,782 | 10,837 | 234 | 2.20 |
| Freehold, NJ (3425200) | 12,052 | 12,064 | 12,041 | 12,013 | 12,013 | 11,973 | -91 | -0.80 |
| Freeport, NY (3627485) | 42,860 | 42,910 | 43,118 | 43,178 | 43,255 | 43,304 | 394 | 0.90 |
| Garden City, NY (3628178) | 22,371 | 22,387 | 22,535 | 22,571 | 22,593 | 22,616 | 229 | 1.00 |
| Garfield, NJ (3425770) | 30,487 | 30,535 | 30,772 | 30,971 | 31,252 | 31,486 | 951 | 3.10 |
| Glen Cove, NY (3629113) | 26,964 | 26,996 | 27,109 | 27,169 | 27,255 | 27,314 | 318 | 1.20 |
| Glen Rock, NJ (3426640) | 11,601 | 11,618 | 11,700 | 11,797 | 11,860 | 11,901 | 283 | 2.40 |
| Guttenberg, NJ (3428650) | 11,176 | 11,196 | 11,357 | 11,453 | 11,487 | 11,481 | 285 | 2.50 |
| Hackensack, NJ (3428680) | 43,010 | 43,197 | 43,477 | 44,109 | 44,309 | 44,519 | 1,322 | 3.10 |
| Harrison, NJ (3430210) | 13,620 | 13,651 | 13,883 | 13,993 | 15,310 | 15,376 | 1,725 | 12.60 |
| Harrison, NY (3632402) | 27,472 | 27,513 | 27,676 | 27,815 | 27,990 | 28,151 | 638 | 2.30 |
| Hasbrouck Heights, NJ (3430420) | 11,842 | 11,854 | 11,933 | 11,975 | 12,044 | 12,147 | 293 | 2.50 |
| Haverstraw, NY (3632754) | 11,910 | 11,933 | 12,011 | 12,042 | 12,120 | 12,172 | 239 | 2.00 |
| Hawthorne, NJ (3430570) | 18,791 | 18,803 | 18,926 | 18,976 | 19,030 | 19,048 | 245 | 1.30 |
| Hempstead, NY (3633139) | 53,891 | 53,951 | 54,113 | 54,934 | 55,465 | 55,527 | 1,576 | 2.90 |
| Highland Park, NJ (3431470) | 13,982 | 13,994 | 14,071 | 14,304 | 14,392 | 14,436 | 442 | 3.20 |
| Hillsdale, NJ (3431920) | 10,219 | 10,238 | 10,351 | 10,384 | 10,443 | 10,482 | 244 | 2.40 |
| Hoboken, NJ (3432250) | 50,005 | 50,117 | 51,330 | 52,295 | 52,837 | 53,312 | 3,195 | 6.40 |
| Hopatcong, NJ (3432910) | 15,147 | 15,136 | 15,046 | 14,934 | 14,782 | 14,684 | -452 | -3.00 |
| Jersey City, NJ (3436000) | 247,597 | 248,714 | 253,117 | 256,681 | 258,662 | 262,146 | 13,432 | 5.40 |
| Keansburg, NJ (3436480) | 10,105 | 10,103 | 10,057 | 10,019 | 10,016 | 9,872 | -231 | -2.30 |
| Kearny, NJ (3436510) | 40,684 | 40,767 | 41,400 | 41,770 | 41,867 | 41,837 | 1,070 | 2.60 |
| Kinnelon, NJ (3437110) | 10,248 | 10,256 | 10,327 | 10,375 | 10,405 | 10,381 | 125 | 1.20 |
| Kiryas Joel, NY (3639853) | 20,175 | 20,208 | 20,437 | 21,315 | 21,832 | 22,246 | 2,038 | 10.10 |
| Lake Grove, NY (3640530) | 11,163 | 11,205 | 11,243 | 11,237 | 11,251 | 11,241 | 36 | 0.30 |
| Lincoln Park, NJ (3440290) | 10,521 | 10,526 | 10,549 | 10,539 | 10,475 | 10,482 | -44 | -0.40 |
| Linden, NJ (3440350) | 40,499 | 40,584 | 40,650 | 40,947 | 41,393 | 41,651 | 1,067 | 2.60 |
| Lindenhurst, NY (3642554) | 27,253 | 27,266 | 27,332 | 27,291 | 27,351 | 27,321 | 55 | 0.20 |
| Little Ferry, NJ (3440680) | 10,626 | 10,650 | 10,728 | 10,771 | 10,825 | 10,866 | 216 | 2.00 |
| Lodi, NJ (3441100) | 24,136 | 24,174 | 24,339 | 24,440 | 24,566 | 24,654 | 480 | 2.00 |
| Long Beach, NY (3643335) | 33,275 | 33,318 | 33,463 | 33,503 | 33,594 | 33,664 | 346 | 1.00 |
| Long Branch, NJ (3441310) | 30,719 | 30,732 | 30,647 | 30,531 | 30,522 | 30,522 | -210 | -0.70 |
| Lynbrook, NY (3643874) | 19,427 | 19,449 | 19,500 | 19,521 | 19,548 | 19,558 | 109 | 0.60 |
| Madison, NJ (3442510) | 15,845 | 15,829 | 15,966 | 16,092 | 16,253 | 16,122 | 293 | 1.90 |
| Mamaroneck, NY (3644831) | 18,929 | 18,953 | 19,069 | 19,114 | 19,261 | 19,302 | 349 | 1.80 |
| Manville, NJ (3443620) | 10,344 | 10,363 | 10,426 | 10,454 | 10,448 | 10,388 | 25 | 0.20 |
| Massapequa Park, NY (3645997) | 17,008 | 17,034 | 17,104 | 17,138 | 17,178 | 17,206 | 172 | 1.00 |
| Metuchen, NJ (3445690) | 13,574 | 13,580 | 13,666 | 13,721 | 13,785 | 13,826 | 246 | 1.80 |
| Middlesex, NJ (3445900) | 13,635 | 13,646 | 13,690 | 13,767 | 13,842 | 13,888 | 242 | 1.80 |
| Middletown, NY (3647042) | 28,086 | 28,113 | 28,020 | 27,843 | 27,751 | 27,728 | -385 | -1.40 |
| Mineola, NY (3647636) | 18,799 | 18,824 | 18,877 | 18,903 | 19,002 | 19,028 | 204 | 1.10 |
| Morristown, NJ (3448300) | 18,411 | 18,346 | 18,428 | 18,463 | 18,539 | 19,085 | 739 | 4.00 |
| Mount Kisco, NY (3648890) | 10,877 | 10,892 | 10,963 | 10,991 | 11,078 | 11,103 | 211 | 1.90 |
| Mount Vernon, NY (3649121) | 67,292 | 67,366 | 67,746 | 67,909 | 68,349 | 68,458 | 1,092 | 1.60 |
| New Brunswick, NJ (3451210) | 55,181 | 54,759 | 55,466 | 55,742 | 55,936 | 57,080 | 2,321 | 4.20 |
| New Milford, NJ (3451660) | 16,341 | 16,365 | 16,470 | 16,537 | 16,602 | 16,678 | 313 | 1.90 |
| New Providence, NJ (3451810) | 12,171 | 12,197 | 12,229 | 12,309 | 12,358 | 12,422 | 225 | 1.80 |
| New Rochelle, NY (3650617) | 77,062 | 77,156 | 77,709 | 78,380 | 79,500 | 79,637 | 2,481 | 3.20 |
| New York, NY (3651000) | 8,175,133 | 8,191,853 | 8,287,238 | 8,365,903 | 8,438,379 | 8,491,079 | 299,226 | 3.70 |
| Newark, NJ (3451000) | 277,140 | 277,522 | 277,854 | 278,289 | 279,468 | 280,579 | 3,057 | 1.10 |
| Newburgh, NY (3650034) | 28,866 | 28,888 | 28,835 | 28,585 | 28,435 | 28,358 | -530 | -1.80 |
| North Arlington, NJ (3452320) | 15,392 | 15,417 | 15,522 | 15,584 | 15,660 | 15,723 | 306 | 2.00 |
| North Plainfield, NJ (3453280) | 21,936 | 21,970 | 22,063 | 22,131 | 22,106 | 22,029 | 59 | 0.30 |
| Oakland, NJ (3453850) | 12,754 | 12,774 | 12,857 | 12,916 | 12,983 | 13,046 | 272 | 2.10 |
| Ossining, NY (3655530) | 25,060 | 25,091 | 25,252 | 25,215 | 25,313 | 25,359 | 268 | 1.10 |
| Palisades Park, NJ (3455770) | 19,622 | 19,654 | 19,831 | 19,999 | 20,322 | 20,471 | 817 | 4.20 |
| Paramus, NJ (3455950) | 26,342 | 26,373 | 26,525 | 26,618 | 26,725 | 26,832 | 459 | 1.70 |
| Passaic, NJ (3456550) | 69,781 | 69,867 | 70,270 | 70,540 | 71,024 | 71,509 | 1,642 | 2.40 |
| Patchogue, NY (3656660) | 11,798 | 11,828 | 11,854 | 11,888 | 12,288 | 12,364 | 536 | 4.50 |
| Paterson, NJ (3457000) | 146,199 | 146,445 | 145,962 | 146,075 | 146,473 | 146,753 | 308 | 0.20 |
| Peekskill, NY (3656979) | 23,583 | 23,613 | 23,758 | 23,831 | 24,009 | 24,058 | 445 | 1.90 |
| Perth Amboy, NJ (3458200) | 50,814 | 50,933 | 51,484 | 51,848 | 52,091 | 52,328 | 1,395 | 2.70 |
| Plainfield, NJ (3459190) | 49,808 | 49,921 | 50,057 | 50,397 | 50,703 | 50,955 | 1,034 | 2.10 |
| Point Pleasant, NJ (3459880) | 18,392 | 18,417 | 18,419 | 18,444 | 18,520 | 18,665 | 248 | 1.30 |
| Pompton Lakes, NJ (3460090) | 11,097 | 11,104 | 11,168 | 11,169 | 11,174 | 11,166 | 62 | 0.60 |
| Port Chester, NY (3659223) | 28,967 | 29,002 | 29,173 | 29,242 | 29,450 | 29,522 | 520 | 1.80 |
| Poughkeepsie, NY (3659641) | 32,736 | 30,904 | 30,854 | 30,711 | 30,599 | 30,513 | -391 | -1.30 |
| Rahway, NJ (3461530) | 27,346 | 27,485 | 27,659 | 27,869 | 28,458 | 28,528 | 1,043 | 3.80 |
| Ramsey, NJ (3461680) | 14,473 | 14,494 | 14,601 | 14,662 | 14,741 | 14,800 | 306 | 2.10 |
| Red Bank, NJ (3462430) | 12,206 | 12,215 | 12,229 | 12,179 | 12,212 | 12,445 | 230 | 1.90 |
| Ridgefield, NJ (3462910) | 11,032 | 11,054 | 11,140 | 11,182 | 11,239 | 11,289 | 235 | 2.10 |
| Ridgefield Park, NJ (3462940) | 12,729 | 12,748 | 12,835 | 12,886 | 12,949 | 12,996 | 248 | 1.90 |
| Ridgewood, NJ (3463000) | 24,958 | 24,992 | 25,167 | 25,261 | 25,397 | 25,496 | 504 | 2.00 |
| Ringwood, NJ (3463150) | 12,228 | 12,236 | 12,317 | 12,332 | 12,363 | 12,377 | 141 | 1.20 |
| River Edge, NJ (3463360) | 11,340 | 11,357 | 11,434 | 11,475 | 11,536 | 11,579 | 222 | 2.00 |
| Rockville Centre, NY (3663264) | 24,023 | 24,049 | 24,107 | 24,128 | 24,170 | 24,191 | 142 | 0.60 |
| Roselle, NJ (3464620) | 21,085 | 21,134 | 21,215 | 21,363 | 21,496 | 21,551 | 417 | 2.00 |
| Roselle Park, NJ (3464650) | 13,297 | 13,331 | 13,379 | 13,474 | 13,557 | 13,595 | 264 | 2.00 |
| Rutherford, NJ (3465280) | 18,061 | 18,107 | 18,224 | 18,298 | 18,391 | 18,464 | 357 | 2.00 |
| Rye, NY (3664309) | 15,720 | 15,740 | 15,834 | 15,867 | 15,973 | 16,000 | 260 | 1.70 |
| Sayreville, NJ (3465790) | 42,704 | 42,734 | 43,338 | 43,889 | 44,636 | 45,262 | 2,528 | 5.90 |
| Scarsdale, NY (3665431) | 17,166 | 17,194 | 17,345 | 17,466 | 17,625 | 17,729 | 535 | 3.10 |
| Secaucus, NJ (3466570) | 16,264 | 16,296 | 17,270 | 17,715 | 18,401 | 18,416 | 2,120 | 13.00 |
| Somerville, NJ (3468460) | 12,098 | 12,119 | 12,171 | 12,208 | 12,198 | 12,153 | 34 | 0.30 |
| South Plainfield, NJ (3469390) | 23,385 | 23,435 | 23,519 | 23,679 | 23,837 | 23,960 | 525 | 2.20 |
| South River, NJ (3469420) | 16,008 | 16,032 | 16,071 | 16,177 | 16,282 | 16,334 | 302 | 1.90 |
| Spring Valley, NY (3670420) | 31,347 | 31,394 | 31,876 | 32,018 | 32,295 | 32,510 | 1,116 | 3.60 |
| Suffern, NY (3671894) | 10,723 | 10,745 | 10,821 | 10,857 | 10,939 | 10,991 | 246 | 2.30 |
| Summit, NJ (3471430) | 21,457 | 21,501 | 21,637 | 21,894 | 22,037 | 22,071 | 570 | 2.70 |
| Tarrytown, NY (3673176) | 11,277 | 11,295 | 11,371 | 11,406 | 11,494 | 11,537 | 242 | 2.10 |
| Tenafly, NJ (3472420) | 14,488 | 14,524 | 14,617 | 14,680 | 14,731 | 14,816 | 292 | 2.00 |
| Tinton Falls, NJ (3473020) | 17,892 | 17,925 | 17,906 | 17,878 | 17,986 | 17,898 | -27 | -0.20 |
| Totowa, NJ (3473140) | 10,804 | 10,813 | 10,883 | 10,896 | 10,930 | 10,937 | 124 | 1.10 |
| Union City, NJ (3474630) | 66,455 | 66,599 | 67,686 | 68,367 | 68,664 | 68,668 | 2,069 | 3.10 |
| Valley Stream, NY (3676705) | 37,511 | 37,599 | 37,704 | 37,742 | 37,799 | 37,832 | 233 | 0.60 |
| Wallington, NJ (3476490) | 11,335 | 11,359 | 11,448 | 11,500 | 11,568 | 11,626 | 267 | 2.40 |
| Wanaque, NJ (3476730) | 11,116 | 11,122 | 11,186 | 11,197 | 11,231 | 11,447 | 325 | 2.90 |
| West Haverstraw, NY (3680203) | 10,165 | 10,188 | 10,261 | 10,293 | 10,367 | 10,417 | 229 | 2.20 |
| West New York, NJ (3479610) | 49,708 | 49,884 | 50,773 | 51,910 | 52,387 | 52,597 | 2,713 | 5.40 |
| Westbury, NY (3679444) | 15,146 | 15,065 | 15,155 | 15,208 | 15,269 | 15,329 | 264 | 1.80 |
| Westfield, NJ (3479040) | 30,316 | 30,385 | 30,472 | 30,659 | 30,854 | 30,890 | 505 | 1.70 |
| Westwood, NJ (3480270) | 10,908 | 10,929 | 11,003 | 11,047 | 11,095 | 11,149 | 220 | 2.00 |
| White Plains, NY (3681677) | 56,853 | 56,930 | 57,231 | 57,375 | 57,906 | 58,035 | 1,105 | 1.90 |
| Woodbury, NY (3682750) | 10,686 | 10,693 | 10,687 | 10,670 | 10,711 | 10,814 | 121 | 1.10 |
| Woodland Park, NJ (3482423) | 11,819 | 11,875 | 11,963 | 12,131 | 12,301 | 12,403 | 528 | 4.40 |
| Yonkers, NY (3684000) | 195,976 | 196,383 | 197,772 | 198,581 | 199,952 | 200,667 | 4,284 | 2.20 |
All places time series population estimates interactive table.
4.2. Component County Characteristics go top
Updated periodically, annually. General demographics, social characteristics and extended detail Available in subscription edition.
Metropolitan areas are defined as one or more contiguous counties based on a set of demographic-economic criteria. Counties comprising the metro are shown below. For multi-county metros, this section provides insights into how the population is changing by county. Many metros changed geographic composition (counties included in the metro) between the Census 2010 vintage and the current vintage. These changes, if any, are also shown below (county is marked with **). See projections in related section.Click county code link to view county components of change.
** indicates this county added since Census 2010 vintage metro definition.
All counties interactive tables General Demographics | Social | Economic | HousingMetropolitan areas are defined as one or more contiguous counties based on a set of demographic-economic criteria. Counties comprising the metro are shown below. For multi-county metros, this section provides insights into how the population is changing by county. Many metros changed geographic composition (counties included in the metro) between the Census 2010 vintage and the current vintage. These changes, if any, are also shown below (county is marked with **). See projections in related section.Click county code link to view county components of change.
| Area | July 1 2010 | Pct | July 1 2011 | Pct | July 1 2012 | Pct | July 1 2013 | Pct | July 1 2014 | Pct | July 1 2015 | Pct |
| Metro Summary ... more details | 19,601,147 | 100.0 | 19,756,397 | 100.0 | 19,871,785 | 100.0 | 19,994,144 | 100.0 | 20,095,119 | 100.0 | 20,182,305 | 100.0 |
| Bergen County, NJ (34003) | 906,895 | 4.6 | 914,018 | 4.6 | 920,006 | 4.6 | 926,284 | 4.6 | 932,836 | 4.6 | 938,506 | 4.7 |
| Essex County, NJ (34013) | 784,597 | 4.0 | 787,006 | 4.0 | 787,707 | 4.0 | 790,935 | 4.0 | 794,962 | 4.0 | 797,434 | 4.0 |
| Hudson County, NJ (34017) | 636,317 | 3.2 | 648,350 | 3.3 | 656,840 | 3.3 | 663,565 | 3.3 | 669,502 | 3.3 | 674,836 | 3.3 |
| Hunterdon County, NJ (34019) | 127,342 | 0.6 | 127,203 | 0.6 | 126,495 | 0.6 | 126,252 | 0.6 | 125,810 | 0.6 | 125,488 | 0.6 |
| Middlesex County, NJ (34023) | 811,249 | 4.1 | 817,516 | 4.1 | 824,638 | 4.1 | 831,107 | 4.2 | 837,339 | 4.2 | 840,900 | 4.2 |
| Monmouth County, NJ (34025) | 630,677 | 3.2 | 629,815 | 3.2 | 629,075 | 3.2 | 629,304 | 3.1 | 629,018 | 3.1 | 628,715 | 3.1 |
| Morris County, NJ (34027) | 492,793 | 2.5 | 495,750 | 2.5 | 497,395 | 2.5 | 499,072 | 2.5 | 499,236 | 2.5 | 499,509 | 2.5 |
| Ocean County, NJ (34029) | 577,643 | 2.9 | 578,931 | 2.9 | 580,592 | 2.9 | 583,090 | 2.9 | 585,916 | 2.9 | 588,721 | 2.9 |
| Passaic County, NJ (34031) | 502,273 | 2.6 | 504,193 | 2.6 | 505,392 | 2.5 | 507,456 | 2.5 | 509,913 | 2.5 | 510,916 | 2.5 |
| Somerset County, NJ (34035) | 324,170 | 1.7 | 326,815 | 1.7 | 328,674 | 1.7 | 331,244 | 1.7 | 332,634 | 1.7 | 333,654 | 1.7 |
| Sussex County, NJ (34037) | 148,815 | 0.8 | 148,097 | 0.7 | 147,048 | 0.7 | 145,826 | 0.7 | 145,004 | 0.7 | 143,673 | 0.7 |
| Union County, NJ (34039) | 537,770 | 2.7 | 540,707 | 2.7 | 544,840 | 2.7 | 549,340 | 2.7 | 553,049 | 2.8 | 555,786 | 2.8 |
| Bronx County, NY (36005) | 1,388,264 | 7.1 | 1,400,221 | 7.1 | 1,415,240 | 7.1 | 1,429,123 | 7.1 | 1,441,757 | 7.2 | 1,455,444 | 7.2 |
| Dutchess County, NY (36027) ** | 297,745 | 1.5 | 298,274 | 1.5 | 297,270 | 1.5 | 296,963 | 1.5 | 296,380 | 1.5 | 295,754 | 1.5 |
| Kings County, NY (36047) | 2,510,335 | 12.8 | 2,544,744 | 12.9 | 2,573,998 | 13.0 | 2,600,098 | 13.0 | 2,620,720 | 13.0 | 2,636,735 | 13.1 |
| Nassau County, NY (36059) | 1,341,882 | 6.8 | 1,347,270 | 6.8 | 1,350,924 | 6.8 | 1,354,842 | 6.8 | 1,358,673 | 6.8 | 1,361,350 | 6.7 |
| New York County, NY (36061) | 1,588,609 | 8.1 | 1,609,789 | 8.1 | 1,624,885 | 8.2 | 1,631,375 | 8.2 | 1,636,966 | 8.1 | 1,644,518 | 8.1 |
| Orange County, NY (36071) ** | 373,428 | 1.9 | 374,293 | 1.9 | 374,026 | 1.9 | 374,958 | 1.9 | 375,994 | 1.9 | 377,647 | 1.9 |
| Putnam County, NY (36079) | 99,795 | 0.5 | 99,907 | 0.5 | 99,644 | 0.5 | 99,596 | 0.5 | 99,252 | 0.5 | 99,042 | 0.5 |
| Queens County, NY (36081) | 2,235,573 | 11.4 | 2,261,144 | 11.4 | 2,280,072 | 11.5 | 2,302,881 | 11.5 | 2,322,450 | 11.6 | 2,339,150 | 11.6 |
| Richmond County, NY (36085) | 469,645 | 2.4 | 471,102 | 2.4 | 470,874 | 2.4 | 472,570 | 2.4 | 473,301 | 2.4 | 474,558 | 2.4 |
| Rockland County, NY (36087) | 312,484 | 1.6 | 315,807 | 1.6 | 317,775 | 1.6 | 320,498 | 1.6 | 323,323 | 1.6 | 326,037 | 1.6 |
| Suffolk County, NY (36103) | 1,494,878 | 7.6 | 1,500,649 | 7.6 | 1,500,001 | 7.5 | 1,502,288 | 7.5 | 1,502,342 | 7.5 | 1,501,587 | 7.4 |
| Westchester County, NY (36119) | 950,636 | 4.8 | 957,270 | 4.8 | 961,577 | 4.8 | 968,826 | 4.8 | 972,504 | 4.8 | 976,396 | 4.8 |
| Pike County, PA (42103) | 57,332 | 0.3 | 57,526 | 0.3 | 56,797 | 0.3 | 56,651 | 0.3 | 56,238 | 0.3 | 55,949 | 0.3 |
All counties population estimates & components of change time series interactive table.
4.2.1. RDEMS County Characteristics
Updated quarterly. For more information, see RDEMS Main.
Links open HSG1 Housing & New Residential Construction section. Select other sections from list above table.
Bergen County, NJ
Essex County, NJ
Hudson County, NJ
Hunterdon County, NJ
Middlesex County, NJ
Monmouth County, NJ
Morris County, NJ
Ocean County, NJ
Passaic County, NJ
Somerset County, NJ
Sussex County, NJ
Union County, NJ
Bronx County, NY
Dutchess County, NY
Kings County, NY
Nassau County, NY
New York County, NY
Orange County, NY
Putnam County, NY
Queens County, NY
Richmond County, NY
Rockland County, NY
Suffolk County, NY
Westchester County, NY
4.3. General Demographic Characteristics
Updated annually. For more information, detail & to compare areas use interactive table.
| Item | 2013 | 2014 | Change 2013-14 | %Change 2013-14 |
| Total Population: Race/Origin | 19,949,502 | 20,092,883 | 143,381 | 0.72 |
| One race | 19,383,755 | 19,538,682 | 154,927 | 0.80 |
| White | 11,758,079 | 11,708,630 | -49,449 | -0.42 |
| Black/African American | 11,758,079 | 11,708,630 | -49,449 | -0.42 |
| American Indian/Alaska Native | 58,155 | 62,416 | 4,261 | 7.33 |
| Asian alone | 2,078,246 | 2,151,826 | 73,580 | 3.54 |
| Native Hawaiian/Pacific Islander | 8,060 | 5,309 | -2,751 | -34.13 |
| Some other race alone | 2,044,869 | 2,161,678 | 116,809 | 5.71 |
| Two or more races | 565,747 | 554,201 | -11,546 | -2.04 |
| Hispanic or Latino (of any race) | 4,690,030 | 4,785,019 | 94,989 | 2.03 |
| Population 25 years and over | 13,651,108 | 13,795,792 | 144,684 | 2.03 |
| % high school graduate or higher | 85.3 | 85.6 | 0.3 | 0.35 |
| % bachelor's degree or higher | 37.4 | 37.9 | 0.5 | 1.34 |
| Total Households | 7,080,691 | 7,152,760 | 72,069 | 1.34 |
| Median household income ($) | 65,786 | 67,066 | 1,280 | 1.95 |
| Mean household income ($) | 96,934 | 98,451 | 1,517 | 1.56 |
| Item | 2013 | 2014 | Change 2013-14 | %Change 2013-14 |
| Total Population: Gender & Age | 19,949,502 | 20,092,883 | 143,381 | 0.72 |
| Male | 9,651,291 | 9,713,565 | 62,274 | 1.56 |
| Female | 10,298,211 | 10,379,318 | 81,107 | 1.56 |
| Under 5 years | 1,230,082 | 1,244,376 | 14,294 | 1.56 |
| 5 to 9 years | 1,203,845 | 1,208,382 | 4,537 | 0.38 |
| 10 to 14 years | 1,233,704 | 1,219,074 | -14,630 | -1.19 |
| 15 to 19 years | 1,263,326 | 1,250,339 | -12,987 | -1.03 |
| 20 to 24 years | 1,367,437 | 1,374,920 | 7,483 | 0.55 |
| 25 to 34 years | 2,880,212 | 2,923,130 | 42,918 | 1.49 |
| 35 to 44 years | 2,686,793 | 2,685,418 | -1,375 | -0.05 |
| 45 to 54 years | 2,894,277 | 2,880,861 | -13,416 | -0.46 |
| 55 to 59 years | 1,314,250 | 1,341,585 | 27,335 | 2.08 |
| 55 to 59 years | 1,314,250 | 1,341,585 | 27,335 | 2.08 |
| 60 to 64 years | 1,105,435 | 1,134,993 | 29,558 | 2.67 |
| 65 to 74 years | 1,512,611 | 1,565,083 | 52,472 | 3.47 |
| 75 to 84 years | 837,968 | 846,815 | 8,847 | 1.06 |
| 85 years and over | 419,562 | 417,907 | -1,655 | -0.39 |
| Median age | 38.0 | 37.9 | -0.1 | -0.26 |
| 18 years and over | 15,519,556 | 15,664,618 | 145,062 | 0.93 |
| 21 years and over | 14,746,054 | 14,900,470 | 154,416 | 1.05 |
| 62 years and over | 3,406,891 | 3,477,810 | 70,919 | 2.08 |
| 65 years and over | 2,770,141 | 2,829,805 | 59,664 | 2.15 |
5. Housing Characteristics & Trends go top
Updated monthly, quarterly, annually. Housing market conditions and extended detail Available in subscription edition.
5.1. Total Housing Units
Updated Annually. Independent annual model-based estimates. For more information, detail & to compare areas use interactive table.
| Item | Census 2010 | July 1 2010 | July 1 2011 | July 1 2012 | July 1 2013 | July 1 2014 | Change 2010-2014 | %Change 2010-2014 |
| Total Housing Units | 7,783,415 | 7,788,882 | 7,811,427 | 7,834,546 | 7,854,287 | 7,880,495 | 91,613 | 1.18 |
5.2. General Housing Characteristics
Updated Annually. For more information, detail & to compare areas use interactive table.
| Item | 2013 | 2014 | Change 2013-14 | %Change 2013-14 |
| Housing Units: Units in Structure | 7,822,053 | 7,880,970 | 58,917 | 0.75 |
| 1-unit, detached | 2,873,279 | 2,880,770 | 7,491 | 0.26 |
| 1-unit, attached | 514,885 | 507,885 | -7,000 | -1.36 |
| 2 units | 872,159 | 869,861 | -2,298 | -0.26 |
| 3 or 4 units | 619,560 | 635,601 | 16,041 | 2.59 |
| 5 to 9 units | 423,542 | 429,871 | 6,329 | 1.49 |
| 10 to 20 units | 402,485 | 409,443 | 6,958 | 1.73 |
| 20 or more units | 2,074,518 | 2,108,312 | 33,794 | 1.63 |
| Item | 2013 | 2014 | Change 2013-14 | %Change 2013-14 |
| Housing Units: Occupancy & Tenure | 7,822,053 | 7,880,970 | 58,917 | 0.75 |
| Occupied Housing Units | 7,080,691 | 7,152,760 | 72,069 | 1.02 |
| Owner | 3,655,346 | 3,627,096 | -28,250 | -0.77 |
| Renter | 3,425,345 | 3,525,664 | 100,319 | 2.93 |
| Vacant Housing Units | 741,362 | 728,210 | -13,152 | -1.77 |
| Homeowner vacancy rate | 1.60 | 1.70 | 0.10 | ... |
| Rental vacancy rate | 4.30 | 4.20 | -0.10 | ... |
| Average household size; owner-occ | 2.93 | 2.93 | 0.00 | 0.00 |
| Average household size; renter-occ | 2.57 | 2.57 | 0.00 | 0.00 |
| Median Value $ owner occupied | 392,700 | 396,700 | 4,000 | 1.02 |
| Median Rent $ renter occupied | 1,237 | 1,281 | 44 | 3.56 |
5.3. Residential Construction; Housing Units Authorized & Value
Updated Monthly. 12 most recent months. For more information, detail & to compare areas use interactive table.
| Item | Aug15 | Sep15 | Oct15 | Nov15 | Dec15 | Jan16 | Feb16 | Mar16 | Apr16 | May16 | Jun16 | Jul16 |
| Total Residential Units | 3,517 | 2,941 | 4,276 | 3,596 | 10,559 | 1,549 | 3,218 | 2,640 | 2,987 | 3,036 | 4,255 | 2,939 |
| in 1 unit bldgs | 855 | 942 | 853 | 895 | 921 | 657 | 693 | 978 | 907 | 825 | 895 | 794 |
| in 2 unit bldgs | 110 | 120 | 128 | 116 | 98 | 118 | 100 | 142 | 172 | 188 | 134 | 136 |
| in 3-4 unit bldgs | 65 | 269 | 75 | 79 | 116 | 66 | 98 | 63 | 48 | 57 | 62 | 71 |
| in 5+ unit bldgs | 2,487 | 1,610 | 3,220 | 2,506 | 9,424 | 708 | 2,327 | 1,457 | 1,860 | 1,966 | 3,164 | 1,938 |
| Bldgs with 5+ units | 98 | 83 | 128 | 120 | 292 | 55 | 80 | 103 | 96 | 85 | 121 | 82 |
| Percent Coverage | 99 | 99 | 99 | 99 | 99 | 99 | 99 | 99 | 99 | 99 | 99 | 99 |
| Value ($000), Total Units | 574,842 | 459,381 | 573,361 | 532,169 | 1,426,902 | 270,746 | 612,286 | 416,623 | 511,637 | 475,742 | 802,446 | 503,101 |
| 1 unit structures | 278,590 | 279,100 | 274,303 | 255,579 | 259,899 | 183,508 | 203,244 | 245,848 | 256,437 | 234,973 | 307,121 | 230,125 |
| 2 unit structures | 14,084 | 14,737 | 15,880 | 13,980 | 14,578 | 14,844 | 12,917 | 19,514 | 21,678 | 25,521 | 18,490 | 16,866 |
| 3-4 unit structures | 10,847 | 11,469 | 8,194 | 11,451 | 13,821 | 6,618 | 10,488 | 10,237 | 6,043 | 7,263 | 20,755 | 12,726 |
| 5+ unit structures | 271,321 | 154,075 | 274,984 | 251,159 | 1,138,604 | 65,776 | 385,637 | 141,024 | 227,479 | 207,985 | 456,080 | 243,384 |
6. Economic Characteristics & Trends go top
6.1. Economic Profile go top
The Economic Profile shows shows derivation and key components of total personal income. Data are organized by place of residence and place of work. The place of residence profile includes estimates of total personal income, population, and per capita personal income. The place of work profile includes estimates of total earnings, total employment and average earnings per job. Updated annually. See related interactive table.
Dollar items are in current dollars (not adjusted for inflation). Per capita items in dollars; other dollar items in thousands of dollars.
See related notes.
| Item | 2011 | 2012 | 2013 | 2014 | 2015 | Change 2011-2015 | %Change 2011-2015 |
| Personal income | 1,110,958,771 | 1,177,875,369 | 1,197,071,879 | 1,255,064,420 | 1,303,529,911 | 192,571,140 | 17.3 |
| Net earnings 1/ | 719,304,752 | 760,661,195 | 769,152,338 | 804,589,777 | 838,604,153 | 119,299,401 | 16.6 |
| Personal current transfer receipts | 182,168,715 | 180,171,540 | 181,556,065 | 185,695,209 | 195,228,986 | 13,060,271 | 7.2 |
| Income maintenance 2/ | 20,217,393 | 20,697,294 | 20,913,272 | 20,975,292 | 20,893,674 | 676,281 | 3.3 |
| Unemployment insurance compensation | 9,544,494 | 8,455,977 | 6,328,825 | 3,365,414 | 2,994,354 | -6,550,140 | -68.6 |
| Retirement and other | 152,406,828 | 151,018,269 | 154,313,968 | 161,354,503 | 171,340,958 | 18,934,130 | 12.4 |
| Dividends, interest, and rent 3/ | 209,485,304 | 237,042,634 | 246,363,476 | 264,779,434 | 269,696,772 | 60,211,468 | 28.7 |
| Population 4/ | 19,756,397 | 19,871,785 | 19,994,144 | 20,095,119 | 20,182,305 | 425,908 | 2.2 |
| Per capita personal income | 56,233 | 59,274 | 59,871 | 62,456 | 64,588 | 8,355 | 14.9 |
| Per capita net earnings | 36,409 | 38,278 | 38,469 | 40,039 | 41,551 | 5,142 | 14.1 |
| Per capita personal current transfer receipts | 9,221 | 9,067 | 9,080 | 9,241 | 9,673 | 452 | 4.9 |
| Per capita income maintenance | 1,023 | 1,042 | 1,046 | 1,044 | 1,035 | 12 | 1.2 |
| Per capita unemployment insurance compensation | 483 | 426 | 317 | 167 | 148 | -335 | -69.4 |
| Per capita retirement and other | 7,714 | 7,600 | 7,718 | 8,030 | 8,490 | 776 | 10.1 |
| Per capita dividends, interest, and rent | 10,603 | 11,929 | 12,322 | 13,176 | 13,363 | 2,760 | 26.0 |
| Earnings by place of work | 819,337,124 | 864,364,401 | 885,576,225 | 927,059,699 | 966,007,067 | 146,669,943 | 17.9 |
| Wages and salaries | 590,667,880 | 608,560,914 | 622,802,140 | 660,427,595 | 689,238,274 | 98,570,394 | 16.7 |
| Supplements to wages and salaries | 136,896,472 | 141,524,024 | 145,994,767 | 150,079,969 | 154,230,464 | 17,333,992 | 12.7 |
| Employer cont. for empl. pension & insur. funds 6/ | 95,772,385 | 99,024,782 | 101,740,927 | 103,584,650 | 106,113,093 | 10,340,708 | 10.8 |
| Employer cont. for government social insurance | 41,124,087 | 42,499,242 | 44,253,840 | 46,495,319 | 48,117,371 | 6,993,284 | 17.0 |
| Proprietors' income | 91,772,772 | 114,279,463 | 116,779,318 | 116,552,135 | 122,538,329 | 30,765,557 | 33.5 |
| Nonfarm proprietors' income | 73,298 | 53,269 | 79,703 | 3,662 | 1,898 | -71,400 | -97.4 |
| Farm proprietors' income | 91,699,474 | 114,226,194 | 116,699,615 | 116,548,473 | 122,536,431 | 30,836,957 | 33.6 |
| Total full-time and part-time employment | 11,579,459 | 11,729,399 | 11,968,179 | 12,247,401 | 12,535,406 | 955,947 | 8.3 |
| Wage and salary jobs | 8,863,472 | 8,995,906 | 9,147,178 | 9,331,617 | 9,517,717 | 654,245 | 7.4 |
| Number of proprietors | 2,715,987 | 2,733,493 | 2,821,001 | 2,915,784 | 3,017,689 | 301,702 | 11.1 |
| Number of nonfarm proprietors 7/ | 5,615 | 5,411 | 5,529 | 5,640 | 5,634 | 19 | 0.3 |
| Number of farm proprietors | 2,710,372 | 2,728,082 | 2,815,472 | 2,910,144 | 3,012,055 | 301,683 | 11.1 |
| Average earnings per job (dollars) | 70,758 | 73,692 | 73,994 | 75,694 | 77,062 | 6,304 | 8.9 |
| Average wages and salaries | 66,641 | 67,649 | 68,087 | 70,773 | 72,416 | 5,775 | 8.7 |
| Average nonfarm proprietors' income | 33,833 | 41,871 | 41,449 | 40,049 | 40,682 | 6,849 | 20.2 |
See related notes.
6.2. Cost of Living Indexes go top
Updated periodically. Available in subscription edition.
6.3. Cost of Doing Business Indexes go top
Updated periodically. Available in subscription edition.
6.4. Consumer Price Index go top
Updated monthly. Available in subscription edition.
6.5. Gross Domestic Product by Sector go top
Updated quarterly, annually. For more information, detail & to compare areas use interactive table. Additional detail in subscription edition.
| Item | 2009 | 2010 | 2011 | 2012 | 2013 | 2014 | Change 2009-14 | %Change 2009-14 |
| Gross Domestic Product, millions of current dollars | 1,276,750 | 1,334,008 | 1,368,438 | 1,446,659 | 1,490,952 | 1,558,518 | 281,768 | 22.07 |
| Real Gross Domestic Product, millions of real dollars | 1,276,750 | 1,317,459 | 1,329,936 | 1,374,136 | 1,389,316 | 1,423,173 | 146,423 | 11.47 |
6.6. Establishments, Employment & Earnings by Detailed Type of Business go top
Updated quarterly. For more information, detail & to compare areas use interactive table.
| Sector | Establishments 2015Q1 | Employment 2015Q1 | Avg Weekly Wages 2015Q1 | Establishments 2015Q2 | Employment 2015Q2 | Avg Weekly Wages 2015Q2 |
| Total, all industries | 625,943 | 14,522,666 | 1,601 | 629,576 | 14,903,974 | 1,266 |
| Total, all industries - Fed Govt | 1,586 | 183,434 | 1,635 | 1,577 | 185,199 | 1,406 |
| Total, all industries - St Govt | 1,584 | ... | ... | 1,585 | ... | ... |
| Total, all industries - Local Govt | 6,603 | ... | ... | 6,588 | ... | ... |
| Total, all industries - Private | 616,170 | 12,461,250 | 1,659 | 619,826 | 12,796,868 | 1,264 |
| Goods-producing | 64,927 | 1,144,765 | 1,361 | 65,018 | 1,205,425 | 1,295 |
| Natural resources and mining | 1,186 | ... | ... | 1,177 | ... | ... |
| Construction | 46,894 | 533,199 | 1,229 | 47,051 | 585,125 | 1,293 |
| Manufacturing | 16,847 | ... | ... | 16,790 | ... | ... |
| Service-providing | 551,243 | 11,316,485 | 1,689 | 554,808 | 11,591,442 | 1,261 |
| Trade, transportation & utilities | 124,961 | 2,714,439 | 984 | 124,632 | 2,734,423 | 965 |
| Information | 10,611 | 438,757 | 2,710 | 10,618 | 441,382 | 2,079 |
| Financial activities | 63,573 | 1,203,501 | 5,672 | 63,530 | 1,216,300 | 2,627 |
| Professional & business services | 108,302 | 2,234,717 | 2,050 | 109,775 | 2,308,876 | 1,685 |
| Education and health services | 69,012 | 2,744,465 | 943 | 69,142 | 2,790,353 | 960 |
| Leisure and hospitality | 58,169 | 1,324,812 | 589 | 58,456 | 1,429,685 | 573 |
| Other services | 73,784 | 580,152 | 754 | 73,942 | 595,735 | 737 |
| Unclassified | 42,831 | 75,643 | 699 | 44,713 | 74,688 | 672 |
Notes: cell value of '...' indicates value suppressed to maintain confidentiality.
Use the following links to access detailed establishment and employment data by type of business (CSV files).
.. see notes on using these files.
2013Q1 .. 2013Q2 .. 2013Q3 .. 2013Q4 .|. 2014Q1 .. 2014Q2 .. 2014Q3 .. 2014Q4 .|. 2015Q1 .. 2015Q2 .. 2015Q3 .. 2015Q4 .. 2016Q1 .. 2016Q2
6.7. Labor Market Characteristics & Trends go top
Updated monthly. Available in subscription edition.
For more information, detail & to compare areas use interactive table.
Table shows 13 most recent months.
| Item | Aug15 | Sep15 | Oct15 | Nov15 | Dec15 | Jan16 | Feb16 | Mar16 | Apr16 | May16 | Jun16 | Jul16 | Aug16 |
| Unemplymnt Rate | 4.5 | 4.3 | 4.0 | 3.7 | 3.4 | 3.7 | 3.8 | 4.1 | 4.1 | 4.2 | 4.2 | 4.9 | 4.7 |
| Unemployment | 21,704 | 20,617 | 19,293 | 17,881 | 16,651 | 18,119 | 18,594 | 20,050 | 19,960 | 20,528 | 20,703 | 24,196 | 22,903 |
| Employment | 462,012 | 459,587 | 466,803 | 469,781 | 471,893 | 465,904 | 469,583 | 472,653 | 469,832 | 466,994 | 469,170 | 469,096 | 463,935 |
| Labor Force | 483,716 | 480,204 | 486,096 | 487,662 | 488,544 | 484,023 | 488,177 | 492,703 | 489,792 | 487,522 | 489,873 | 493,292 | 486,838 |
7. Education Infrastructure go top
7.1. Component School District Characteristics go top
Districts in this metro. Updated periodically. See related School District interactive table.
| District Name | City Name | District Code | Locale Code | County | State | 2012-13 Enrollment | 2013 Total Population | Grade Relevant Pop Ages 5-17 |
| Alexandria Township School District | Pittstown | 3400690 | 42 | 34019 | NJ | 477 | 4,895 | 630 |
| Allendale Board of Education | Allendale | 3400750 | 21 | 34003 | NJ | 903 | 6,650 | 995 |
| Allenhurst | Allenhurst | 3400780 | 21 | 34025 | NJ | 1 | 495 | 56 |
| Alpine Elementary School District | Alpine | 3400870 | 21 | 34003 | NJ | 145 | 1,905 | 346 |
| Andover Regional | Newton | 3400900 | 21 | 34037 | NJ | 566 | 6,719 | 1,062 |
| Asbury Park School District | Asbury Park | 3400930 | 21 | 34025 | NJ | 1,928 | 16,098 | 2,454 |
| Atlantic Highlands School District | Atlantic Highlands | 3401020 | 21 | 34025 | NJ | 326 | 4,377 | 303 |
| Avon-By-The-Sea | Avon | 3401140 | 21 | 34025 | NJ | 164 | 1,899 | 255 |
| Barnegat Township School District | Barnegat | 3416470 | 21 | 34029 | NJ | 3,232 | 21,185 | 3,370 |
| Bay Head Borough | Bay Head | 3401230 | 21 | 34029 | NJ | 143 | 979 | 127 |
| Bayonne Board of Education | Bayonne | 3401260 | 21 | 34017 | NJ | 9,487 | 65,593 | 10,327 |
| Beach Haven School District | Beach Haven | 3401290 | 21 | 34029 | NJ | 63 | 1,187 | 60 |
| Bedminster Township Public School | Bedminster | 3401320 | 41 | 34035 | NJ | 586 | 8,345 | 1,016 |
| Belleville Public Schools | Belleville | 3401350 | 21 | 34013 | NJ | 4,680 | 36,184 | 5,486 |
| Belmar Board of Education | Belmar | 3401410 | 21 | 34025 | NJ | 568 | 5,788 | 652 |
| Bergenfield Borough School District | Bergenfield | 3401500 | 21 | 34003 | NJ | 3,525 | 27,362 | 4,642 |
| Berkeley Heights Public Schools | Berkeley Heights | 3401530 | 21 | 34039 | NJ | 2,739 | 13,472 | 2,808 |
| Berkeley Township | Bayville | 3401560 | 21 | 34029 | NJ | 2,054 | 41,744 | 2,012 |
| Bernards Township Public Schools | Basking Ridge | 3401650 | 21 | 34035 | NJ | 5,689 | 27,243 | 6,119 |
| Bethlehem Township Schools | Asbury | 3401710 | 41 | 34019 | NJ | 457 | 3,945 | 560 |
| Bloomfield Board of Education | Bloomfield | 3401830 | 21 | 34013 | NJ | 6,133 | 47,684 | 6,878 |
| Bloomingdale School District | Bloomingdale | 3401860 | 21 | 34031 | NJ | 617 | 7,718 | 1,166 |
| Bloomsbury School District | Bloomsbury | 3401890 | 21 | 34019 | NJ | 141 | 862 | 160 |
| Bogota Public Schools | Bogota | 3401920 | 21 | 34003 | NJ | 1,124 | 8,370 | 1,469 |
| Boonton Town School District | Boonton | 3401950 | 21 | 34027 | NJ | 1,060 | 8,468 | 1,178 |
| Boonton Township Public School | Boonton Township | 3401980 | 21 | 34027 | NJ | 483 | 4,332 | 866 |
| Bound Brook School District | Bound Brook | 3402100 | 21 | 34035 | NJ | 1,621 | 10,632 | 1,571 |
| Bradley Beach Elementary School | Bradley Beach | 3402130 | 21 | 34025 | NJ | 285 | 4,293 | 401 |
| Branchburg Township | Branchburg | 3402160 | 21 | 34035 | NJ | 1,693 | 14,778 | 2,844 |
| Brick Township Public Schools | Brick | 3402220 | 21 | 34029 | NJ | 9,702 | 75,964 | 11,946 |
| Bridgewater-Raritan Regional School District | Bridgewater | 3402280 | 21 | 34035 | NJ | 8,687 | 52,477 | 9,846 |
| Brielle Boro | Brielle | 3402310 | 21 | 34025 | NJ | 599 | 4,769 | 1,014 |
| Butler Public Schools | Butler | 3402520 | 21 | 34027 | NJ | 1,161 | 7,648 | 1,082 |
| Byram Township Board of Education | Stanhope | 3402550 | 41 | 34037 | NJ | 960 | 8,189 | 1,038 |
| Caldwell-West Caldwell Public Schools | West Caldwell | 3402580 | 21 | 34013 | NJ | 2,624 | 18,743 | 3,008 |
| Califon School District | Califon | 3402610 | 41 | 34019 | NJ | 143 | 1,067 | 152 |
| Carlstadt Public School | Carlstadt | 3402790 | 21 | 34003 | NJ | 596 | 6,264 | 629 |
| Carlstadt-East Rutherford Regional High School | East Rutherford | 3402800 | 21 | 34003 | NJ | 504 | 15,376 | 633 |
| Carteret Public Schools | Carteret | 3402820 | 21 | 34023 | NJ | 3,810 | 23,382 | 4,218 |
| Cedar Grove Township School District | Cedar Grove | 3402850 | 21 | 34013 | NJ | 1,625 | 12,499 | 1,866 |
| Central Regional School District | Bayville | 3402910 | 21 | 34029 | NJ | 2,003 | 49,993 | 2,198 |
| Chester School District | Chester | 3403060 | 21 | 34027 | NJ | 1,240 | 9,648 | 1,523 |
| Clark Township Public Schools | Clark | 3403150 | 21 | 34039 | NJ | 2,299 | 15,079 | 2,402 |
| Cliffside Park School District | Cliffside Park | 3403270 | 21 | 34003 | NJ | 2,847 | 24,123 | 2,653 |
| Clifton Public Schools | Clifton | 3403300 | 21 | 34031 | NJ | 10,949 | 84,815 | 13,104 |
| Clinton Township | Lebanon | 3403360 | 21 | 34019 | NJ | 1,595 | 13,361 | 1,595 |
| Clinton-Glen Gardner Board of Education | Clinton | 3403330 | 21 | 34019 | NJ | 481 | 4,385 | 507 |
| Closter Public Schools | Closter | 3403390 | 21 | 34003 | NJ | 1,120 | 8,560 | 1,204 |
| Colts Neck Township School District | Colts Neck | 3403450 | 21 | 34025 | NJ | 1,097 | 10,131 | 1,506 |
| Cranbury Township Board of Education | Cranbury | 3403540 | 23 | 34023 | NJ | 543 | 3,948 | 908 |
| Cranford Public School District | Cranford | 3403570 | 21 | 34039 | NJ | 3,885 | 23,121 | 4,204 |
| Cresskill Public School District | Cresskill | 3403600 | 21 | 34003 | NJ | 1,708 | 8,750 | 1,917 |
| Deal Elementary School | Deal | 3403630 | 21 | 34025 | NJ | 149 | 749 | 82 |
| Delaware Township School | Sergeantsville | 3403720 | 41 | 34019 | NJ | 410 | 4,524 | 458 |
| Delaware Valley Regional High School District | Frenchtown | 3403750 | 42 | 34019 | NJ | 962 | 16,536 | 1,026 |
| Demarest School District | Demarest | 3403810 | 21 | 34003 | NJ | 668 | 4,990 | 708 |
| Denville Township Board of Education | Denville | 3403870 | 21 | 34027 | NJ | 1,744 | 16,921 | 2,023 |
| Dover Public School District | Dover | 3403930 | 21 | 34027 | NJ | 3,036 | 19,947 | 2,866 |
| Dumont Board of Education | Dumont | 3403990 | 21 | 34003 | NJ | 2,650 | 17,869 | 3,073 |
| Dunellen Public School District | Dunellen | 3404020 | 21 | 34023 | NJ | 1,142 | 7,397 | 1,252 |
| Eagleswood Township School District | West Creek | 3404050 | 41 | 34029 | NJ | 134 | 1,622 | 125 |
| East Amwell Township | Ringoes | 3404080 | 41 | 34019 | NJ | 425 | 3,978 | 472 |
| East Brunswick Public Schools | East Brunswick | 3404110 | 21 | 34023 | NJ | 8,231 | 48,630 | 9,191 |
| East Hanover Township School District | East Hanover | 3404170 | 21 | 34027 | NJ | 1,060 | 11,317 | 1,250 |
| East Newark | East Newark | 3404200 | 21 | 34017 | NJ | 239 | 2,505 | 371 |
| East Orange School District | East Orange | 3404230 | 21 | 34013 | NJ | 9,660 | 64,563 | 11,605 |
| East Rutherford School District | East Rutherford | 3404290 | 21 | 34003 | NJ | 765 | 9,112 | 769 |
| Eatontown Public Schools | Eatontown | 3404410 | 21 | 34025 | NJ | 1,070 | 12,695 | 1,181 |
| Edgewater School District | Edgewater | 3404440 | 21 | 34003 | NJ | 695 | 11,768 | 1,085 |
| Edison Township Public Schools | Edison | 3404500 | 21 | 34023 | NJ | 14,317 | 102,324 | 16,100 |
| Elizabeth Public Schools | Elizabeth | 3404590 | 21 | 34039 | NJ | 23,988 | 127,708 | 22,191 |
| Elmwood Park Board of Education | Elmwood Park | 3404660 | 21 | 34003 | NJ | 2,487 | 19,836 | 2,893 |
| Emerson Public Schools | Emerson | 3404710 | 21 | 34003 | NJ | 1,205 | 7,566 | 1,372 |
| Englewood Cliffs Public Schools | Englewood Cliffs | 3404770 | 21 | 34003 | NJ | 491 | 5,399 | 884 |
| Englewood Public School District | Englewood | 3404740 | 21 | 34003 | NJ | 3,004 | 27,733 | 4,227 |
| Essex Fells School District | Essex Fells | 3404830 | 21 | 34013 | NJ | 183 | 2,129 | 252 |
| Fair Haven School District | Fair Haven | 3404950 | 21 | 34025 | NJ | 1,041 | 6,114 | 1,069 |
| Fair Lawn Public Schools | Fair Lawn | 3404980 | 21 | 34003 | NJ | 4,575 | 33,182 | 5,445 |
| Fairfield Public Schools | Fairfield | 3405010 | 21 | 34013 | NJ | 692 | 7,519 | 680 |
| Fairview Public Schools | Fairview | 3405070 | 21 | 34003 | NJ | 1,214 | 14,144 | 1,817 |
| Farmingdale Board of Education | Farmingdale | 3405130 | 21 | 34025 | NJ | 150 | 1,328 | 131 |
| Flemington-Raritan Regional School District | Flemington | 3405190 | 21 | 34019 | NJ | 3,504 | 26,527 | 3,344 |
| Florham Park Public Schools | Florham Park | 3405250 | 21 | 34027 | NJ | 1,010 | 11,904 | 1,162 |
| Fort Lee Public Schools | Fort Lee | 3405310 | 21 | 34003 | NJ | 3,723 | 36,125 | 4,171 |
| Frankford Township School District | Branchville | 3405340 | 42 | 34037 | NJ | 540 | 6,282 | 620 |
| Franklin Borough School District | Franklin | 3405400 | 31 | 34037 | NJ | 490 | 4,968 | 511 |
| Franklin Lakes Public Schools | Franklin Lakes | 3405370 | 21 | 34003 | NJ | 1,266 | 10,826 | 1,574 |
| Franklin Township Public Schools | Somerset | 3405490 | 21 | 34035 | NJ | 7,663 | 63,676 | 9,191 |
| Franklin Township School | Quakertown | 3405460 | 41 | 34019 | NJ | 285 | 3,167 | 397 |
| Fredon Township School District | Newton | 3405550 | 41 | 34037 | NJ | 323 | 3,332 | 337 |
| Freehold Borough Public Schools | Freehold | 3405580 | 21 | 34025 | NJ | 1,481 | 12,039 | 1,288 |
| Freehold Regional High School District | Englishtown | 3405610 | 21 | 34025 | NJ | 11,589 | 191,477 | 12,880 |
| Freehold Township School District | Freehold | 3405640 | 21 | 34025 | NJ | 4,135 | 36,143 | 4,395 |
| Frenchtown School District | Frenchtown | 3405700 | 31 | 34019 | NJ | 144 | 1,363 | 131 |
| Garfield Public School District | Garfield | 3405760 | 21 | 34003 | NJ | 4,628 | 31,168 | 5,005 |
| Garwood Boro | Garwood | 3405790 | 21 | 34039 | NJ | 389 | 4,319 | 598 |
| Glen Ridge Public Schools | Glen Ridge | 3405940 | 21 | 34013 | NJ | 1,969 | 7,581 | 1,842 |
| Glen Rock Public School District | Glen Rock | 3405970 | 21 | 34003 | NJ | 2,355 | 11,860 | 2,773 |
| Green Brook Township Public Schools | Green Brook | 3406120 | 21 | 34035 | NJ | 927 | 7,362 | 1,456 |
| Green Township School District | Greendell | 3406090 | 41 | 34037 | NJ | 485 | 3,531 | 732 |
| Guttenberg School District | Guttenberg | 3406240 | 21 | 34017 | NJ | 1,004 | 11,634 | 1,576 |
| Hackensack City | Hackensack | 3406270 | 21 | 34003 | NJ | 5,398 | 43,970 | 5,245 |
| Haledon Public School District | Haledon | 3406450 | 21 | 34031 | NJ | 998 | 8,393 | 1,070 |
| Hamburg School District | Hamburg | 3406480 | 31 | 34037 | NJ | 275 | 3,214 | 295 |
| Hampton Borough Public School District | Hampton | 3406600 | 31 | 34019 | NJ | 108 | 1,389 | 143 |
| Hampton Township School District | Newton | 3406630 | 41 | 34037 | NJ | 346 | 5,089 | 383 |
| Hanover Park Regional High School District | East Hanover | 3406660 | 21 | 34027 | NJ | 1,585 | 37,131 | 1,783 |
| Hanover Township Board of Education | Whippany | 3406690 | 21 | 34027 | NJ | 1,472 | 13,910 | 1,558 |
| Harding Township | New Vernon | 3406720 | 41 | 34027 | NJ | 317 | 3,883 | 759 |
| Hardyston Township School District | Hamburg | 3406780 | 31 | 34037 | NJ | 758 | 8,061 | 778 |
| Harrington Park School District | Harrington Park | 3406840 | 21 | 34003 | NJ | 634 | 4,768 | 731 |
| Harrison Public Schools | Harrison | 3406870 | 21 | 34017 | NJ | 2,076 | 14,177 | 1,975 |
| Hasbrouck Heights Board of Education | Hasbrouck Heights | 3406930 | 21 | 34003 | NJ | 1,892 | 12,175 | 1,974 |
| Haworth Public School | Haworth | 3406960 | 21 | 34003 | NJ | 427 | 3,458 | 533 |
| Hawthorne Board of Education | Hawthorne | 3406990 | 21 | 34031 | NJ | 2,323 | 18,943 | 2,884 |
| Hazlet Township Public Schools | Hazlet | 3413680 | 21 | 34025 | NJ | 3,196 | 20,311 | 3,420 |
| Henry Hudson Regional School District | Highlands | 3407050 | 21 | 34025 | NJ | 365 | 9,392 | 508 |
| High Bridge Borough | High Bridge | 3407110 | 21 | 34019 | NJ | 362 | 3,616 | 405 |
| High Point Regional High School | Sussex | 3407140 | 41 | 34037 | NJ | 1,009 | 21,986 | 1,270 |
| Highland Park Board of Education | Highland Park | 3407170 | 21 | 34023 | NJ | 1,540 | 14,311 | 2,125 |
| Highlands Elementary | Highlands | 3407200 | 21 | 34025 | NJ | 181 | 5,015 | 214 |
| Hillsborough Township Public School District | Hillsborough | 3407230 | 21 | 34035 | NJ | 7,217 | 39,576 | 7,752 |
| Hillsdale Board of Education | Hillsdale | 3407260 | 21 | 34003 | NJ | 1,332 | 10,451 | 1,471 |
| Hillside Board of Education | Hillside | 3407290 | 21 | 34039 | NJ | 3,011 | 21,873 | 3,741 |
| Ho-Ho-Kus School District | Ho-Ho-Kus | 3407320 | 21 | 34003 | NJ | 645 | 4,169 | 940 |
| Hoboken Public Schools | Hoboken | 3407350 | 21 | 34017 | NJ | 1,706 | 52,056 | 2,728 |
| Holland Township School District | Milford | 3407380 | 41 | 34019 | NJ | 617 | 5,245 | 605 |
| Holmdel Township School District | Holmdel | 3407410 | 21 | 34025 | NJ | 3,095 | 16,754 | 3,394 |
| Hopatcong Borough Schools | Hopatcong | 3407440 | 21 | 34037 | NJ | 1,902 | 14,854 | 2,285 |
| Howell Township Public Schools | Farmingdale | 3407560 | 21 | 34025 | NJ | 6,365 | 51,018 | 6,572 |
| Hunterdon Central Regional High School | Flemington | 3407590 | 21 | 34019 | NJ | 3,015 | 51,015 | 3,073 |
| Interlaken | Interlaken | 3407650 | 21 | 34025 | NJ | 1 | 819 | 87 |
| Irvington Board of Education | Irvington | 3407680 | 21 | 34013 | NJ | 6,502 | 54,317 | 9,285 |
| Island Heights Board of Education | Island Heights | 3407710 | 21 | 34029 | NJ | 120 | 1,690 | 133 |
| Jackson Township School District | Jackson | 3407740 | 21 | 34029 | NJ | 9,224 | 55,514 | 10,750 |
| Jamesburg Public Schools | Jamesburg | 3407770 | 21 | 34023 | NJ | 664 | 6,054 | 983 |
| Jefferson Township | Lake Hopatcong | 3407800 | 41 | 34027 | NJ | 3,398 | 21,619 | 3,845 |
| Jersey City Public Schools | Jersey City | 3407830 | 11 | 34017 | NJ | 27,028 | 257,796 | 34,900 |
| Keansburg School District | Keansburg | 3407860 | 21 | 34025 | NJ | 1,689 | 10,094 | 1,601 |
| Kearny | Kearny | 3407890 | 21 | 34017 | NJ | 5,974 | 42,352 | 6,207 |
| Kenilworth Public Schools | Kenilworth | 3407920 | 21 | 34039 | NJ | 1,375 | 8,087 | 1,332 |
| Keyport Board of Education | Keyport | 3407950 | 21 | 34025 | NJ | 1,092 | 7,232 | 943 |
| Kingwood Township School | Frenchtown | 3408010 | 41 | 34019 | NJ | 409 | 3,810 | 426 |
| Kinnelon Board of Education | Kinnelon | 3408040 | 21 | 34027 | NJ | 2,086 | 10,396 | 2,267 |
| Kittatinny Regional School District | Newton | 3408060 | 41 | 34037 | NJ | 1,103 | 14,391 | 1,230 |
| Lacey Township School District | Lanoka Harbor | 3408100 | 21 | 34029 | NJ | 4,569 | 27,972 | 4,940 |
| Lafayette Township School District | Lafayette | 3408130 | 41 | 34037 | NJ | 253 | 2,476 | 284 |
| Lake Como | Belmar | 3415150 | 21 | 34025 | NJ | 5 | 1,757 | 235 |
| Lakehurst Elementary School District | Lakehurst | 3408160 | 21 | 34029 | NJ | 425 | 2,686 | 567 |
| Lakeland Regional High School District | Wanaque | 3408190 | 21 | 34031 | NJ | 1,078 | 23,531 | 1,303 |
| Lakewood Township | Lakewood | 3408220 | 13 | 34029 | NJ | 5,238 | 93,940 | 23,019 |
| Lambertville Public School | Lambertville | 3408250 | 21 | 34019 | NJ | 235 | 3,877 | 178 |
| Lavallette Borough Board of Education | Lavallette | 3408310 | 21 | 34029 | NJ | 162 | 1,897 | 177 |
| Lebanon Borough School District | Lebanon Borough | 3408430 | 21 | 34019 | NJ | 76 | 1,346 | 120 |
| Lebanon Township School District | Califon | 3408460 | 41 | 34019 | NJ | 716 | 6,531 | 729 |
| Lenape Valley Regional High School | Stanhope | 3408500 | 21 | 34037 | NJ | 778 | 15,008 | 839 |
| Leonia Public Schools | Leonia | 3408520 | 21 | 34003 | NJ | 1,831 | 9,146 | 1,588 |
| Lincoln Park School District | Lincoln Park | 3408580 | 21 | 34027 | NJ | 918 | 10,673 | 1,376 |
| Linden City Board of Education | Linden | 3408610 | 21 | 34039 | NJ | 5,994 | 41,387 | 6,624 |
| Little Egg Harbor Township School District | Little Egg Harbor | 3408700 | 31 | 34029 | NJ | 1,762 | 20,301 | 1,573 |
| Little Falls Township Public School District | Little Falls | 3408730 | 21 | 34031 | NJ | 795 | 14,548 | 966 |
| Little Ferry Public Schools | Little Ferry | 3408760 | 21 | 34003 | NJ | 993 | 10,869 | 1,490 |
| Little Silver Boro School District | Little Silver | 3408790 | 21 | 34025 | NJ | 833 | 5,943 | 860 |
| Livingston Public Schools | Livingston | 3408820 | 21 | 34013 | NJ | 5,784 | 29,570 | 6,153 |
| Lodi Public Schools | Lodi | 3408850 | 21 | 34003 | NJ | 3,312 | 24,675 | 3,671 |
| Long Beach Island Consolidated School District | Ship Bottom | 3408910 | 21 | 34029 | NJ | 247 | 6,395 | 236 |
| Long Branch Public Schools | Long Branch | 3408940 | 21 | 34025 | NJ | 5,426 | 30,685 | 4,211 |
| Long Hill Township School District | Gillette | 3412660 | 21 | 34027 | NJ | 860 | 8,828 | 1,141 |
| Lyndhurst School District | Lyndhurst | 3409210 | 21 | 34003 | NJ | 2,290 | 21,013 | 2,771 |
| Madison Public Schools | Madison | 3409240 | 21 | 34027 | NJ | 2,399 | 16,048 | 2,718 |
| Mahwah Township Public Schools | Mahwah | 3409330 | 21 | 34003 | NJ | 3,223 | 26,468 | 4,046 |
| Manalapan-Englishtown Regional Schools | Englishtown | 3409390 | 21 | 34025 | NJ | 5,107 | 40,673 | 5,146 |
| Manasquan School District | Manasquan | 3409420 | 21 | 34025 | NJ | 1,625 | 5,890 | 1,041 |
| Manchester Township School District | Whiting | 3409450 | 21 | 34029 | NJ | 3,120 | 43,582 | 3,347 |
| Manville Board of Education | Manville | 3409630 | 21 | 34035 | NJ | 1,303 | 10,572 | 1,387 |
| Marlboro Township Board of Education | Marlboro | 3409720 | 21 | 34025 | NJ | 5,367 | 40,146 | 6,137 |
| Matawan-Aberdeen Regional School District | Aberdeen | 3409750 | 21 | 34025 | NJ | 3,781 | 26,988 | 4,144 |
| Maywood Board of Education | Maywood | 3409810 | 21 | 34003 | NJ | 957 | 9,768 | 1,431 |
| Mendham Borough | Mendham | 3409900 | 21 | 34027 | NJ | 640 | 5,053 | 712 |
| Mendham Township Board of Education | Brookside | 3409930 | 21 | 34027 | NJ | 786 | 5,938 | 962 |
| Metuchen Public Schools | Metuchen | 3409990 | 21 | 34023 | NJ | 2,117 | 13,893 | 2,392 |
| Middlesex Borough Public Schools | Middlesex | 3410050 | 21 | 34023 | NJ | 2,147 | 13,956 | 2,293 |
| Middletown Township Public Schools | Leonardo | 3410110 | 21 | 34025 | NJ | 9,885 | 66,435 | 11,810 |
| Midland Park Public Schools | Midland Park | 3410140 | 21 | 34003 | NJ | 1,061 | 7,287 | 1,333 |
| Milford Boro | Milford | 3410170 | 31 | 34019 | NJ | 117 | 1,222 | 105 |
| Millburn Township Schools | Millburn | 3410200 | 21 | 34013 | NJ | 4,931 | 20,263 | 5,160 |
| Millstone Township | Millstone Township | 3410230 | 21 | 34025 | NJ | 922 | 10,554 | 2,420 |
| Milltown Borough Public Schools | Milltown | 3410290 | 21 | 34023 | NJ | 641 | 7,055 | 1,095 |
| Mine Hill Township | Mine Hill | 3410350 | 21 | 34027 | NJ | 414 | 3,696 | 596 |
| Monmouth Beach Elementary School | Monmouth Beach | 3410380 | 21 | 34025 | NJ | 299 | 3,275 | 334 |
| Monmouth Regional | Tinton Falls | 3410440 | 21 | 34025 | NJ | 1,025 | 31,706 | 1,399 |
| Monroe Township Board of Education | Monroe Township | 3410500 | 41 | 34023 | NJ | 6,044 | 40,053 | 5,688 |
| Montague Township School District | Montague | 3410530 | 41 | 34037 | NJ | 264 | 3,797 | 596 |
| Montclair Public Schools | Montclair | 3410560 | 21 | 34013 | NJ | 6,674 | 37,944 | 7,272 |
| Montgomery Township School District | Skillman | 3410590 | 21 | 34035 | NJ | 4,882 | 23,446 | 5,762 |
| Montvale Board of Education | Montvale | 3410620 | 21 | 34003 | NJ | 1,069 | 8,019 | 1,121 |
| Montville Township School District | Montville | 3410650 | 21 | 34027 | NJ | 4,026 | 21,835 | 4,323 |
| Moonachie | Moonachie | 3410680 | 21 | 34003 | NJ | 285 | 2,762 | 385 |
| Morris Hills Regional District | Rockaway | 3410740 | 21 | 34027 | NJ | 2,783 | 54,594 | 3,136 |
| Morris Plains School District | Morris Plains | 3410770 | 21 | 34027 | NJ | 614 | 5,612 | 984 |
| Morris School District | Morristown | 3410810 | 21 | 34027 | NJ | 5,024 | 41,347 | 5,657 |
| Mount Arlington Public School District | Mount Arlington | 3410860 | 21 | 34027 | NJ | 360 | 5,123 | 645 |
| Mount Olive Township School District | Budd Lake | 3410980 | 21 | 34027 | NJ | 4,602 | 28,515 | 5,393 |
| Mountain Lakes Board of Education | Mt Lakes | 3411010 | 21 | 34027 | NJ | 1,584 | 4,220 | 1,208 |
| Mountainside School District | Mountainside | 3411040 | 21 | 34039 | NJ | 777 | 6,831 | 1,195 |
| Neptune City | Neptune City | 3411130 | 21 | 34025 | NJ | 403 | 4,864 | 611 |
| Neptune Township School District | Neptune Twp | 3411160 | 21 | 34025 | NJ | 4,447 | 27,904 | 4,104 |
| Netcong Elementary School | Netcong | 3411190 | 21 | 34027 | NJ | 315 | 3,279 | 273 |
| New Brunswick Public Schools | New Brunswick | 3411220 | 13 | 34023 | NJ | 7,902 | 55,862 | 7,599 |
| New Milford School District | New Milford | 3411280 | 21 | 34003 | NJ | 2,055 | 16,706 | 2,552 |
| New Providence Board of Education | New Providence | 3411310 | 21 | 34039 | NJ | 2,265 | 12,438 | 2,457 |
| Newton Public Schools | Newton | 3411400 | 31 | 34037 | NJ | 1,361 | 7,973 | 1,120 |
| North Arlington School District | North Arlington | 3411430 | 21 | 34003 | NJ | 1,694 | 15,736 | 1,927 |
| North Bergen School District | North Bergen | 3411460 | 21 | 34017 | NJ | 8,075 | 63,264 | 9,250 |
| North Brunswick Township Public Schools | North Brunswick | 3411490 | 21 | 34023 | NJ | 6,097 | 42,321 | 6,530 |
| North Caldwell Board of Education | North Caldwell | 3411520 | 21 | 34013 | NJ | 682 | 6,200 | 689 |
| North Haledon School District | North Haledon | 3411550 | 21 | 34031 | NJ | 727 | 8,485 | 845 |
| North Hunterdon-Voorhees Regional High School District | Annandale | 3411610 | 21 | 34019 | NJ | 2,904 | 50,606 | 3,005 |
| North Plainfield Boro | North Plainfield | 3411640 | 21 | 34035 | NJ | 3,265 | 22,421 | 3,651 |
| Northern Highlands Regional High School | Allendale | 3411730 | 21 | 34003 | NJ | 1,328 | 15,042 | 1,177 |
| Northern Valley Regional High School | Demarest | 3411760 | 21 | 34003 | NJ | 2,557 | 38,236 | 2,937 |
| Northvale Public School | Northvale | 3411820 | 21 | 34003 | NJ | 531 | 4,744 | 600 |
| Norwood Public School | Norwood | 3411850 | 21 | 34003 | NJ | 588 | 5,839 | 731 |
| Nutley Public School District | Nutley | 3411880 | 21 | 34013 | NJ | 4,030 | 28,572 | 4,279 |
| Oakland Board of Education | Oakland | 3411910 | 21 | 34003 | NJ | 1,620 | 13,040 | 1,820 |
| Ocean Gate School District | Ocean Gate | 3412030 | 21 | 34029 | NJ | 161 | 2,040 | 168 |
| Ocean Township School District | Waretown | 3412090 | 41 | 34029 | NJ | 542 | 8,431 | 1,008 |
| Oceanport School District | Oceanport | 3412120 | 21 | 34025 | NJ | 630 | 7,236 | 741 |
| Ogdensburg Borough School District | Ogdensburg | 3412150 | 31 | 34037 | NJ | 306 | 2,340 | 282 |
| Old Bridge Township School District | Matawan | 3409270 | 21 | 34023 | NJ | 9,106 | 66,916 | 11,031 |
| Old Tappan Public School District | Old Tappan | 3412180 | 21 | 34003 | NJ | 751 | 5,878 | 890 |
| Oradell School District | Oradell | 3412240 | 21 | 34003 | NJ | 757 | 8,156 | 875 |
| Orange Board of Education | Orange | 3412270 | 21 | 34013 | NJ | 4,699 | 30,467 | 5,113 |
| Palisades Park Board of Education | Palisades Park | 3412360 | 21 | 34003 | NJ | 1,583 | 20,060 | 1,981 |
| Paramus Public Schools | Paramus | 3412420 | 21 | 34003 | NJ | 3,948 | 26,930 | 4,606 |
| Park Ridge Public Schools | Park Ridge | 3412450 | 21 | 34003 | NJ | 1,293 | 8,841 | 1,565 |
| Parsippany-Troy Hills Township Schools | Parsippany | 3412480 | 21 | 34027 | NJ | 7,166 | 53,976 | 7,763 |
| Pascack Valley Regional High School District | Montvale | 3412510 | 21 | 34003 | NJ | 2,040 | 34,196 | 2,339 |
| Passaic City Public Schools | Passaic | 3412540 | 21 | 34031 | NJ | 13,602 | 70,344 | 14,788 |
| Passaic Co Manchester Regional High School District | Haledon | 3412600 | 21 | 34031 | NJ | 902 | 22,790 | 1,274 |
| Passaic Valley Regional High School District #1 | Little Falls | 3412570 | 21 | 34031 | NJ | 1,389 | 37,354 | 1,464 |
| Paterson Public Schools | Paterson | 3412690 | 21 | 34031 | NJ | 24,571 | 147,379 | 28,551 |
| Pequannock Township School District | Pompton Plains | 3412900 | 21 | 34027 | NJ | 2,239 | 15,765 | 2,572 |
| Perth Amboy Public Schools | Perth Amboy | 3412930 | 21 | 34023 | NJ | 10,278 | 52,010 | 9,781 |
| Pinelands Regional Board of Education | Little Egg Harbor | 3413000 | 41 | 34029 | NJ | 1,665 | 26,762 | 2,012 |
| Piscataway Township Schools | Piscataway | 3413050 | 21 | 34023 | NJ | 7,362 | 57,361 | 7,889 |
| Plainfield Public Schools | Plainfield | 3413140 | 21 | 34039 | NJ | 6,757 | 50,900 | 8,747 |
| Plumsted Township Board of Education | New Egypt | 3413230 | 41 | 34029 | NJ | 1,629 | 8,521 | 1,808 |
| Point Pleasant Beach Board of Education | Point Pleasant Beach | 3413320 | 21 | 34029 | NJ | 827 | 5,020 | 740 |
| Point Pleasant Borough Board of Education | Point Pleasant | 3413290 | 21 | 34029 | NJ | 2,943 | 18,610 | 3,198 |
| Pompton Lakes Boro | Pompton Lakes | 3413350 | 21 | 34031 | NJ | 1,699 | 11,187 | 1,808 |
| Prospect Park | Prospect Park | 3413470 | 21 | 34031 | NJ | 901 | 5,912 | 849 |
| Rahway Public School District | Rahway | 3413530 | 21 | 34039 | NJ | 3,717 | 27,945 | 4,369 |
| Ramapo Indian Hills Regional High School District | Oakland | 3413560 | 21 | 34003 | NJ | 2,312 | 40,922 | 2,913 |
| Ramsey Public Schools | Ramsey | 3413590 | 21 | 34003 | NJ | 2,907 | 14,796 | 3,061 |
| Randolph Township Schools | Randolph | 3413650 | 21 | 34027 | NJ | 5,067 | 26,059 | 5,535 |
| Readington Township Public School District | Whitehouse Station | 3413710 | 41 | 34019 | NJ | 1,848 | 15,987 | 2,007 |
| Red Bank Borough Public Schools | Red Bank | 3413740 | 21 | 34025 | NJ | 1,134 | 12,192 | 1,079 |
| Red Bank Regional | Little Silver | 3413750 | 21 | 34025 | NJ | 1,189 | 21,940 | 1,067 |
| Ridgefield Park Township | Ridgefield Park | 3413800 | 21 | 34003 | NJ | 2,327 | 13,013 | 2,117 |
| Ridgefield Public Schools | Ridgefield | 3413770 | 21 | 34003 | NJ | 1,763 | 11,278 | 1,813 |
| Ridgewood Public Schools | Ridgewood | 3413830 | 21 | 34003 | NJ | 5,759 | 25,515 | 6,087 |
| Ringwood School District | Ringwood | 3413860 | 21 | 34031 | NJ | 1,238 | 12,327 | 1,543 |
| River Dell Regional School District | River Edge | 3412260 | 21 | 34003 | NJ | 1,652 | 19,749 | 1,834 |
| River Edge Schools | River Edge | 3413890 | 21 | 34003 | NJ | 1,167 | 11,593 | 1,234 |
| River Vale Publc Schools | River Vale | 3413950 | 21 | 34003 | NJ | 1,291 | 9,875 | 1,427 |
| Riverdale School District | Riverdale | 3413980 | 21 | 34027 | NJ | 336 | 3,610 | 427 |
| Rochelle Park School District | Rochelle Park | 3414070 | 21 | 34003 | NJ | 442 | 5,653 | 718 |
| Rockaway Borough Public Schools | Rockaway | 3414100 | 21 | 34027 | NJ | 662 | 6,531 | 701 |
| Rockaway Township School District | Hibernia | 3414130 | 21 | 34027 | NJ | 2,426 | 24,510 | 2,808 |
| Rockleigh | Midland Park | 3414160 | 21 | 34003 | NJ | ... | 543 | 76 |
| Roosevelt Public School District | Roosevelt | 3414220 | 41 | 34025 | NJ | 74 | 881 | 151 |
| Roseland School District | Roseland | 3414250 | 21 | 34013 | NJ | 455 | 5,856 | 517 |
| Roselle Park Board of Education | Roselle Park | 3414310 | 21 | 34039 | NJ | 1,966 | 13,588 | 2,194 |
| Roselle Public Schools | Roselle | 3414280 | 21 | 34039 | NJ | 2,677 | 21,547 | 3,584 |
| Roxbury Township Public Schools | Succasunna | 3414340 | 21 | 34027 | NJ | 3,901 | 23,661 | 4,340 |
| Rumson Borough | Rumson | 3414370 | 21 | 34025 | NJ | 983 | 7,114 | 1,191 |
| Rumson-Fair Haven Regional High School | Rumson | 3414400 | 21 | 34025 | NJ | 897 | 13,228 | 1,078 |
| Rutherford Public Schools | Rutherford | 3414460 | 21 | 34003 | NJ | 2,493 | 18,464 | 2,861 |
| Saddle Brook Township Board of Education | Saddle Brook | 3414490 | 21 | 34003 | NJ | 1,681 | 13,964 | 2,038 |
| Saddle River School District | Saddle River | 3414520 | 21 | 34003 | NJ | 206 | 3,222 | 551 |
| Sandyston-Walpack Consolidated School | Layton | 3414610 | 42 | 34037 | NJ | 149 | 1,951 | 144 |
| Sayreville Public Schools | South Amboy | 3414640 | 21 | 34023 | NJ | 5,964 | 43,707 | 6,791 |
| Scotch Plains-Fanwood School District | Scotch Plains | 3414670 | 21 | 34039 | NJ | 5,490 | 31,504 | 6,034 |
| Sea Girt Borough Public Schools | Sea Girt | 3414730 | 21 | 34025 | NJ | 171 | 1,826 | 269 |
| Seaside Heights School District | Seaside Heights | 3414790 | 21 | 34029 | NJ | 230 | 2,921 | 200 |
| Seaside Park Borough | Seaside Park | 3414820 | 21 | 34029 | NJ | ... | 1,598 | 59 |
| Secaucus Board of Education | Secaucus | 3414850 | 21 | 34017 | NJ | 2,199 | 16,927 | 2,269 |
| Shore Regional High School District | West Long Branch | 3414940 | 21 | 34025 | NJ | 661 | 18,599 | 993 |
| Shrewsbury Borough School District | Shrewsbury | 3414970 | 21 | 34025 | NJ | 481 | 3,805 | 504 |
| Somerset Hills Regional School District | Bernardsville | 3400009 | 21 | 34035 | NJ | 2,021 | 11,449 | 2,414 |
| Somerville Public Schools | Somerville | 3415090 | 21 | 34035 | NJ | 2,514 | 12,365 | 1,694 |
| South Amboy School District | South Amboy | 3415120 | 21 | 34023 | NJ | 1,142 | 8,836 | 1,267 |
| South Bound Brook Public Schools | South Bound Brook | 3415180 | 21 | 34035 | NJ | 445 | 4,664 | 628 |
| South Brunswick Public Schools | North Brunswick | 3415210 | 21 | 34023 | NJ | 8,869 | 44,439 | 9,483 |
| South Hackensack | South Hackensack | 3415240 | 21 | 34003 | NJ | 255 | 2,431 | 371 |
| South Hunterdon Regional | Lambertville | 3415300 | 41 | 34019 | NJ | 402 | 7,231 | 381 |
| South Orange-Maplewood School District | Maplewood | 3415330 | 21 | 34013 | NJ | 6,600 | 40,352 | 7,463 |
| South Plainfield Public Schools | South Plainfield | 3415360 | 21 | 34023 | NJ | 3,565 | 23,935 | 4,037 |
| South River Public Schools | South River | 3415390 | 21 | 34023 | NJ | 2,338 | 16,385 | 2,590 |
| Southern Regional School District | Manahawkin | 3415480 | 21 | 34029 | NJ | 3,060 | 34,432 | 2,749 |
| Sparta Township Public Schools | Sparta | 3415510 | 41 | 34037 | NJ | 3,367 | 19,342 | 4,187 |
| Spotswood Public Schools | Spotswood | 3415540 | 21 | 34023 | NJ | 1,797 | 10,681 | 1,587 |
| Spring Lake Borough | Spring Lake | 3415570 | 21 | 34025 | NJ | 261 | 2,990 | 478 |
| Spring Lake Heights School District | Spring Lake Heights | 3415600 | 21 | 34025 | NJ | 366 | 4,708 | 605 |
| Springfield Public Schools | Springfield | 3415630 | 21 | 34039 | NJ | 2,231 | 16,164 | 2,391 |
| Stafford Township School District | Manahawkin | 3415690 | 21 | 34029 | NJ | 2,224 | 26,850 | 2,446 |
| Stanhope | Stanhope | 3415720 | 21 | 34037 | NJ | 356 | 3,540 | 367 |
| Stillwater Township School | Stillwater | 3415750 | 41 | 34037 | NJ | 352 | 4,020 | 344 |
| Stockton Borough School District | Stockton | 3415780 | 41 | 34019 | NJ | 1 | 533 | 40 |
| Summit Public Schools | Summit | 3415900 | 21 | 34039 | NJ | 4,121 | 21,927 | 4,791 |
| Sussex-Wantage Regional School District | Sussex | 3415960 | 41 | 34037 | NJ | 1,310 | 13,227 | 1,609 |
| Teaneck Public School | Teaneck | 3416080 | 21 | 34003 | NJ | 3,732 | 40,685 | 7,318 |
| Tenafly Public Schools | Tenafly | 3416110 | 21 | 34003 | NJ | 3,602 | 14,812 | 3,779 |
| Tewksbury Township School District | Califon | 3416170 | 41 | 34019 | NJ | 695 | 5,941 | 834 |
| The Newark Public Schools | Newark | 3411340 | 11 | 34013 | NJ | 35,588 | 279,121 | 49,059 |
| The School District of The Chathams | Chatham | 3400004 | 21 | 34027 | NJ | 4,111 | 19,687 | 4,408 |
| Tinton Falls School District | Tinton Falls | 3416200 | 21 | 34025 | NJ | 1,532 | 19,012 | 1,723 |
| Toms River Regional School District | Toms River | 3416230 | 21 | 34029 | NJ | 16,760 | 109,378 | 18,399 |
| Totowa Public Schools | Totowa | 3416260 | 21 | 34031 | NJ | 1,015 | 10,891 | 1,077 |
| Township of Ocean Schools | Oakhurst | 3412060 | 21 | 34025 | NJ | 3,822 | 27,454 | 4,514 |
| Tuckerton Borough School District | Tuckerton | 3416320 | 31 | 34029 | NJ | 341 | 3,387 | 263 |
| Twp of Union Board of Education | Union | 3416500 | 21 | 34039 | NJ | 7,510 | 57,883 | 8,905 |
| Union Beach Public School District | Union Beach | 3416350 | 21 | 34025 | NJ | 730 | 6,238 | 1,067 |
| Union City School District | Union City | 3416380 | 21 | 34017 | NJ | 11,107 | 69,163 | 10,920 |
| Union Township School | Hampton | 3416440 | 41 | 34019 | NJ | 469 | 5,857 | 532 |
| Upper Freehold Regional School District | Allentown | 3416560 | 21 | 34025 | NJ | 2,352 | 8,720 | 1,763 |
| Upper Saddle River School District | Upper Saddle River | 3416620 | 21 | 34003 | NJ | 1,339 | 8,391 | 1,428 |
| Vernon Township School District | Vernon | 3416710 | 41 | 34037 | NJ | 3,630 | 23,087 | 4,109 |
| Verona Public Schools | Verona | 3416740 | 21 | 34013 | NJ | 2,177 | 13,433 | 2,283 |
| Waldwick School District | Waldwick | 3416860 | 21 | 34003 | NJ | 1,613 | 9,853 | 1,797 |
| Wall Township Public Schools | Wall | 3416890 | 21 | 34025 | NJ | 3,815 | 26,135 | 4,689 |
| Wallington Boro | Wallington | 3416920 | 21 | 34003 | NJ | 1,194 | 11,588 | 1,367 |
| Wallkill Valley Regional High School | Hardyston Township | 3416870 | 41 | 34037 | NJ | 695 | 18,583 | 917 |
| Wanaque Public Schools | Haskell | 3416950 | 21 | 34031 | NJ | 948 | 11,205 | 1,129 |
| Warren Township Schools | Warren | 3416980 | 21 | 34035 | NJ | 2,015 | 15,649 | 2,382 |
| Washington Township | Long Valley | 3417130 | 21 | 34027 | NJ | 2,470 | 18,805 | 2,785 |
| Watchung Borough Public School District | Watchung | 3417190 | 21 | 34035 | NJ | 713 | 5,929 | 704 |
| Watchung Hills Regional High School | Warren | 3417220 | 21 | 34035 | NJ | 2,149 | 30,406 | 2,047 |
| Wayne Township Public Schools | Wayne | 3417280 | 21 | 34031 | NJ | 8,381 | 55,150 | 9,398 |
| Weehawken Board of Education | Weehawken | 3417310 | 21 | 34017 | NJ | 1,261 | 13,069 | 1,397 |
| West Amwell Township School | Lambertville | 3417370 | 41 | 34019 | NJ | 232 | 2,820 | 253 |
| West Essex Regional School District | North Caldwell | 3417460 | 21 | 34013 | NJ | 1,629 | 21,704 | 1,919 |
| West Long Branch Board of Education | West Long Branch | 3417490 | 21 | 34025 | NJ | 600 | 8,088 | 768 |
| West Milford Township Public Schools | West Milford | 3417520 | 41 | 34031 | NJ | 3,692 | 26,461 | 4,415 |
| West Morris Regional High School District | Chester | 3417550 | 21 | 34027 | NJ | 2,781 | 39,443 | 3,144 |
| West New York Board of Education | West New York | 3417580 | 21 | 34017 | NJ | 7,854 | 51,746 | 6,758 |
| West Orange Public Schools | West Orange | 3417610 | 21 | 34013 | NJ | 6,836 | 46,568 | 7,748 |
| Westfield Public Schools | Westfield | 3417760 | 21 | 34039 | NJ | 6,315 | 30,980 | 7,116 |
| Westwood Regional School District | Township Of Washington | 3417820 | 21 | 34003 | NJ | 2,673 | 20,457 | 3,284 |
| Wharton Borough Board of Education | Wharton | 3417880 | 21 | 34027 | NJ | 786 | 6,632 | 748 |
| Winfield Township | Winfield Twp | 3418030 | 21 | 34039 | NJ | 158 | 1,503 | 197 |
| Wood-Ridge Board of Education | Wood-Ridge | 3418300 | 21 | 34003 | NJ | 1,141 | 7,796 | 1,261 |
| Woodbridge Township School District | Woodbridge | 3418120 | 21 | 34023 | NJ | 13,280 | 101,923 | 15,237 |
| Woodcliff Lake School District | Woodcliff Lake | 3418210 | 21 | 34003 | NJ | 665 | 5,851 | 864 |
| Woodland Park Public Schools | Woodland Park | 3417640 | 21 | 34031 | NJ | 1,125 | 11,914 | 1,145 |
| Wyckoff Township Public Schools | Wyckoff | 3418360 | 21 | 34003 | NJ | 2,226 | 17,056 | 2,558 |
| Amagansett Union Free School District | Amagansett | 3602880 | 31 | 36103 | NY | 115 | 1,371 | 175 |
| Amityville Union Free School District | Amityville | 3602940 | 21 | 36103 | NY | 3,087 | 26,355 | 3,864 |
| Ardsley Union Free School District | Ardsley | 3603180 | 21 | 36119 | NY | 2,019 | 9,815 | 2,028 |
| Arlington Central School District | Lagrangeville | 3603270 | 21 | 36027 | NY | 9,180 | 57,977 | 10,003 |
| Babylon Union Free School District | Babylon | 3603720 | 21 | 36103 | NY | 1,692 | 11,847 | 1,857 |
| Baldwin Union Free School District | Baldwin | 3603840 | 21 | 36059 | NY | 4,967 | 33,142 | 5,917 |
| Bay Shore Union Free School District | Bay Shore | 3604080 | 21 | 36103 | NY | 6,162 | 33,514 | 5,859 |
| Bayport-Blue Point Union Free School District | Bayport | 3604110 | 21 | 36103 | NY | 2,439 | 14,025 | 2,553 |
| Beacon City School District | Beacon | 3604140 | 21 | 36027 | NY | 3,250 | 27,234 | 3,390 |
| Bedford Central School District | Bedford | 3619950 | 41 | 36119 | NY | 4,471 | 29,238 | 5,304 |
| Bellmore Union Free School District | Bellmore | 3604410 | 21 | 36059 | NY | 1,063 | 12,655 | 1,129 |
| Bellmore-Merrick Central High School District | North Merrick | 3619020 | 21 | 36059 | NY | 5,870 | 71,299 | 6,467 |
| Bethpage Union Free School District | Bethpage | 3604740 | 21 | 36059 | NY | 2,943 | 19,344 | 3,179 |
| Blind Brook-Rye Union Free School District | Rye Brook | 3624630 | 21 | 36119 | NY | 1,470 | 6,537 | 1,546 |
| Brentwood Union Free School District | Brentwood | 3605280 | 21 | 36103 | NY | 17,492 | 87,626 | 15,776 |
| Brewster Central School District | Brewster | 3605310 | 41 | 36079 | NY | 3,292 | 22,116 | 3,699 |
| Briarcliff Manor Union Free School District | Briarcliff Manor | 3605340 | 21 | 36119 | NY | 1,555 | 7,997 | 1,665 |
| Bridgehampton Union Free School District | Bridgehampton | 3605370 | 41 | 36103 | NY | 151 | 1,526 | 164 |
| Bronxville Union Free School District | Bronxville | 3605640 | 21 | 36119 | NY | 1,628 | 6,454 | 1,545 |
| Brookhaven-Comsewogue Union Free School District | Port Jefferson Sta | 3615780 | 21 | 36103 | NY | 3,887 | 23,854 | 3,918 |
| Byram Hills Central School District | Armonk | 3606060 | 41 | 36119 | NY | 2,644 | 11,661 | 2,924 |
| Carle Place Union Free School District | Carle Place | 3606540 | 21 | 36059 | NY | 1,400 | 9,503 | 1,456 |
| Carmel Central School District | Patterson | 3606570 | 21 | 36079 | NY | 4,428 | 30,264 | 4,888 |
| Center Moriches Union Free School District | Center Moriches | 3606840 | 21 | 36103 | NY | 1,678 | 7,578 | 1,356 |
| Central Islip Union Free School District | Central Islip | 3606870 | 21 | 36103 | NY | 6,630 | 37,543 | 6,495 |
| Chappaqua Central School District | Chappaqua | 3606990 | 21 | 36119 | NY | 3,960 | 16,439 | 4,227 |
| Chester Union Free School District | Chester | 3607380 | 41 | 36071 | NY | 993 | 6,496 | 1,124 |
| Clarkstown Central School District | New City | 3620340 | 21 | 36087 | NY | 8,671 | 49,961 | 9,648 |
| Cold Spring Harbor Central School District | Cold Spring Harbor | 3608010 | 21 | 36103 | NY | 1,937 | 8,598 | 2,118 |
| Commack Union Free School District | East Northport | 3608130 | 21 | 36103 | NY | 7,185 | 37,613 | 7,512 |
| Connetquot Central School District | Bohemia | 3608160 | 21 | 36103 | NY | 6,374 | 40,316 | 6,614 |
| Copiague Union Free School District | Copiague | 3608310 | 21 | 36103 | NY | 4,829 | 30,636 | 4,867 |
| Cornwall Central School District | Cornwall On Hudson | 3608430 | 21 | 36071 | NY | 3,368 | 16,987 | 3,570 |
| Croton-Harmon Union Free School District | Croton On Hudson | 3608580 | 21 | 36119 | NY | 1,684 | 9,650 | 1,910 |
| Deer Park Union Free School District | Deer Park | 3608880 | 21 | 36103 | NY | 4,404 | 25,870 | 4,278 |
| Dobbs Ferry Union Free School District | Dobbs Ferry | 3609120 | 21 | 36119 | NY | 1,466 | 9,696 | 1,804 |
| Dover Union Free School District | Dover Plains | 3609210 | 41 | 36027 | NY | 1,472 | 10,238 | 1,641 |
| East Hampton Union Free School District | East Hampton | 3609660 | 31 | 36103 | NY | 1,856 | 8,577 | 1,201 |
| East Islip Union Free School District | Islip Terrace | 3609720 | 21 | 36103 | NY | 4,359 | 25,284 | 4,763 |
| East Meadow Union Free School District | Westbury | 3609840 | 21 | 36059 | NY | 7,172 | 52,586 | 7,955 |
| East Moriches Union Free School District | East Moriches | 3609870 | 21 | 36103 | NY | 755 | 5,780 | 1,005 |
| East Quogue Union Free School District | East Quogue | 3609900 | 21 | 36103 | NY | 424 | 4,663 | 827 |
| East Ramapo Central School District (Spring Valley) | Spring Valley | 3627810 | 21 | 36087 | NY | 8,109 | 116,373 | 28,224 |
| East Rockaway Union Free School District | East Rockaway | 3609960 | 21 | 36059 | NY | 1,251 | 9,858 | 1,464 |
| East Williston Union Free School District | Old Westbury | 3610050 | 21 | 36059 | NY | 1,736 | 8,916 | 1,947 |
| Eastchester Union Free School District | Eastchester | 3610080 | 21 | 36119 | NY | 3,141 | 18,988 | 3,267 |
| Eastport-South Manor Csd | Manorville | 3600125 | 21 | 36103 | NY | 3,743 | 19,010 | 3,842 |
| Edgemont Union Free School District | Scarsdale | 3610200 | 21 | 36119 | NY | 1,911 | 7,609 | 1,796 |
| Elmont Union Free School District | Elmont | 3610620 | 21 | 36059 | NY | 3,924 | 50,662 | 4,188 |
| Elmsford Union Free School District | Elmsford | 3610650 | 21 | 36119 | NY | 1,016 | 7,883 | 1,243 |
| Elwood Union Free School District | Greenlawn | 3610680 | 21 | 36103 | NY | 2,479 | 13,410 | 2,690 |
| Farmingdale Union Free School District | Farmingdale | 3610980 | 21 | 36059 | NY | 6,024 | 40,251 | 6,401 |
| Fire Island Union Free School District | Ocean Beach | 3621540 | 21 | 36103 | NY | 35 | 413 | 46 |
| Fishers Island Union Free School District | Fishers Island | 3611100 | 41 | 36103 | NY | 61 | 237 | 32 |
| Floral Park-Bellerose Union Free School District | Floral Park | 3611160 | 21 | 36059 | NY | 1,488 | 20,264 | 1,750 |
| Florida Union Free School District | Florida | 3625320 | 31 | 36071 | NY | 832 | 5,028 | 960 |
| Franklin Square Union Free School District | Franklin Square | 3611460 | 21 | 36059 | NY | 1,903 | 25,209 | 1,998 |
| Freeport Union Free School District | Freeport | 3611550 | 21 | 36059 | NY | 6,731 | 40,338 | 6,513 |
| Garden City Union Free School District | Garden City | 3611760 | 21 | 36059 | NY | 3,993 | 22,570 | 4,546 |
| Garrison Union Free School District | Garrison | 3611860 | 41 | 36079 | NY | 223 | 2,726 | 390 |
| Glen Cove City School District | Glen Cove | 3612180 | 21 | 36059 | NY | 3,207 | 27,214 | 3,843 |
| Goshen Central School District | Goshen | 3612330 | 23 | 36071 | NY | 2,858 | 18,198 | 3,317 |
| Great Neck Union Free School District | Great Neck | 3612510 | 21 | 36059 | NY | 6,563 | 44,991 | 7,541 |
| Greenburgh Central School District | Hartsdale | 3612720 | 21 | 36119 | NY | 1,812 | 22,253 | 2,669 |
| Greenport Union Free School District | Greenport | 3612840 | 31 | 36103 | NY | 625 | 4,503 | 487 |
| Greenwood Lake Union Free School District | Monroe | 3612960 | 41 | 36071 | NY | 529 | 6,235 | 919 |
| Haldane Central School District | Cold Spring | 3613230 | 31 | 36079 | NY | 883 | 5,415 | 865 |
| Half Hollow Hills Central School District | Dix Hills | 3613290 | 21 | 36103 | NY | 9,427 | 48,766 | 9,894 |
| Hampton Bays Union Free School District | Hampton Bays | 3613530 | 21 | 36103 | NY | 2,074 | 13,192 | 1,966 |
| Harborfields Central School District | Greenlawn | 3613620 | 21 | 36103 | NY | 3,418 | 18,802 | 3,712 |
| Harrison Central School District | Harrison | 3613740 | 21 | 36119 | NY | 3,520 | 28,041 | 4,863 |
| Hastings-On-Hudson Union Free School District | Hastings On Hudson | 3613950 | 21 | 36119 | NY | 1,574 | 8,691 | 1,754 |
| Hauppauge Union Free School District | Hauppauge | 3613980 | 21 | 36103 | NY | 3,975 | 23,582 | 4,097 |
| Haverstraw-Stony Point Csd (North Rockland) | Garnerville | 3614010 | 21 | 36087 | NY | 7,861 | 49,187 | 8,861 |
| Hempstead Union Free School District | Hempstead | 3614130 | 21 | 36059 | NY | 6,517 | 44,623 | 7,221 |
| Hendrick Hudson Central School District | Montrose | 3614190 | 21 | 36119 | NY | 2,480 | 15,734 | 2,719 |
| Herricks Union Free School District | New Hyde Park | 3614280 | 21 | 36059 | NY | 3,831 | 24,905 | 4,252 |
| Hewlett-Woodmere Union Free School District | Woodmere | 3631710 | 21 | 36059 | NY | 3,058 | 20,545 | 3,893 |
| Hicksville Union Free School District | Hicksville | 3614340 | 21 | 36059 | NY | 5,232 | 40,069 | 5,990 |
| Highland Falls Central School District | Fort Montgomery | 3614430 | 31 | 36071 | NY | 970 | 12,575 | 1,693 |
| Huntington Union Free School District | Huntington Station | 3615090 | 21 | 36103 | NY | 4,368 | 34,959 | 5,385 |
| Hyde Park Central School District | Hyde Park | 3615180 | 41 | 36027 | NY | 3,877 | 33,709 | 4,350 |
| Irvington Union Free School District | Irvington | 3615450 | 21 | 36119 | NY | 1,796 | 9,406 | 2,000 |
| Island Park Union Free School District | Island Park | 3615480 | 21 | 36059 | NY | 730 | 8,448 | 1,136 |
| Island Trees Union Free School District | Levittown | 3615510 | 21 | 36059 | NY | 2,400 | 15,566 | 2,657 |
| Islip Union Free School District | Islip | 3615540 | 21 | 36103 | NY | 3,155 | 19,484 | 3,455 |
| Jericho Union Free School District | Jericho | 3615810 | 21 | 36059 | NY | 3,052 | 17,509 | 2,948 |
| Katonah-Lewisboro Union Free School District | South Salem | 3616080 | 21 | 36119 | NY | 3,483 | 18,607 | 4,191 |
| Kings Park Central School District | Kings Park | 3616260 | 21 | 36103 | NY | 3,771 | 22,992 | 4,216 |
| Kiryas Joel Village Union Free School District | Monroe | 3604758 | 21 | 36071 | NY | 169 | 20,325 | 7,445 |
| Lakeland Central School District | Shrub Oak | 3616620 | 21 | 36119 | NY | 6,136 | 35,986 | 6,753 |
| Lawrence Union Free School District | Lawrence | 3616830 | 21 | 36059 | NY | 2,976 | 35,893 | 7,089 |
| Levittown Union Free School District | Levittown | 3617160 | 21 | 36059 | NY | 7,329 | 46,972 | 7,902 |
| Lindenhurst Union Free School District | Lindenhurst | 3617380 | 21 | 36103 | NY | 6,429 | 42,191 | 6,926 |
| Locust Valley Central School District | Locust Valley | 3617700 | 21 | 36059 | NY | 2,171 | 15,765 | 2,884 |
| Long Beach City School District | Long Beach | 3617730 | 21 | 36059 | NY | 3,954 | 39,014 | 4,546 |
| Longwood Central School District | Middle Island | 3619230 | 21 | 36103 | NY | 8,970 | 65,715 | 9,613 |
| Lynbrook Union Free School District | Lynbrook | 3617910 | 21 | 36059 | NY | 2,789 | 17,770 | 3,016 |
| Mahopac Central School District | Mahopac | 3618120 | 21 | 36079 | NY | 4,718 | 26,634 | 5,070 |
| Malverne Union Free School District | Malverne | 3618210 | 21 | 36059 | NY | 1,664 | 15,039 | 2,426 |
| Mamaroneck Union Free School District | Mamaroneck | 3618240 | 21 | 36119 | NY | 5,173 | 28,982 | 5,660 |
| Manhasset Union Free School District | Manhasset | 3618270 | 21 | 36059 | NY | 3,259 | 16,316 | 3,475 |
| Massapequa Union Free School District | Massapequa | 3618630 | 21 | 36059 | NY | 7,643 | 47,583 | 8,832 |
| Mattituck-Cutchogue Union Free School District | Cutchogue | 3600021 | 21 | 36103 | NY | 1,387 | 9,233 | 1,476 |
| Merrick Union Free School District | Merrick | 3619110 | 21 | 36059 | NY | 1,551 | 18,131 | 1,731 |
| Middle Country Central School District | Centereach | 3619200 | 21 | 36103 | NY | 10,398 | 62,830 | 10,880 |
| Middletown City School District | Middletown | 3619320 | 23 | 36071 | NY | 6,988 | 41,179 | 7,315 |
| Millbrook Central School District | Millbrook | 3619380 | 42 | 36027 | NY | 1,093 | 7,891 | 1,430 |
| Miller Place Union Free School District | Miller Place | 3619410 | 21 | 36103 | NY | 2,912 | 15,927 | 3,204 |
| Mineola Union Free School District | Mineola | 3619500 | 21 | 36059 | NY | 2,764 | 23,747 | 3,177 |
| Minisink Valley Central School District | Slate Hill | 3619560 | 41 | 36071 | NY | 4,100 | 23,197 | 4,487 |
| Monroe-Woodbury Central School District | Central Valley | 3619650 | 21 | 36071 | NY | 7,032 | 36,858 | 7,797 |
| Montauk Union Free School District | Montauk | 3619710 | 32 | 36103 | NY | 344 | 3,340 | 381 |
| Mount Pleasant Central School District | Thornwood | 3620160 | 21 | 36119 | NY | 1,949 | 13,224 | 2,666 |
| Mount Sinai Union Free School District | Mount Sinai | 3620040 | 21 | 36103 | NY | 2,461 | 13,041 | 2,556 |
| Mount Vernon School District | Mount Vernon | 3620100 | 21 | 36119 | NY | 8,492 | 68,686 | 10,862 |
| Nanuet Union Free School District | Nanuet | 3620190 | 21 | 36087 | NY | 2,274 | 13,866 | 2,493 |
| New Hyde Park-Garden City Park Union Free School District | New Hyde Park | 3620400 | 21 | 36059 | NY | 1,605 | 22,958 | 1,811 |
| New Rochelle City School District | New Rochelle | 3620490 | 21 | 36119 | NY | 10,907 | 78,661 | 12,668 |
| New Suffolk Common School District | New Suffolk | 3620520 | 21 | 36103 | NY | 8 | 350 | 27 |
| New York City Public Schools | New York | 3620580 | 11 | 36061 | NY | 4 | 8,405,837 | 1,229,623 |
| Newburgh City School District | Newburgh | 3620700 | 21 | 36071 | NY | 11,406 | 66,393 | 11,985 |
| North Babylon Union Free School District | North Babylon | 3620910 | 21 | 36103 | NY | 4,768 | 30,181 | 4,952 |
| North Bellmore Union Free School District | Bellmore | 3620940 | 21 | 36059 | NY | 2,173 | 26,327 | 2,217 |
| North Merrick Union Free School District | Merrick | 3621120 | 21 | 36059 | NY | 1,268 | 14,185 | 1,306 |
| North Salem Central School District | North Salem | 3621180 | 41 | 36119 | NY | 1,223 | 7,554 | 1,486 |
| North Shore Central School District | Sea Cliff | 3626370 | 21 | 36059 | NY | 2,754 | 16,486 | 3,156 |
| Northeast Central School District | Amenia | 3630390 | 42 | 36027 | NY | 771 | 6,740 | 1,204 |
| Northport-East Northport Union Free School District | Northport | 3621270 | 21 | 36103 | NY | 6,060 | 36,268 | 6,787 |
| Nyack Union Free School District | Nyack | 3621480 | 21 | 36087 | NY | 2,888 | 24,222 | 3,489 |
| Oceanside Union Free School District | Oceanside | 3621570 | 21 | 36059 | NY | 5,727 | 37,189 | 6,179 |
| Ossining Union Free School District | Ossining | 3622020 | 21 | 36119 | NY | 4,656 | 34,940 | 5,004 |
| Oyster Bay-East Norwich Central School District | Oyster Bay | 3622290 | 21 | 36059 | NY | 1,662 | 13,330 | 2,217 |
| Oysterponds Union Free School District | Orient | 3621930 | 41 | 36103 | NY | 82 | 1,612 | 179 |
| Patchogue-Medford Union Free School District | Patchogue | 3622470 | 21 | 36103 | NY | 7,856 | 53,156 | 8,216 |
| Pawling Central School District | Pawling | 3622530 | 41 | 36027 | NY | 1,290 | 8,994 | 1,634 |
| Pearl River Union Free School District | Pearl River | 3622560 | 21 | 36087 | NY | 2,616 | 16,024 | 2,956 |
| Peekskill City School District | Peekskill | 3622650 | 21 | 36119 | NY | 3,063 | 24,072 | 3,584 |
| Pelham Union Free School District | Pelham | 3622680 | 21 | 36119 | NY | 2,830 | 12,653 | 2,924 |
| Pine Bush Central School District | Pine Bush | 3623010 | 41 | 36071 | NY | 5,698 | 33,216 | 5,977 |
| Pine Plains Central School District | Pine Plains | 3623040 | 42 | 36027 | NY | 1,015 | 9,018 | 1,263 |
| Plainedge Union Free School District | N Massapequa | 3623190 | 21 | 36059 | NY | 3,222 | 19,426 | 3,405 |
| Plainview-Old Bethpage Central School District | Plainview | 3623220 | 21 | 36059 | NY | 4,881 | 28,941 | 5,211 |
| Pleasantville Union Free School District | Pleasantville | 3623310 | 21 | 36119 | NY | 1,766 | 8,272 | 1,749 |
| Pocantico Hills Central School District | Sleepy Hollow | 3623340 | 41 | 36119 | NY | 304 | 4,498 | 509 |
| Port Chester-Rye Union Free School District | Port Chester | 3623460 | 21 | 36119 | NY | 4,369 | 32,573 | 4,829 |
| Port Jefferson Union Free School District | Port Jefferson | 3623490 | 21 | 36103 | NY | 1,226 | 7,602 | 1,273 |
| Port Jervis City School District | Port Jervis | 3623520 | 41 | 36071 | NY | 2,836 | 17,614 | 3,013 |
| Port Washington Union Free School District | Port Washington | 3623580 | 21 | 36059 | NY | 5,153 | 31,359 | 5,483 |
| Poughkeepsie City School District | Poughkeepsie | 3623760 | 21 | 36027 | NY | 4,412 | 30,845 | 4,541 |
| Putnam Valley Central School District | Putnam Valley | 3624000 | 21 | 36079 | NY | 1,812 | 10,721 | 1,909 |
| Quogue Union Free School District | Quogue | 3624060 | 21 | 36103 | NY | 117 | 1,085 | 149 |
| Ramapo Central School District (Suffern) | Hillburn | 3628320 | 21 | 36087 | NY | 4,529 | 29,463 | 5,502 |
| Red Hook Central School District | Red Hook | 3624240 | 31 | 36027 | NY | 1,991 | 13,987 | 2,185 |
| Remsenburg-Speonk Union Free School District | Remsenburg | 3624420 | 21 | 36103 | NY | 171 | 1,959 | 332 |
| Rhinebeck Central School District | Rhinebeck | 3624480 | 31 | 36027 | NY | 1,120 | 9,714 | 1,273 |
| Riverhead Central School District | Riverhead | 3624690 | 21 | 36103 | NY | 4,969 | 38,621 | 5,260 |
| Rockville Centre Union Free School District | Rockville Centre | 3624780 | 21 | 36059 | NY | 3,554 | 22,166 | 4,166 |
| Rocky Point Union Free School District | Rocky Point | 3624840 | 41 | 36103 | NY | 3,314 | 17,984 | 3,395 |
| Roosevelt Union Free School District | Roosevelt | 3624990 | 21 | 36059 | NY | 2,880 | 17,790 | 3,116 |
| Roslyn Union Free School District | Roslyn | 3625050 | 21 | 36059 | NY | 3,174 | 17,597 | 3,515 |
| Rye City School District | Rye | 3625260 | 21 | 36119 | NY | 3,199 | 14,981 | 3,663 |
| Rye Neck Union Free School District | Mamaroneck | 3625290 | 21 | 36119 | NY | 1,539 | 8,838 | 1,744 |
| Sachem Central School District | Lake Ronkonkoma | 3625350 | 21 | 36103 | NY | 14,231 | 83,555 | 14,403 |
| Sag Harbor Union Free School District | Sag Harbor | 3625380 | 21 | 36103 | NY | 1,062 | 6,772 | 1,017 |
| Sagaponack Common School District | Sagaponack | 3625410 | 41 | 36103 | NY | 11 | 309 | 38 |
| Sayville Union Free School District | Sayville | 3625920 | 21 | 36103 | NY | 3,180 | 18,675 | 3,270 |
| Scarsdale Union Free School District | Scarsdale | 3625950 | 21 | 36119 | NY | 4,740 | 18,301 | 4,962 |
| Seaford Union Free School District | Seaford | 3626400 | 21 | 36059 | NY | 2,451 | 16,393 | 2,840 |
| Sewanhaka Central High School District | Floral Park | 3626520 | 21 | 36059 | NY | 8,278 | 119,093 | 9,905 |
| Shelter Island Union Free School District | Shelter Island | 3626640 | 41 | 36103 | NY | 232 | 2,400 | 302 |
| Shoreham-Wading River Central School District | Shoreham | 3626840 | 21 | 36103 | NY | 2,523 | 12,933 | 2,627 |
| Smithtown Central School District | Smithtown | 3627060 | 21 | 36103 | NY | 10,317 | 57,387 | 11,308 |
| Somers Central School District | Somers | 3627180 | 21 | 36119 | NY | 3,363 | 19,948 | 3,905 |
| South Country Central School District | East Patchogue | 3600008 | 21 | 36103 | NY | 4,529 | 29,986 | 4,864 |
| South Huntington Union Free School District | Huntington Station | 3627300 | 21 | 36103 | NY | 6,040 | 38,815 | 6,295 |
| South Orangetown Central School District | Blauvelt | 3627450 | 21 | 36087 | NY | 3,352 | 21,817 | 3,713 |
| Southampton Union Free School District | Southampton | 3627540 | 21 | 36103 | NY | 1,604 | 10,136 | 1,384 |
| Southold Union Free School District | Southold | 3627620 | 31 | 36103 | NY | 880 | 6,359 | 925 |
| Spackenkill Union Free School District | Poughkeepsie | 3606500 | 21 | 36027 | NY | 1,550 | 8,771 | 1,528 |
| Springs Union Free School District | East Hampton | 3627900 | 31 | 36103 | NY | 668 | 6,620 | 953 |
| Syosset Central School District | Syosset | 3628560 | 21 | 36059 | NY | 6,494 | 34,523 | 6,927 |
| Three Village Central School District | Stony Brook | 3628200 | 21 | 36103 | NY | 7,178 | 48,631 | 7,601 |
| Tuckahoe Common School District | Southampton | 3629070 | 21 | 36103 | NY | 384 | 3,364 | 472 |
| Tuckahoe Union Free School District | Eastchester | 3629040 | 21 | 36119 | NY | 1,090 | 7,591 | 1,201 |
| Tuxedo Union Free School District | Tuxedo Park | 3629190 | 41 | 36071 | NY | 552 | 2,700 | 403 |
| Union Free School District of The Tarrytowns | Sleepy Hollow | 3628650 | 21 | 36119 | NY | 2,836 | 19,925 | 3,037 |
| Uniondale Union Free School District | Uniondale | 3629280 | 21 | 36059 | NY | 6,393 | 42,426 | 6,399 |
| Valhalla Union Free School District | Valhalla | 3629400 | 21 | 36119 | NY | 1,537 | 9,803 | 1,676 |
| Valley Central School District (Montgomery) | Montgomery | 3619680 | 41 | 36071 | NY | 4,566 | 27,090 | 5,133 |
| Valley Stream 13 Union Free School District | Valley Stream | 3629430 | 21 | 36059 | NY | 2,112 | 28,538 | 2,274 |
| Valley Stream 24 Union Free School District | Valley Stream | 3629460 | 21 | 36059 | NY | 1,114 | 13,995 | 1,165 |
| Valley Stream 30 Union Free School District | Valley Stream | 3629490 | 21 | 36059 | NY | 1,477 | 17,835 | 1,545 |
| Valley Stream Central High School District | Valley Stream | 3629520 | 21 | 36059 | NY | 4,630 | 60,368 | 5,029 |
| Wainscott Common School District | Wainscott | 3629760 | 41 | 36103 | NY | 15 | 660 | 102 |
| Wantagh Union Free School District | Wantagh | 3629850 | 21 | 36059 | NY | 3,315 | 17,973 | 3,682 |
| Wappingers Central School District | Wappingers Falls | 3629880 | 21 | 36027 | NY | 11,865 | 73,089 | 12,715 |
| Warwick Valley Central School District | Warwick | 3629970 | 31 | 36071 | NY | 3,859 | 23,823 | 4,587 |
| Washingtonville Central School District | Washingtonville | 3630030 | 21 | 36071 | NY | 4,433 | 24,580 | 4,805 |
| West Babylon Union Free School District | West Babylon | 3630540 | 21 | 36103 | NY | 4,195 | 28,037 | 4,367 |
| West Hempstead Union Free School District | West Hempstead | 3630660 | 21 | 36059 | NY | 2,111 | 17,275 | 3,264 |
| West Islip Union Free School District | West Islip | 3630690 | 21 | 36103 | NY | 5,001 | 28,162 | 5,385 |
| Westbury Union Free School District | Old Westbury | 3630960 | 21 | 36059 | NY | 4,714 | 26,538 | 4,200 |
| Westhampton Beach Union Free School District | Westhampton Beach | 3631020 | 21 | 36103 | NY | 1,837 | 5,595 | 878 |
| White Plains City School District | White Plains | 3631260 | 13 | 36119 | NY | 7,077 | 58,032 | 8,002 |
| William Floyd Union Free School District | Mastic Beach | 3618690 | 21 | 36103 | NY | 8,982 | 50,067 | 9,316 |
| Wyandanch Union Free School District | Wyandanch | 3631800 | 21 | 36103 | NY | 2,130 | 11,752 | 2,337 |
| Yonkers City School District | Yonkers | 3631920 | 21 | 36119 | NY | 25,529 | 200,045 | 31,083 |
| Yorktown Central School District | Yorktown Heights | 3631980 | 41 | 36119 | NY | 3,614 | 21,072 | 4,309 |
| Delaware Valley Sd | Milford | 4207530 | 32 | 42103 | PA | 5,062 | 28,747 | 4,937 |
| Wallenpaupack Area Sd | Hawley | 4224750 | 42 | 42103 | PA | 3,360 | 25,099 | 3,562 |
Number of districts: 568 ... Total enrollment: 1,718,029
All school districts interactive tables General Demographics | Social | Economic | Housing
All school districts enrollment & adminstratively reported data interactive table.
7.2. Component Higher Education Institution Characteristics go top
2014-15 School Year. Extended detail Available in subscription edition.
| Institution | City Name | Code | Level | Total UG Enrollment | Fulltime UG Enrollment | Total Grad Enrollment | Fulltime Grad Enrollment |
| ASA College | Brooklyn, NY | 404994 | 3 | 4,624 | 4,276 | 0 | 0 |
| Adelphi University | Garden City, NY | 188429 | 9 | 5,071 | 4,589 | 2,539 | 1,407 |
| American Academy McAllister Institute of Funeral Service | New York, NY | 188687 | 3 | 424 | 88 | 0 | 0 |
| American Academy of Dramatic Arts-New York | New York, NY | 188678 | 3 | 253 | 253 | 0 | 0 |
| American Institute of Medical Sciences & Education | Piscataway, NJ | 455202 | 4 | 330 | 311 | 0 | 0 |
| American Institute-Toms River | Toms River, NJ | 482963 | 4 | 323 | 323 | 0 | 0 |
| American Musical and Dramatic Academy | New York, NY | 188854 | 5 | 1,735 | 1,735 | 0 | 0 |
| Associated Beth Rivkah Schools | Brooklyn, NY | 188942 | 4 | 147 | 147 | 0 | 0 |
| Assumption College for Sisters | Mendham, NJ | 183600 | 3 | 39 | 23 | 0 | 0 |
| Bais Medrash Elyon | Monsey, NY | 245777 | 9 | 67 | 67 | 30 | 30 |
| Bais Medrash Toras Chesed | Lakewood, NJ | 449658 | 5 | 111 | 109 | 0 | 0 |
| Bard College | Annandale-On-Hudson, NY | 189088 | 9 | 2,112 | 2,040 | 357 | 325 |
| Barnard College | New York, NY | 189097 | 5 | 2,573 | 2,537 | 0 | 0 |
| Be'er Yaakov Talmudic Seminary | Spring Valley, NY | 476717 | 5 | 382 | 382 | 0 | 0 |
| Beis Medrash Heichal Dovid | Far Rockaway, NY | 444413 | 9 | 93 | 93 | 18 | 18 |
| Bergen Community College | Paramus, NJ | 183743 | 3 | 15,651 | 8,976 | 0 | 0 |
| Berkeley College-New York | New York, NY | 189228 | 5 | 4,479 | 3,946 | 0 | 0 |
| Berkeley College-Woodland Park | Woodland Park, NJ | 183789 | 5 | 3,659 | 3,066 | 0 | 0 |
| Beth Hamedrash Shaarei Yosher Institute | Brooklyn, NY | 189273 | 9 | 42 | 42 | 6 | 6 |
| Beth Hatalmud Rabbinical College | Brooklyn, NY | 189264 | 5 | 29 | 29 | 0 | 0 |
| Beth Medrash Govoha | Lakewood, NJ | 183804 | 8 | 2,703 | 2,676 | 4,018 | 3,363 |
| Bloomfield College | Bloomfield, NJ | 183822 | 7 | 1,999 | 1,756 | 5 | 0 |
| Boricua College | New York, NY | 189413 | 7 | 1,104 | 1,104 | 59 | 59 |
| Bramson ORT College | Forest Hills, NY | 189422 | 3 | 641 | 521 | 0 | 0 |
| Briarcliffe College | Bethpage, NY | 189459 | 5 | 1,719 | 1,358 | 0 | 0 |
| Brookdale Community College | Lincroft, NJ | 183859 | 3 | 14,144 | 6,899 | 0 | 0 |
| Business Informatics Center Inc | Valley Stream, NY | 189653 | 3 | 24 | 8 | 0 | 0 |
| CUNY Bernard M Baruch College | New York, NY | 190512 | 8 | 14,857 | 10,865 | 3,233 | 744 |
| CUNY Borough of Manhattan Community College | New York, NY | 190521 | 3 | 26,606 | 17,131 | 0 | 0 |
| CUNY Bronx Community College | Bronx, NY | 190530 | 3 | 11,506 | 6,836 | 0 | 0 |
| CUNY Brooklyn College | Brooklyn, NY | 190549 | 8 | 14,115 | 9,897 | 3,275 | 489 |
| CUNY City College | New York, NY | 190567 | 9 | 12,893 | 9,430 | 2,686 | 415 |
| CUNY Graduate School and University Center | New York, NY | 190576 | 9 | 1,684 | 342 | 5,329 | 3,978 |
| CUNY Hostos Community College | Bronx, NY | 190585 | 3 | 6,985 | 4,067 | 0 | 0 |
| CUNY Hunter College | New York, NY | 190594 | 9 | 16,879 | 12,142 | 6,233 | 1,390 |
| CUNY John Jay College of Criminal Justice | New York, NY | 190600 | 7 | 13,305 | 10,225 | 1,740 | 346 |
| CUNY Kingsborough Community College | Brooklyn, NY | 190619 | 3 | 17,758 | 10,300 | 0 | 0 |
| CUNY LaGuardia Community College | Long Island City, NY | 190628 | 3 | 20,231 | 10,922 | 0 | 0 |
| CUNY Lehman College | Bronx, NY | 190637 | 8 | 10,326 | 5,925 | 2,072 | 283 |
| CUNY Medgar Evers College | Brooklyn, NY | 190646 | 5 | 6,701 | 4,324 | 0 | 0 |
| CUNY New York City College of Technology | Brooklyn, NY | 190655 | 5 | 17,374 | 10,587 | 0 | 0 |
| CUNY Queens College | Flushing, NY | 190664 | 8 | 15,773 | 11,079 | 3,537 | 482 |
| CUNY Queensborough Community College | Bayside, NY | 190673 | 3 | 16,182 | 9,551 | 0 | 0 |
| CUNY York College | Jamaica, NY | 190691 | 7 | 8,438 | 5,121 | 55 | 54 |
| Caldwell College | Caldwell, NJ | 183910 | 9 | 1,600 | 1,354 | 584 | 136 |
| Central Yeshiva Tomchei Tmimim Lubavitz | Brooklyn, NY | 189857 | 7 | 613 | 613 | 113 | 113 |
| Circle in the Square Theater School | New York, NY | 190008 | 4 | 69 | 69 | 0 | 0 |
| Cochran School of Nursing | Yonkers, NY | 190071 | 3 | 93 | 12 | 0 | 0 |
| College of Mount Saint Vincent | Bronx, NY | 193399 | 8 | 1,689 | 1,583 | 226 | 49 |
| College of Saint Elizabeth | Morristown, NJ | 186618 | 9 | 895 | 560 | 516 | 138 |
| College of Staten Island CUNY | Staten Island, NY | 190558 | 9 | 13,345 | 10,045 | 1,001 | 193 |
| Columbia University in the City of New York | New York, NY | 190150 | 9 | 8,100 | 7,496 | 19,489 | 15,772 |
| Concordia College-New York | Bronxville, NY | 190248 | 7 | 944 | 835 | 93 | 72 |
| Cooper Union for the Advancement of Science and Art | New York, NY | 190372 | 7 | 893 | 884 | 73 | 53 |
| County College of Morris | Randolph, NJ | 184180 | 3 | 8,096 | 4,129 | 0 | 0 |
| Culinary Institute of America | Hyde Park, NY | 190503 | 5 | 2,778 | 2,778 | 0 | 0 |
| DeVry College of New York | New York, NY | 482413 | 7 | 1,302 | 893 | 724 | 236 |
| DeVry University-New Jersey | North Brunswick, NJ | 482556 | 7 | 1,316 | 645 | 230 | 78 |
| Dominican College of Blauvelt | Orangeburg, NY | 190761 | 9 | 1,483 | 1,269 | 497 | 184 |
| Dowling College | Oakdale, NY | 190770 | 9 | 1,783 | 1,087 | 670 | 211 |
| Drew University | Madison, NJ | 184348 | 9 | 1,417 | 1,357 | 696 | 298 |
| Dutchess Community College | Poughkeepsie, NY | 190840 | 3 | 9,905 | 4,666 | 0 | 0 |
| Eastern International College-Belleville | Belleville, NJ | 448354 | 5 | 216 | 150 | 0 | 0 |
| Eastern International College-Jersey City | Jersey City, NJ | 421878 | 5 | 217 | 172 | 0 | 0 |
| Eastern School of Acupuncture and Traditional Medicine | Montclair, NJ | 446224 | 4 | 58 | 56 | 0 | 0 |
| Eastwick College-Hackensack | Hackensack, NJ | 183488 | 4 | 375 | 260 | 0 | 0 |
| Eastwick College-Ramsey | Ramsey, NJ | 184959 | 3 | 865 | 452 | 0 | 0 |
| Essex County College | Newark, NJ | 184481 | 3 | 11,468 | 5,799 | 0 | 0 |
| Fairleigh Dickinson University-College at Florham | Madison, NJ | 184694 | 9 | 2,400 | 2,234 | 831 | 571 |
| Fairleigh Dickinson University-Metropolitan Campus | Teaneck, NJ | 184603 | 9 | 6,051 | 2,693 | 2,726 | 1,158 |
| Farmingdale State College | Farmingdale, NY | 196042 | 5 | 8,394 | 6,287 | 0 | 0 |
| Fashion Institute of Technology | New York, NY | 191126 | 7 | 9,567 | 7,454 | 197 | 124 |
| Felician College | Lodi, NJ | 184612 | 9 | 1,634 | 1,390 | 319 | 32 |
| Five Towns College | Dix Hills, NY | 191205 | 9 | 649 | 630 | 38 | 22 |
| Fordham University | Bronx, NY | 191241 | 9 | 8,633 | 8,058 | 6,598 | 4,175 |
| Fox Institute of Business-Clifton | CLIFTON, NJ | 184092 | 4 | 665 | 665 | 0 | 0 |
| Georgian Court University | Lakewood, NJ | 184773 | 8 | 1,621 | 1,299 | 687 | 199 |
| Globe Institute of Technology | New York, NY | 188465 | 5 | 490 | 469 | 0 | 0 |
| Healthcare Training Institute | Union, NJ | 446303 | 4 | 76 | 47 | 0 | 0 |
| Helene Fuld College of Nursing | New York, NY | 191597 | 5 | 444 | 254 | 0 | 0 |
| Hofstra University | Hempstead, NY | 191649 | 9 | 6,904 | 6,474 | 4,049 | 3,005 |
| Hohokus School-RETS Nutley | Nutley, NJ | 185721 | 3 | 321 | 187 | 0 | 0 |
| Holy Name Medical Center School of Nursing | Teaneck, NJ | 184968 | 4 | 147 | 79 | 0 | 0 |
| Hudson County Community College | Jersey City, NJ | 184995 | 3 | 9,203 | 5,983 | 0 | 0 |
| Hunter Business School | Levittown, NY | 191728 | 4 | 1,005 | 671 | 0 | 0 |
| Institute of Design and Construction | Brooklyn, NY | 191764 | 3 | 93 | 41 | 0 | 0 |
| Iona College | New Rochelle, NY | 191931 | 8 | 3,301 | 2,994 | 608 | 273 |
| Island Drafting and Technical Institute | Amityville, NY | 191959 | 3 | 110 | 110 | 0 | 0 |
| Jersey College | Teterboro, NJ | 455196 | 3 | 2,173 | 2,173 | 0 | 0 |
| Jewish Theological Seminary of America | New York, NY | 192040 | 9 | 156 | 156 | 249 | 124 |
| Joe Kubert School of Cartoon and Graphic Art | Dover, NJ | 185174 | 4 | 99 | 99 | 0 | 0 |
| Joffrey Ballet School | New York, NY | 188696 | 4 | 262 | 262 | 0 | 0 |
| Kean University | Union, NJ | 185262 | 9 | 11,987 | 9,283 | 2,372 | 859 |
| Kehilath Yakov Rabbinical Seminary | Ossining, NY | 192165 | 5 | 125 | 125 | 0 | 0 |
| LIM College | New York, NY | 192271 | 7 | 1,552 | 1,424 | 185 | 120 |
| LIU Brentwood | Brentwood, NY | 192563 | 8 | 15 | 9 | 201 | 108 |
| LIU Brooklyn | Brooklyn, NY | 192439 | 9 | 4,871 | 4,113 | 3,483 | 2,014 |
| LIU Post | Brookville, NY | 192448 | 9 | 7,117 | 3,387 | 2,369 | 1,096 |
| LIU Riverhead | Riverhead, NY | 450766 | 7 | 39 | 29 | 129 | 19 |
| Lincoln Technical Institute-South Plainfield | South Plainfield, NJ | 184427 | 4 | 321 | 266 | 0 | 0 |
| Long Island Business Institute | Flushing, NY | 192509 | 4 | 397 | 288 | 0 | 0 |
| Machzikei Hadath Rabbinical College | Brooklyn, NY | 192624 | 5 | 147 | 147 | 0 | 0 |
| Mandl School-The College of Allied Health | New York, NY | 192688 | 3 | 707 | 633 | 0 | 0 |
| Manhattan College | Riverdale, NY | 192703 | 7 | 3,471 | 3,276 | 499 | 230 |
| Manhattan School of Music | New York, NY | 192712 | 9 | 389 | 385 | 568 | 566 |
| Manhattanville College | Purchase, NY | 192749 | 9 | 1,798 | 1,708 | 1,067 | 220 |
| Marist College | Poughkeepsie, NY | 192819 | 7 | 5,516 | 4,876 | 840 | 245 |
| Marymount Manhattan College | New York, NY | 192864 | 5 | 1,858 | 1,640 | 0 | 0 |
| Medical Career Institute | Ocean, NJ | 479965 | 4 | 60 | 60 | 0 | 0 |
| Mercy College | Dobbs Ferry, NY | 193016 | 9 | 7,939 | 5,289 | 3,333 | 1,457 |
| Merkaz Bnos-Business School | Brooklyn, NY | 427308 | 4 | 109 | 109 | 0 | 0 |
| Mesivta Keser Torah | Belmar, NJ | 461847 | 5 | 41 | 41 | 0 | 0 |
| Mesivta Torah Vodaath Rabbinical Seminary | Brooklyn, NY | 193052 | 8 | 276 | 276 | 68 | 67 |
| Mesivta of Eastern Parkway-Yeshiva Zichron Meilech | Brooklyn, NY | 193061 | 9 | 33 | 33 | 2 | 2 |
| Mesivtha Tifereth Jerusalem of America | New York, NY | 193070 | 9 | 46 | 46 | 26 | 26 |
| Metropolitan College of New York | New York, NY | 190114 | 7 | 897 | 806 | 331 | 278 |
| Miami Ad School-New York | Brooklyn, NY | 476355 | 4 | 99 | 99 | 0 | 0 |
| Middlesex County College | Edison, NJ | 185536 | 3 | 12,059 | 6,162 | 0 | 0 |
| Mildred Elley-New York Campus | New York, NY | 461014 | 3 | 590 | 590 | 0 | 0 |
| Mirrer Yeshiva Cent Institute | Brooklyn, NY | 193247 | 9 | 132 | 132 | 65 | 65 |
| Molloy College | Rockville Centre, NY | 193292 | 9 | 3,336 | 2,679 | 1,161 | 234 |
| Monmouth University | West Long Branch, NJ | 185572 | 9 | 4,634 | 4,370 | 1,761 | 694 |
| Monroe College | Bronx, NY | 193308 | 7 | 6,501 | 4,772 | 501 | 265 |
| Montclair State University | Montclair, NJ | 185590 | 9 | 15,885 | 13,879 | 4,137 | 1,374 |
| Mount Saint Mary College | Newburgh, NY | 193353 | 8 | 2,123 | 1,712 | 356 | 86 |
| Mountainside School of Nursing | Montclair, NJ | 185624 | 4 | 110 | 110 | 0 | 0 |
| Muhlenberg Harold B and Dorothy A Snyder Schools-School of Imaging | Plainfield, NJ | 185651 | 4 | 85 | 13 | 0 | 0 |
| Muhlenberg Harold B and Dorothy A Snyder Schools-School of Nursing | Plainfield, NJ | 185679 | 4 | 395 | 48 | 0 | 0 |
| Nassau Community College | Garden City, NY | 193478 | 3 | 22,374 | 13,541 | 0 | 0 |
| Neighborhood Playhouse School of the Theater | New York City, NY | 193609 | 4 | 80 | 80 | 0 | 0 |
| New Jersey City University | Jersey City, NJ | 185129 | 9 | 6,229 | 4,689 | 1,907 | 416 |
| New Jersey Institute of Technology | Newark, NJ | 185828 | 9 | 7,550 | 5,923 | 3,096 | 1,802 |
| New York Automotive and Diesel Institute | Jamaica, NY | 440262 | 4 | 346 | 346 | 0 | 0 |
| New York Career Institute | New York, NY | 195845 | 3 | 545 | 276 | 0 | 0 |
| New York College of Health Professions | Syosset, NY | 418126 | 7 | 519 | 278 | 213 | 128 |
| New York College of Traditional Chinese Medicine | Mineola, NY | 439783 | 8 | 78 | 56 | 77 | 36 |
| New York Conservatory for Dramatic Arts | New York, NY | 421841 | 4 | 237 | 237 | 0 | 0 |
| New York Institute of Technology | Old Westbury, NY | 194091 | 9 | 4,291 | 3,722 | 3,581 | 2,745 |
| New York Medical Career Training Center | Flushing, NY | 457800 | 4 | 284 | 108 | 0 | 0 |
| New York Methodist Hospital Center for Allied Health Education | Brooklyn, NY | 451413 | 4 | 227 | 227 | 0 | 0 |
| New York School of Interior Design | New York, NY | 194116 | 7 | 415 | 145 | 124 | 124 |
| New York University | New York, NY | 193900 | 9 | 24,985 | 23,715 | 24,289 | 16,183 |
| Nyack College | Nyack, NY | 194161 | 9 | 1,705 | 1,416 | 1,191 | 528 |
| Ocean County College | Toms River, NJ | 185873 | 3 | 9,296 | 4,927 | 0 | 0 |
| Ohr Hameir Theological Seminary | Peekskill, NY | 194189 | 5 | 96 | 96 | 0 | 0 |
| Orange County Community College | Middletown, NY | 194240 | 3 | 6,951 | 3,323 | 0 | 0 |
| Pace University-New York | New York, NY | 194310 | 9 | 8,694 | 7,262 | 4,163 | 2,019 |
| Pacific College of Oriental Medicine-New York | New York, NY | 414595 | 8 | 136 | 37 | 424 | 324 |
| Passaic County Community College | Paterson, NJ | 186034 | 3 | 8,968 | 3,412 | 0 | 0 |
| Phillips Beth Israel School of Nursing | New York, NY | 189282 | 5 | 278 | 28 | 0 | 0 |
| Pillar College | Newark, NJ | 440794 | 5 | 478 | 419 | 0 | 0 |
| Plaza College | Forest Hills, NY | 194499 | 5 | 716 | 716 | 0 | 0 |
| Pratt Institute-Main | Brooklyn, NY | 194578 | 8 | 3,279 | 3,168 | 1,411 | 1,261 |
| Rabbi Jacob Joseph School | Edison, NJ | 384421 | 5 | 84 | 84 | 0 | 0 |
| Rabbinical Academy Mesivta Rabbi Chaim Berlin | Brooklyn, NY | 194657 | 9 | 155 | 155 | 94 | 94 |
| Rabbinical College Beth Shraga | Monsey, NY | 194693 | 5 | 41 | 41 | 0 | 0 |
| Rabbinical College Bobover Yeshiva Bnei Zion | Brooklyn, NY | 194666 | 7 | 273 | 273 | 48 | 48 |
| Rabbinical College Ohr Yisroel | Brooklyn, NY | 484871 | 5 | 104 | 104 | 0 | 0 |
| Rabbinical College of America | Morristown, NJ | 186186 | 5 | 212 | 212 | 0 | 0 |
| Rabbinical College of Ch'san Sofer New York | Brooklyn, NY | 194675 | 7 | 34 | 34 | 11 | 11 |
| Rabbinical College of Long Island | Long Beach, NY | 194736 | 5 | 115 | 115 | 0 | 0 |
| Rabbinical College of Ohr Shimon Yisroel | Brooklyn, NY | 405854 | 5 | 164 | 164 | 0 | 0 |
| Rabbinical Seminary of America | Flushing, NY | 194763 | 9 | 282 | 282 | 218 | 218 |
| Ramapo College of New Jersey | Mahwah, NJ | 186201 | 7 | 5,710 | 5,044 | 293 | 36 |
| Raritan Valley Community College | Branchburg, NJ | 186645 | 3 | 8,214 | 3,440 | 0 | 0 |
| Rockland Community College | Suffern, NY | 195058 | 3 | 7,520 | 4,204 | 0 | 0 |
| Rutgers University-New Brunswick | New Brunswick, NJ | 186380 | 9 | 34,544 | 32,411 | 13,834 | 8,559 |
| Rutgers University-Newark | Newark, NJ | 186399 | 9 | 7,408 | 5,943 | 3,906 | 1,690 |
| SBI Campus-An Affiliate of Sanford-Brown | Melville, NY | 192156 | 3 | 240 | 210 | 0 | 0 |
| SUNY College at Old Westbury | Old Westbury, NY | 196237 | 8 | 4,315 | 3,670 | 189 | 118 |
| SUNY Downstate Medical Center | Brooklyn, NY | 196255 | 9 | 344 | 216 | 1,521 | 1,149 |
| SUNY Maritime College | Throggs Neck, NY | 196291 | 7 | 1,641 | 1,591 | 158 | 97 |
| SUNY Westchester Community College | Valhalla, NY | 197294 | 3 | 13,916 | 7,546 | 0 | 0 |
| SUNY at Purchase College | Purchase, NY | 196219 | 8 | 4,124 | 3,746 | 101 | 87 |
| Saint Joseph's College-New York | Brooklyn, NY | 195544 | 7 | 4,138 | 3,260 | 841 | 106 |
| Saint Peter's University | Jersey City, NJ | 186432 | 9 | 2,506 | 2,165 | 796 | 329 |
| Sanford-Brown Institute-Garden City | Garden City, NY | 364335 | 4 | 717 | 717 | 0 | 0 |
| Sanford-Brown Institute-Iselin | Iselin, NJ | 187161 | 4 | 521 | 521 | 0 | 0 |
| Sanford-Brown Institute-New York | New York, NY | 196857 | 4 | 1,226 | 1,226 | 0 | 0 |
| Sanford-Brown Institute-White Plains | White Plains, NY | 364326 | 4 | 47 | 47 | 0 | 0 |
| Sarah Lawrence College | Bronxville, NY | 195304 | 7 | 1,437 | 1,415 | 324 | 292 |
| School of Professional Horticulture at the New York Botanical Garden | Bronx, NY | 392354 | 4 | 6 | 6 | 0 | 0 |
| School of Visual Arts | New York, NY | 197151 | 7 | 3,678 | 3,435 | 719 | 629 |
| Seton Hall University | South Orange, NJ | 186584 | 9 | 5,817 | 5,348 | 3,810 | 1,591 |
| Sh'or Yoshuv Rabbinical College | Lawrence, NY | 195438 | 7 | 95 | 95 | 58 | 58 |
| St Francis College | Brooklyn Heights, NY | 195173 | 7 | 2,671 | 2,414 | 78 | 39 |
| St John's University-New York | Queens, NY | 195809 | 9 | 15,762 | 10,717 | 4,683 | 2,632 |
| St Joseph's Medical Center School of Radiography | Yonkers, NY | 441627 | 4 | 10 | 10 | 0 | 0 |
| St Paul's School of Nursing-Queens | Rego Park, NY | 189811 | 3 | 504 | 315 | 0 | 0 |
| St Paul's School of Nursing-Staten Island | Staten Island, NY | 195784 | 3 | 694 | 538 | 0 | 0 |
| St Thomas Aquinas College | Sparkill, NY | 195243 | 8 | 1,780 | 1,147 | 162 | 43 |
| Stella and Charles Guttman Community College | New York, NY | 475565 | 3 | 691 | 625 | 0 | 0 |
| StenoTech Career Institute-Piscataway | Piscataway, NJ | 450146 | 4 | 55 | 55 | 0 | 0 |
| Stevens Institute of Technology | Hoboken, NJ | 186867 | 9 | 2,892 | 2,842 | 3,233 | 2,008 |
| Stony Brook University | Stony Brook, NY | 196097 | 9 | 16,480 | 15,385 | 8,127 | 5,255 |
| Suffolk County Community College | Selden, NY | 366395 | 3 | 26,600 | 14,318 | 0 | 0 |
| Sussex County Community College | Newton, NJ | 247603 | 3 | 3,064 | 1,616 | 0 | 0 |
| Swedish Institute a College of Health Sciences | New York, NY | 196389 | 3 | 792 | 669 | 0 | 0 |
| Talmudical Academy-New Jersey | Adelphia, NJ | 186900 | 5 | 69 | 69 | 0 | 0 |
| Talmudical Seminary Oholei Torah | Brooklyn, NY | 196431 | 5 | 330 | 330 | 0 | 0 |
| Talmudical Seminary of Bobov | Brooklyn, NY | 451404 | 5 | 327 | 327 | 0 | 0 |
| Technical Career Institutes | New York, NY | 196477 | 3 | 2,762 | 2,385 | 0 | 0 |
| Teterboro School of Aeronautics | Teterboro, NJ | 187000 | 4 | 160 | 160 | 0 | 0 |
| The Ailey School | New York, NY | 188669 | 4 | 96 | 96 | 0 | 0 |
| The Art Institute of New York City | New York, NY | 365055 | 3 | 898 | 685 | 0 | 0 |
| The Collective School Of Music | New York, NY | 461157 | 4 | 52 | 52 | 0 | 0 |
| The College of New Rochelle | New Rochelle, NY | 193645 | 8 | 3,082 | 2,666 | 658 | 90 |
| The College of Westchester | White Plains, NY | 197285 | 5 | 1,125 | 892 | 0 | 0 |
| The Juilliard School | New York, NY | 192110 | 9 | 569 | 508 | 357 | 338 |
| The King�??s College | New York, NY | 454184 | 5 | 487 | 474 | 0 | 0 |
| The New School | New York, NY | 193654 | 9 | 6,940 | 6,023 | 3,537 | 2,638 |
| Torah Temimah Talmudical Seminary | Brooklyn, NY | 196583 | 5 | 102 | 102 | 0 | 0 |
| Touro College | New York, NY | 196592 | 9 | 6,485 | 4,849 | 5,896 | 3,238 |
| Unification Theological Seminary | Barrytown, NY | 246789 | 9 | 37 | 29 | 85 | 63 |
| Union County College | Cranford, NJ | 187198 | 3 | 11,781 | 5,259 | 0 | 0 |
| United States Merchant Marine Academy | Kings Point, NY | 197027 | 7 | 939 | 939 | 22 | 0 |
| United States Military Academy | West Point, NY | 197036 | 5 | 4,414 | 4,414 | 0 | 0 |
| United Talmudical Seminary | Brooklyn, NY | 197018 | 7 | 2,096 | 2,096 | 325 | 325 |
| University of Phoenix-Jersey City Campus | Jersey City, NJ | 445300 | 5 | 371 | 371 | 0 | 0 |
| Uta Mesivta of Kiryas Joel | Monroe, NY | 446604 | 5 | 1,634 | 1,634 | 0 | 0 |
| Vassar College | Poughkeepsie, NY | 197133 | 7 | 2,421 | 2,380 | 0 | 0 |
| Vaughn College of Aeronautics and Technology | Flushing, NY | 188340 | 7 | 1,605 | 1,261 | 9 | 2 |
| Wagner College | Staten Island, NY | 197197 | 9 | 1,823 | 1,762 | 408 | 202 |
| Webb Institute | Glen Cove, NY | 197221 | 5 | 90 | 90 | 0 | 0 |
| Western Suffolk BOCES | Northport, NY | 420468 | 4 | 336 | 205 | 0 | 0 |
| William Paterson University of New Jersey | Wayne, NJ | 187444 | 9 | 9,619 | 7,883 | 1,429 | 303 |
| Wood Tobe-Coburn School | New York, NY | 197522 | 3 | 411 | 411 | 0 | 0 |
| Yeshiva D'monsey Rabbinical College | Monsey, NY | 420325 | 9 | 52 | 52 | 8 | 8 |
| Yeshiva Derech Chaim | Brooklyn, NY | 197647 | 9 | 104 | 104 | 47 | 40 |
| Yeshiva Gedolah Imrei Yosef D'spinka | Brooklyn, NY | 375230 | 5 | 122 | 122 | 0 | 0 |
| Yeshiva Gedolah Kesser Torah | Monsey, NY | 481410 | 5 | 67 | 67 | 0 | 0 |
| Yeshiva Gedolah Zichron Leyma | Linden, NJ | 476692 | 5 | 28 | 28 | 0 | 0 |
| Yeshiva Karlin Stolin | Brooklyn, NY | 197601 | 5 | 113 | 113 | 0 | 0 |
| Yeshiva Shaar Hatorah | Kew Gardens, NY | 197692 | 7 | 56 | 56 | 20 | 20 |
| Yeshiva Shaarei Torah of Rockland | Suffern, NY | 441609 | 5 | 98 | 98 | 0 | 0 |
| Yeshiva Toras Chaim | Lakewood, NJ | 451398 | 5 | 215 | 215 | 0 | 0 |
| Yeshiva University | New York, NY | 197708 | 9 | 2,814 | 2,724 | 3,534 | 2,670 |
| Yeshiva Yesodei Hatorah | Lakewood, NJ | 481438 | 5 | 69 | 69 | 0 | 0 |
| Yeshiva and Kollel Harbotzas Torah | Brooklyn, NY | 245731 | 9 | 31 | 31 | 21 | 21 |
| Yeshiva of Far Rockaway Derech Ayson Rabbinical Seminary | Far Rockaway, NY | 190752 | 5 | 38 | 38 | 0 | 0 |
| Yeshiva of Machzikai Hadas | Brooklyn, NY | 455257 | 5 | 373 | 373 | 0 | 0 |
| Yeshiva of Nitra Rabbinical College | Mount Kisco, NY | 197674 | 7 | 243 | 243 | 24 | 24 |
| Yeshiva of the Telshe Alumni | Riverdale, NY | 431983 | 5 | 116 | 116 | 0 | 0 |
| Yeshivas Be'er Yitzchok | Elizabeth, NJ | 451370 | 5 | 49 | 49 | 0 | 0 |
| Yeshivas Novominsk | Brooklyn, NY | 405058 | 5 | 129 | 129 | 0 | 0 |
| Yeshivat Mikdash Melech | Brooklyn, NY | 197610 | 9 | 131 | 131 | 9 | 9 |
| Yeshivath Viznitz | Monsey, NY | 197735 | 9 | 498 | 498 | 133 | 133 |
| duCret School of Arts | Plainfield, NJ | 184357 | 4 | 41 | 24 | 0 | 0 |
Number of institutions: 248 ... Total undergraduate enrollment: 882,497
Levels: 3-Assoc degree, 4-at least 2, but < 4 years, 5-Bach degree, 6-Postbacc cert, 7 Masters degree, 8 Post-masters cert, 9 Doctors degree
8. GeoPolitics go top
Updated periodically. Voting patterns, citizen voting age population, state legislative districts, congressional districts .. in this metro.
Available in subscription edition.
Notes
• All data are for current vintage county and metro definition.
• Developed by ProximityOne -- Metro Reports (888-364-7656)
• Data sources: ProximityOne, Census Bureau, Bureau of Economic Analysis, Bureau of Labor Statistics, Federal Housing Finance Agency,
National Center for Education Statistics.
Updates go top
The subscription edition updates frequently. Selected items are listed below. Register to receive update notifications.
• Overview lead narrative; quarterly & annual/March.
• Housing Price Index (section 5.4) quarterly.
• Establishments, employment & earnings (section 6.6) quarterly.
• Economic profile and personal income (section 6.1) annual/November.
• Labor market situation (section 6.7) monthly.
• Residential construction; units authorized & value (section 5.3.) monthly.
• Population by county; annual series 2010-2016 (section 4.2.) annual/July.
• Population by county; links for individual counties (section 4.2.) annual/July.
-- includes annual data 2010-2016.
-- includes components of change; race/origin; single year of age; age group summaries.
• Total population and components of change; annual/March.
• Census tracts overview section; annual/December.
• General Demographics section updated/extended; annual/December.
• Gross Domestic Product section; annual/September.
• Higher education institutions; annual/February.
• Metro & county demographic component detailed annual estimates; annual/March.
• School districts in metro & K-12 enrollment; annual/August.
More about schedule and upcoming events ... Calendar ... Upcoming Events ... Find Event
Terms of Use go top
Situation & Outlook Reports are a proprietary resource developed by ProximityOne. There is no warranty of any type associated with any aspect of this report. The user of this document is solely responsible to any use, direct or indirect, that might be made of this document.
Related Resources go top
• Metros main page
• Current estimates and projections: states to 2030, counties & metros to 2020 by age, counties & states to 2060.
• Making Custom Metropolitan Area Maps
• Rental Market Conditions by Metropolitan Area
• Metro Gross Domestic Product
• Housing Price Index
• Establishments, Employment & Earnings
• Regional Economic Information System
• ACS 2014 1-year General Demographics ... Social Characteristics ... Economic Characteristics ... Housing Characteristics
Using this Document go top
The Situation & Outlook Report, a component of the Situation & Outlook, is a core ProximityOne information resource providing insights into characteristics and trends of counties, metropolitan areas, states and the U.S. The Report also provides a gateway to drill-down demographic, economic and business data for smaller geographic areas.
Metropolitan areas include approximately 94 percent of the U.S. population -- 85 percent in metropolitan statistical areas (MSAs) and 9 percent in micropolitan statistical areas (MISAs).
About Metropolitan Areas & Principal Cities -- scroll section go top
Metropolitan Areas are designated by OMB ("Standards for Delineating Metropolitan and Micropolitan Statistical Areas") based
mainly on Census Bureau-sourced data.
Metropolitan areas are defined as Metropolitan Statistical Areas (MSA) and Micropolitan Statistical Areas (MISA).
MSAs and MISAs are also referred to a Core-Based Statistical Areas (CBSAs).
Contiguous CBSAs are defined as Combined Statistical Areas (CSA).
By definition, metropolitan areas are comprised of one or more contiguous counties. Metropolitan areas are not single cities and typically include many cities. Metropolitan areas are comprised of urban and rural areas and often have large expanses of rural territory. A business and demographic-economic synergy exists within each metro; metros often interact with adjacent metros. The demographic-economic make-up of metros vary widely and change often. See more about metros.
Principal Cities. The largest city in each metropolitan or micropolitan statistical area is designated a "principal city." Principal cities are designated by OMB based on Census-sourced data. Additional cities qualify as principal cities if specified requirements are met concerning population size and employment. The title of each metropolitan or micropolitan statistical area consists of the names of up to three of its principal cities and the name of each state into which the metropolitan or micropolitan statistical area extends. Titles of metropolitan divisions also typically are based on principal city names but in certain cases consist of county names.
One or more principal cities are designated within each Metropolitan Statistical Area (MSA) and Micropolitan Statistical Area (MISA). The term "principal city" is defined in the OMB "Standards for Delineating Metropolitan and Micropolitan Statistical Areas." A principal city is an OMB designation applied to one or more incorporated places and/or census designated places (CDPs). The OMB standards designate a Principal City (or Cities) of a Core-Based Statistical Area (CBSA) as determined by:
a) The largest incorporated place with a 2010 Census population of at least 10,000 in the CBSA or,
if no incorporated place of at least 10,000 population is present in the CBSA,
the largest incorporated place or census designated place in the CBSA; and
b) Additional places with 2010 Census population of at least 250,000 or in which 100,000 or more persons work; and
c) Additional places with 2010 Census population of 50,000-250,000,
and number of workers working in the place meets or exceeds the number of workers living in the place; and
d) Additional places with 2010 Census population of 10,000-50,000, and at least one-third the population size of the largest place,
and in which the number of workers working in the place meets or exceeds the number of workers living in the place.
ProximityOne User Group go top
Join the ProximityOne User Group to keep up-to-date with new developments relating to metros and component geography decision-making information resources. Receive updates and access to tools and resources available only to members. Use this form to join the User Group.
Support Using these Resources go top
Learn more about accessing and using demographic-economic data and related analytical tools. Join us in a Data Analytics Lab session. There is no fee for these one-hour Web sessions. Each informal session is focused on a specific topic. The open structure also provides for Q&A and discussion of application issues of interest to participants.
Additional Information go top
ProximityOne develops geographic-demographic-economic data and analytical tools and helps organizations knit together and use diverse data in a decision-making and analytical framework. We develop custom demographic/economic estimates and projections, develop geographic and geocoded address files, and assist with impact and geospatial analyses. Wide-ranging organizations use our tools (software, data, methodologies) to analyze their own data integrated with other data. Follow ProximityOne on Twitter at www.twitter.com/proximityone. Contact us (888-364-7656) with questions about data covered in this section or to discuss custom estimates, projections or analyses for your areas of interest.
Copyright © 2018 ProximityOne