|
|
|
-- tools, data & methods -- Jefferson City, MO; November 17, 2015 Join us at the K-12 Schools Data Analytics Workshop. This document provides an overview and registration information. See more about K-12 Schools Data Analytics (resources used in this session) and the School District Community.
Program This program is designed primarily for leadership, managers, educators and K-12 data analysts/researchers seeking to advance data analytics skills in using school and school district related geographic, demographic and economic data and data analytics. Goals associated with use of these data, tools and methods are to improve K-12 educational outcomes and educational opportunities. Each participant receives a ready-to-use GIS project and related GIS and data analytics software which they can install on their computer in advance of the sessions. Information is provided below in this section about how to install the K-12 Data Analytics GIS project and software. Participants will learn how to use these data and analytical tools. Upon return to their office, participants may continue to use the resources on a perpetual basis. Topics, Data Resources and Tools Included 1. School District & Community Data Analytics 2. Missouri School Districts & Communities GIS project and datasets • http://proximityone.com/dataresources/guide/ 3. CV XE GIS software (enables immediate use of GIS Project item 1) • http://proximityone.com/cv.htm 4. Examining Demographic-Economic Characteristics of School Districts & Related Geography • using American Community Survey (ACS) 2012, 2013, 2014 data • illustrative profiles (available for all Missouri school districts) - Columbia Public Schools, MO 1-year; Columbia Public Schools, MO 5-year - Columbia, MO 1-year; Columbia, MO 5-year - ZIP Code Area 64112 -- Kansas City, MO area 5-year - Census Tract 29095007400 -- Kansas City, MO 5-year - Jackson County, MO 1-year; Jackson County, MO 5-year - Lee's Summit School District, MO 1-year; Lee's Summit District, MO 5-year Related interactive tables -- all U.S. school districts - General Demographics ... Social Characteristics ... Economic Characteristics ... Housing Characteristics • Missouri Largest School Districts School districts having 65,000 or more population -- ACS 1-year data available annually, 2014 and earlier years
Columbia 93 School District
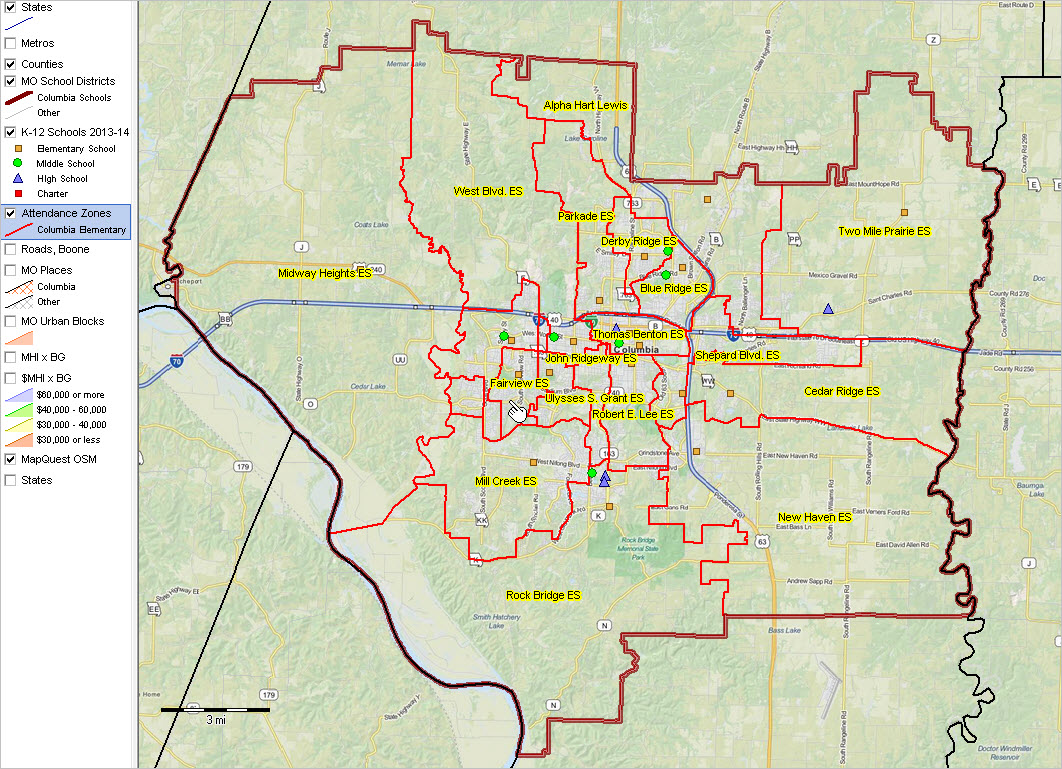
Blue Springs R-IV School District Fort Zumwalt R-II School District Ferguson-Florissant R-II School District Fox C-6 School District Hazelwood School District Independence 30 School District Jefferson City Public Schools Kansas City 33 School District Lee's Summit R-VII School District Mehlville R-IX School District North Kansas City 74 School District Park Hill School District Parkway C-2 School District Rockwood R-VI School District St. Joseph School District Springfield R-XII School District Francis Howell R-III School District St. Louis City School District Wentzville R-IV School District 5. Examining Children's Demographics & Their Living Environment -- by type of enrollment universe • Using ACS 2013 school district special tabulation (SDST) data: http://proximityone.com/sdst0812.htm. • Sample profile: Kansas City Public Schools "Children's Demographic-Economic Profile by Universe of Enrollment" • http://proximityone.com/sdst/sdst0812_2916400.htm (ACS 2012 SDST). • ACS 2013 SDST data new September 2015 • ACS 2012 and 2013 versions available for each Missouri school district • mapping & geospatial analysis 6. Using Missouri School District Attendance Zone Boundary Files • http://proximityone.com/saz.htm • new September 2015 (96% coverage MO districts) • school district boundary shapefiles will be available to each participant • ProximityOne integrated Census 2010 and ACS 2013 data • mapping & geospatial analysis 7. Missouri School District Demographic Projections to 2020 • developed by ProximityOne • new 2015 • mapping & geospatial analysis 8. Using the above data with other K-12 data resources Data Analytics GIS Project & Tools The program makes use of the GIS project and software described below. The GIS project and software are not demos. They are production resources and most datasets cover either the U.S. or state of Missouri. Terms of use. Data and software are provided for your use only. The software nor data may be redistributed. Application results (maps, graphics, tables, etc.) may be used in stories, reports and similar documents including publication on the Web. All usage should show reference use of ProximityOne resources and include a link to this Web page. Participants may optionally use these resources to: • become familiar with the data, tools and operations in advance of the session. • follow-along with operations discussed in the presentation using these data/tools on their own laptop. • develop GIS project variations focused on different districts/areas. Installation of the resources requires Windows computer and Internet connection. 1. Install the ProximityOne CV XE GIS. See related User Guide. ... if you already have CV XE GIS on your computer, skip this step and proceed with item 2. ... run the CV XE GIS installer ... take all defaults during installation 2. Download the K-12 Schools GIS project fileset ... requires ProximityOne User Group ID provided to registrants ... unzip K-12 Schools GIS project files to local folder c:\k12schools 3. Open the c:\k12schools\k12schools.gis project ... after completing the above steps, click File>Open>Dialog ... open the file named c:\k12schools\k12schools.gis 4. Done with installation. The start-up view is shown below. ... if the c:\k12schools\k12schools.gis does not work properly, repeat steps starting with item 2. &nbap; and allow overwrites if prompted. 5. See illustrated steps to use Missouri K-12 GIS project K-12 Schools GIS Project Start-up View Columbia Public Schools, MO school district (bold brown boundary) shown in regional context. See more information about the K-12 Schools GIS project 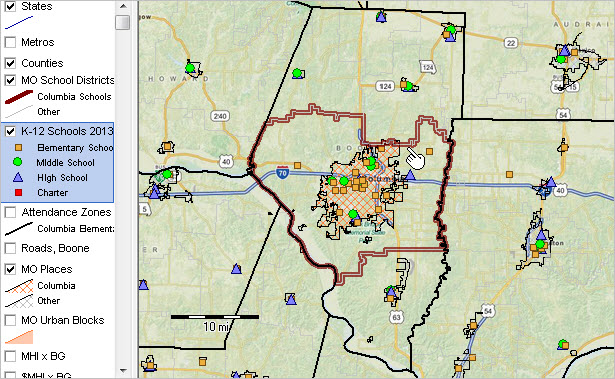 Other K-12 Schools GIS Projects • McKinney ISD, TX (Dallas area) • Tomball ISD, TX (Houston area) ProximityOne User Group Join the ProximityOne User Group to keep up-to-date with new developments relating to metros and component geography decision-making information resources. Receive updates and access to tools and resources available only to members. Use this form to join the User Group. Support Using these Resources Learn more about accessing and using demographic-economic data and related analytical tools. Join us in a Data Analytics Lab session. There is no fee for these one-hour Web sessions. Each informal session is focused on a specific topic. The open structure also provides for Q&A and discussion of application issues of interest to participants. Additional Information ProximityOne develops geographic-demographic-economic data and analytical tools and helps organizations knit together and use diverse data in a decision-making and analytical framework. We develop custom demographic/economic estimates and projections, develop geographic and geocoded address files, and assist with impact and geospatial analyses. Wide-ranging organizations use our tools (software, data, methodologies) to analyze their own data integrated with other data. Follow ProximityOne on Twitter at www.twitter.com/proximityone. Contact ProximityOne (888-364-7656) with questions about data covered in this section or to discuss custom estimates, projections or analyses for your areas of interest. |
|
|