

|
|
New York City & Metro Demographic Economic Patterns and Trends -- expanding insights through data analytics -- examining components of change and county characteristics
March 2020 .. examining how the New York City region by county and subcounty demographics, economy and infrastructure are changing ... What are the trends; what is causing the change? What are the characteristics of the population moving in and out? How might this impact living environment and business? Use the interactive table below to examine demographic-economic characteristics of the 2,604 census tracts comprising the 7-county extended New York City area -- New York City 5 counties plus Westchester and Nassau counties. New York City in Context of New York-Newark MSA The following graphic shows the New York-Newark Metropolitan Statistical Area (MSA) region and counties. The MSA is shown by the green fill pattern and includes the 5-county New York City area shown with salmon fill pattern. Click graphic for larger view (shows county names); expand browser window for best quality view. 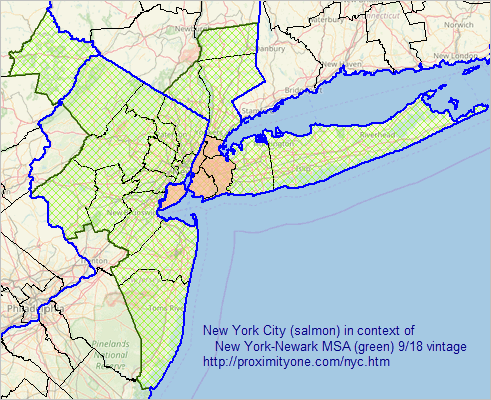 .. view developed with ProximityOne CV XE GIS and related GIS project. View New York metro county components using this table - enter CBSA code 35620 in the Find CBSACode edit box and click find button. - the 23 New York-Newark MSA counties are displayed. - sort/rank/compare population and components of change by county/metro over time 2010-2018. How & Why the New York-Newark Metro is Changing The following graphic shows how and why the NYC metro counties have gained population (blue and green) and lost population (orange and red) during the period 2010 to 2018. Click graphic for larger view; expand browser window for best quality view. Larger view shows county names and 2018 population. 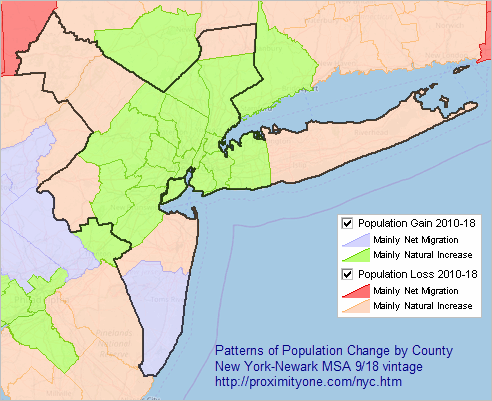 .. view developed with ProximityOne CV XE GIS and related GIS project. Seven County Focus Area .. goto top The following view shows the seven county focus area (green fill pattern counties); the focus of the drill-down in in subsequent views. The focus area is comprised of the 5-county New York City area plus Westchester and Nassau counties. View shows county name with state-county FIPS code. The 7-county focus area includes 2,674 tracts; New York City (5 counties) includes 2,167 Census 2010 census tracts. 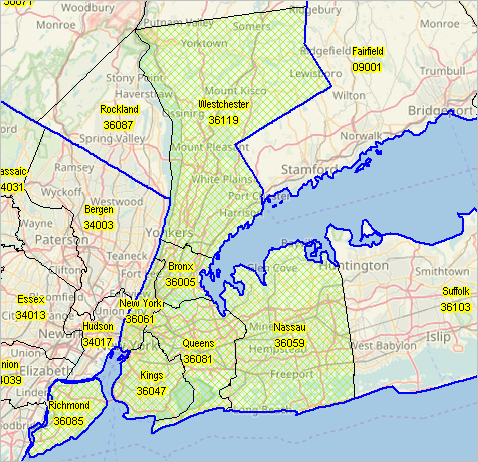 County Demographic Trend Profiles .. goto top Developed using the ProximityOne Outlook2060 integrated software and database, the following profiles for the 7-county area show demographic characteristics and trends for annually for the period 2010 through 2018. • Westchester County • Bronx County (Bronx Borough) • Kings County (Brooklyn Borough) • New York County (Manhattan Borough) • Queens County (Queens Borough) • Richmond County (Staten Island Borough) • Nassau County Patterns of Economic Prosperity by Neigborhood, ACS 2018 .. goto top The following graphic shows patterns of economic prosperity by census tract based on ACS 2018 median family income. Click graphic for larger view; expand browser window for best quality view. 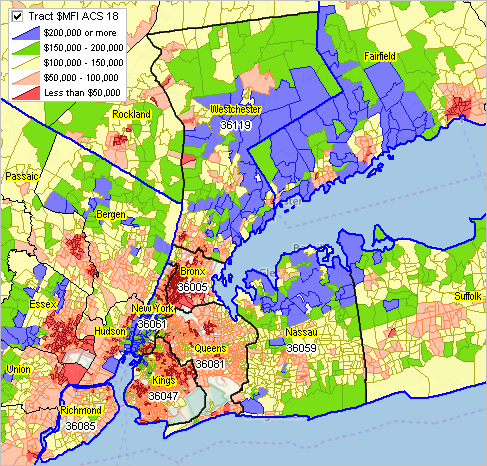 New York City Area Census Tract Demographic-Economic Characteristics .. goto top Interactive table -- contains one row for each tract iterated by selected subject matter items: columns show data for ACS 2013 through ACS 2018 5-year estimates table includes tracts for 7-county focus area (see map view above) Click ShowAll button between Find/Queries. See usage notes below ranking table. See related demographic-economic interactive tables Usage Notes .. goto top • Click ShowAll button between specific queries. • Negative cell value indicates estimate not available. • Click a column header to sort on that column; click again to sort other direction. • Start-up view shows tracts in 7-county area sorted by tract code then subject matter item code. .. first tract displayed (36005000100) happens to be a tract with no housing units, all group quarters population. • Re header cells: these are ACS program years; not an estimate for that year. .. ACS 2018 refers to data from the ACS 2018 5-year estimates program. .. ACS 2018 estimates are estimates for a five year period centric to 2016. Example: from default view (click ShowAll) .. rank tracts of ACS 2018 total population - click button below table "FindItem" .. table refreshes showing total population series for each tract. - dblclick ACS 2018 header cell .. table refreshes ranking tracts on ACS 2018 total population in descending order. .. tract 36005046201 has the ACS 2018 largest population of 28,272. Example: from default view (click ShowAll) .. view profile of tract 36081018900 (see in above example) - click ShowAll. - click FindTract button (has default value 36081018900) .. table refreshes showing all items for that tract. - tract selected for use as it has a median number of ACS 2018 housing units among all New York City tracts. Map View of Tract 36081018900 The following graphic shows a map of the tract used in the above example (see pointer). Labels show tract code (6-digit - within county) and ACS 2018 population. Click graphic for larger view; expand browser window for best quality view. Larger view shows tract in context of broader area (mid Queens). 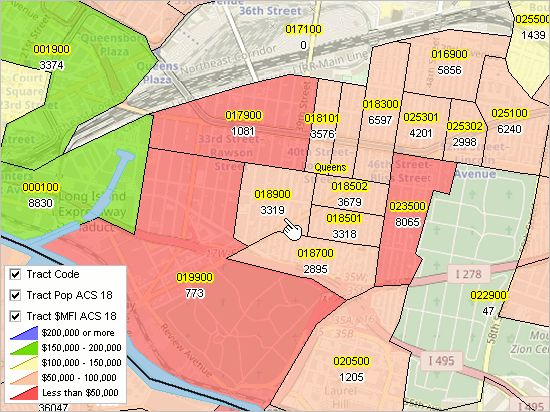 .. view developed with ProximityOne CV XE GIS and related GIS project. Subject Matter in Table -- Codes and Descriptions .. goto top Demographic-economic items shown in the interactive table above are part of a much larger set of items being used to develop current estimates and projections (annually 2018 through 2025). - B01001001E Total Population - B01001002E Male - B01001026E Female - B02001002E White alone - B02001003E Black or African American alone - B02001004E American Indian and Alaska Native alone - B02001005E Asian alone - B02001006E Native Hawaiian and Other Pacific Islander alone - B02001007E Some other race alone - B02001008E Two or more races - B03002012E Hispanic (any race) - B09020001E Population 65 years and over - B11002001E Population in Households - B11001001E Total Households - B11001002E Family Households - B15002001E Population 25 years and over - B15002011E High school graduate (Male, age 25+) - B15002028E High school graduate (Female, age 25+) - B25003001E Total housing units - B25003002E Owner occupied units - B25003003E Renter occupied units - B25002003E Vacant units - B19013001E Median Household Income (top coded at $250,000) - B19113001E Median Family Income (top coded at $250,000) - B25077001E Median housing value (top coded at $1,000,000 ASC 2013-14; $2,000,000 ACS 2015-18) - B25064001E Median gross rent (top coded at $3,500) NYC Area Public Use Microdata Areas (PUMAs) .. goto top The following graphic shows the 55 Public Use Microdata Areas (PUMAs) (bold brown boundaries) in the New York City five counties (black boundaries). See more about PUMAs. ACS 1-year estimates are available by PUMA and enable annual time series analysis of PUMAs, each with a minimum population of 100,000. PUMAs, comprised of sets of contiguous census tracts, cover the U.S. wall-to-wall. In the case of New York City, and many other large counties, PUMAs offer a geographic summary level that sets between census tracts and counties. Click graphic for larger view; expand browser window for best quality view. Larger view shows PUMA codes. 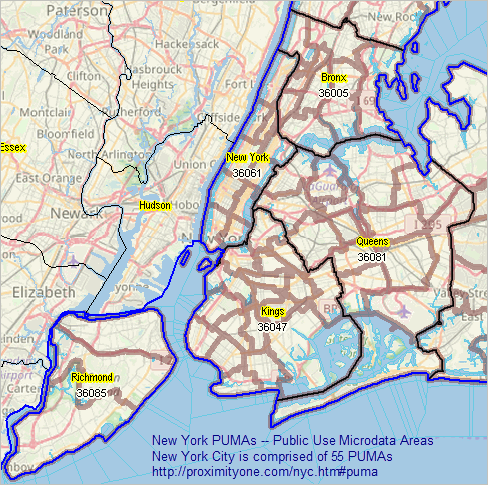 .. view developed with ProximityOne CV XE GIS and related GIS project. Patterns of Housing Unit Change by Census Tract 2010-2019 .. goto top The following graphic shows patterns of housing unit change by census tract 2010-2019, in Queens County. Within each tract, there are three labels: tract code (6-digit - within county) and below the tract code, the Census 2010 housing unit count (left) and the 2019 count of residential addresses in this tract (right). The pointer is located in tract 001900 (full geocode 36081001900). The number of housing units in this tract changed from 1,293 in 2010 to 7,586 in 2019 based on these data. Click graphic for larger view; expand browser window for best quality view. 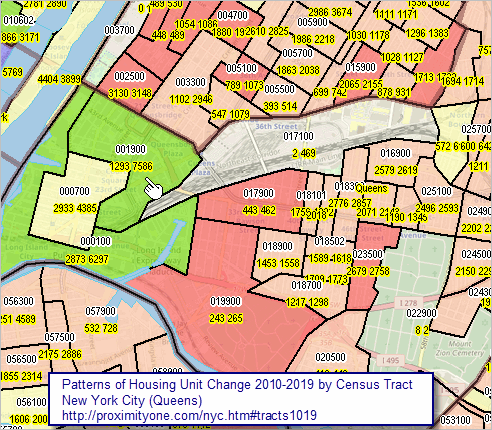 .. view developed with ProximityOne CV XE GIS and related GIS project. Patterns of Housing Unit Change by Census Block 2010-2019 .. goto top The following graphic shows patterns of housing unit change by census block 2010-2019, in Queens County. Within each block, there are three labels: block code (4-digit) and below the block code, the Census 2010 housing unit count (left) and the 2019 count of residential addresses in this block (right). This view shows a zoom-in to tract 001900 shown above. The pointer is located in block 1005 of tract 001900 (full geocode 360810019001005). The number of housing units in this block changed from 467 in 2010 to 2,332 in 2019 based on these data. Click graphic for larger view; expand browser window for best quality view. 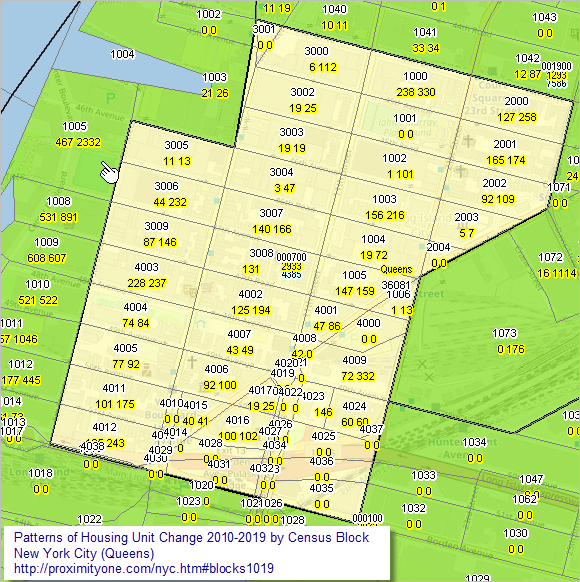 .. view developed with ProximityOne CV XE GIS and related GIS project. Examining Population Components of Change .. goto top Population change can be examined in terms of components of change. There are three components of change: births, deaths, and migration. The change in the population from births and deaths is often combined and referred to as natural increase or natural change. Populations grow or shrink depending on if they gain people faster than they lose them. Examining a county's unique combination of natural change and migration provides insights into why its population is changing and how quickly the change is occurring. Migration Migration is the movement of people from one area to another. It is often expressed as net migration, which is the difference between how many people move into and out of an area. When net migration is positive, a population has more people moving in than out. We split migration into domestic migration and international migration. Domestic migration refers to people moving between areas within the U.S., and is often one of the largest contributors to population change. Use the interactive table to examine counties of interest. International migration refers to people moving into and out of the U.S., and consists of a diverse group of people such as foreign-born immigrants from many countries around the world, members of the U.S. Armed Forces, and U.S. citizens working abroad. In some areas, like the Houston metro area, growth is in part due to net international migration. Adding the net domestic and net international migration yields the net migration. Migration Origin and Destination County-to-county migration can be analyzed using the American Community Survey 5-year estimates migration flows data. While the patterns of migration origin and destination are important to the development of projections, the origin and destination data are implicitly summarized in the net migration data used in this section. Components of Change Analyzing the components of change is an enlightening way to understand how the U.S. population is shifting over time. Looking at counties across the country, we can identify groups of counties that grow (or decline) mainly due to migration and others that grow due to natural increase. Support Using these Resources Learn more about accessing and using demographic-economic data and related analytical tools. Join us in a Data Analytics Lab session. There is no fee for these one-hour Web sessions. Each informal session is focused on a specific topic. The open structure also provides for Q&A and discussion of application issues of interest to participants. ProximityOne User Group Join the ProximityOne User Group to keep up-to-date with new developments relating to metros and component geography decision-making information resources. Receive updates and access to tools and resources available only to members. Use this form to join the User Group. Additional Information ProximityOne develops geodemographic-economic data and analytical tools and helps organizations knit together and use diverse data in a decision-making and analytical framework. We develop custom demographic/economic estimates and projections, develop geographic and geocoded address files, and assist with impact and geospatial analyses. Wide-ranging organizations use our tools (software, data, methodologies) to analyze their own data integrated with other data. Follow ProximityOne on Twitter at www.twitter.com/proximityone. Contact us (888-364-7656) with questions about data covered in this section or to discuss custom estimates, projections or analyses for your areas of interest. |
|
|