
|
|
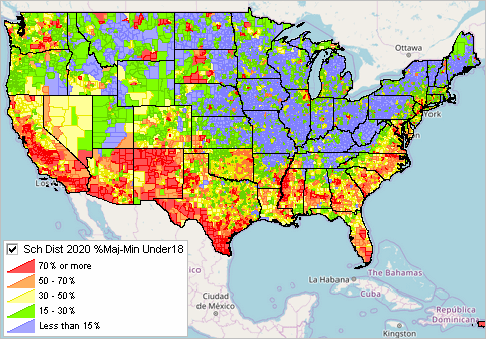
-- Census 2020 demographics for all school districts December 2021 .. access and analyze demographics tabulated from Census 2020 for each of the U.S. 13,266 school districts using the interactive table below and related tools and data described in this section. See more data access options. This section updates later in December with new income and 2021 demographics. Use the Visual Data Analytics (VDA) Web GIS to view/analyze school districts in context of other geography and subject matter (schools, neighborhoods, cities, metros ..). See more about VDA Web GIS. Sign-in and start exploring at cost, no credit card. See more below. Percent Majority-Minority Population Under 18 by School District The graphic below shows percent majority-minority population under 18 years based on Census 2020 by school district. Click graphic for larger view providing more detail. Use the GIS tools to analyze similar patterns for different age groups. Interpreting this map graphic and alternative data resources ... join us in a Data Analytics Lab session where we discuss making and interpreting this map view and alternatives.  - view developed with ProximityOne CV XE GIS and related GIS project. Examine in Context of other Demographic-Economic Data .. goto top • Create Situation & Outlook reports using DEDE .. see this example for Fresno County, CA • Extract data, create datasets, all/selected districts wide ranging subject matter Data Access Options .. goto top Fees may apply. • Use DEDE to access data in report format or create/download file. • Use CV XE GIS to map/geospatially analyze data. • Use VDA Web GIS to map/geospatially analyze data. .. and optionally examine in SQL/spreadsheet form. .. nothing to install; access using any browser/device. • Download file as shown in table below (XLS). School District Demographics; 2020 .. Interactive Table .. goto top Click ShowAll button between queries. Click column header to sort; click again to sort other direction. See usage notes below table Usage Notes -- click ShowAll between queries. An example of selected interactive operations ... Click ShowAll button below tabnle. Click Find StCty button below table with default value of 06019 (Fresno County, CA). .. see that there are 36 school districts that intersect with Fresno County. .. actually where the district central point intersects with the county polygon. Rank on %maj-min column; these districts range from 26.7 to 98.6. Click on “AgeGrps & Housing Units” button to view a “distilled” summary of selected columns. Sort on any column by clicking header cell; click to sort other direction. Try the above steps with your county/CBSA of interest. .. get StCty or CBSA code here (each 5 numeric digits). The core data in the table have been developed by integrating Census 2020 P.L. 94-171 data (extracted using the ProximityOne DEDE software) with the Census 2020 TIGER school district shapefiles. Students 2020-21 are based on NCES reported data. A zero value is not distinguishable between true zero and not reported. Items/Columns in Table
- Name - school district name
- St - state postal abbreviation - St1 - State FIPS code - State District code - Federal District code - SumLev - summary level Elem 950, Sec 960, Unified 970 - number of students 2020-21 school year (NCES CCD) - majority-minority percent -- population under 18 -- population under 18 years -- - Population Under 18 - One Race Under 18 - White Under 18 - Black Under 18 - AIAN Under 18 - Asian Under 18 - Native Hawaiian OPI Under 18 - Other race Under 18 - Multirace Under 18 - Hispanic Under 18 - White NonHisp Under 18 - Black NonHisp Under 18 -- total population -- - Total Population - One Race alone - White alone - Black alone - AIAN alone - Asian alone - Native Hawaiian OPI alone - Other race alone - Multirace - Hispanic - White Non Hispanic - Black Non Hispanic - -- population 18 years and over -- - POP1820 - POP11820 - WH1820 - BL1820 - AI1820 - AS1820 - NH1820 - OR1820 - MR1820 - HS1820 - WHNH1820 - BLNH1820 - GrpQtrs - GrpQtrs Inst - GrpQtrs NonInst - Total housing units - Occupied units - Vacant units School Districts .. goto top Elementary districts are in 26 states in operation as of January 1, 2020. Arizona, California, Connecticut, Georgia, Illinois, Kentucky, Maine, Massachusetts, Michigan, Minnesota, Missouri, Montana, New Hampshire, New Jersey, New York, North Dakota, Oklahoma, Oregon, Rhode Island, South Carolina, Tennessee, Texas, Vermont, Virginia, Wisconsin and Wyoming. Secondary districts are in 20 states in operation as of January 1, 2020. Arizona, California, Connecticut, Georgia, Illinois, Kentucky, Maine, Massachusetts, Minnesota, Montana, New Hampshire, New Jersey, New York, Oklahoma, Oregon, Rhode Island, South Carolina, Tennessee, Texas, and Wisconsin. Unified districts - are in the 50 states and D.C. Examining Schools, School Districts & Communities with VDA Web GIS .. goto top .. this section under development .. but get started now .. see more information. Support Using these Resources Learn more about accessing and using demographic-economic data and related analytical tools. Join us in a Data Analytics Lab session. There is no fee for these one-hour Web sessions. Each informal session is focused on a specific topic. The open structure also provides for Q&A and discussion of application issues of interest to participants. Additional Information ProximityOne develops geodemographic-economic data and analytical tools and helps organizations knit together and use diverse data in a decision-making and analytical framework. We develop custom demographic/economic estimates and projections, develop geographic and geocoded address files, and assist with impact and geospatial analyses. Wide-ranging organizations use our tools (software, data, methodologies) to analyze their own data integrated with other data. Follow ProximityOne on Twitter at www.twitter.com/proximityone. Contact us (888-364-7656) with questions about data covered in this section or to discuss custom estimates, projections or analyses for your areas of interest. |
|
|