
|
|
|
Montgomery County School District, MD Demographic Economic Characteristics
Neighborhood Patterns of Economic Prosperity 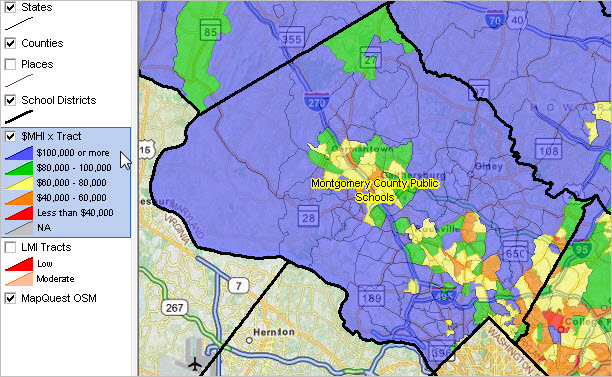 MCPS bold black boundary. Patterns of median household income by census tract. See legend at left of map view. View developed using CV XE GIS and related GIS project. 2012 American Community Survey 5-Year Estimates Items 1-3 below are data based on the 2012 American Community Survey 5-year estimates. More about these data at http://proximityone.com/acs0812.htm. The 2012 5-year estimates are independent of Census 2010 (which included no "richer demographics") and based on the ACS survey data collected 2008 through 2012 (hence centric to 2010). All of these data are annually updated. The ACS 2013 5-year estimates, centric to 2011, will be released in December 2014. Using these annual data, we develop annual time-series data used in models to develop more current estimates, projections and examine demographic-economic trends. 1. The latest MCPS school district comparative analysis profile set may be viewed from the list at http://proximityone.com/sddep.htm#md. • MCPS overview: http://proximityone.com/sddep/24/2400480dep.htm • MCPS General demographics http://proximityone.com/sddep/24/2400480dep1.htm • MCPS Social characteristics http://proximityone.com/sddep/24/2400480dep2.htm • MCPS Economic characteristics http://proximityone.com/sddep/24/2400480dep3.htm • MCPS Housing characteristics http://proximityone.com/sddep/24/2400480dep4.htm 2. This same scope of subject matter is presented for all districts at: • General demographics http://proximityone.com/sd12dp1.htm • Social characteristics http://proximityone.com/sd12dp2.htm • Economic characteristics http://proximityone.com/sd12dp3.htm • Housing characteristics http://proximityone.com/sd12dp4.htm Using these tables you can examine MCPS in context of other districts, rankings, etc. 3. Children's Demographics by Type of Enrollment For school districts based on the ACS school district special tabulation (http://proximityone.com/sdst0812.htm). The MCPS profile is here: http://proximityone.com/sdst/sdst0812_2400480.htm. As you can see by examining these data, they tell you things like (for MCPS) the grade relevant children (centric to 2010 in this case, annually updated) enrolled is 182,025 and 144,000 enrolled public, 38,025 enrolled private and 12,405 not enrolled. Scroll down the table and view the extensive number of characteristics of children that can uniquely be learned about here -- for each of these enrollment categories. Census 2010 & Online Comparative Profiles Compare Census 2010 characteristics for MCPS with other districts and geographies using the http://proximityone.com/s&o_comparative_profiles.htm interactive tool. Administratively Reported Data; Enrollment & Related Compare attributes of MCPS with peer districts in the state or anywhere in the U.S. using data reported by the state education agency. • School Districts interactive tool • K-12 Schools interactive tool Demographic Estimates & Projections • School district demographic-economic estimates and projections (to 2019). http://proximityone.com/schooldistrict_projections.htm • ProximityOne population by age-cohort estimates and projections to 2020; Montgomery County, MD. http://proximityone.com/outlook/1/c102024031.htm • Custom estimates & projections, We develop "hard to estimate populations" and provide related demographic-economic studies. Web sessions Join us in a one hour, no fee, web session where we review accessing and using these data in context of the school district community. "Examining the School District Community & Infrastructure" -- http://proximityone.com/dmis06_sd.htm. Register here. User Group Join the ProximityOne User Group and access wide-ranging analytical tools and data resources available only to members. There is no fee. Join here. Children's Demographics & K-12 Education Main Page See updates and links to related data and tools on the children's demographics & K-12 education main page. CV XE GIS and Related Analytical Tools Visually and geospatially analyze data reviewed here using the CV XE GIS software. Integrate geocoded student data for pattern analysis. Add schools and school attendance zones. Add geographic drill-down demographic-economic data at the census block, block group, census tract and other levels. Analyze neighborhood patterns using a holistic, updatable, set of data. Use the power of visual analysis for collaborative planning and decision-making. These CV XE GIS tools were used to develop the map view at the top of this section. Additional Information ProximityOne develops geographic-demographic-economic data and analytical tools and helps organizations knit together and use diverse data in a decision-making and analytical framework. We develop custom demographic/economic estimates and projections, develop geographic and geocoded address files, and assist with impact and geospatial analyses. Wide-ranging organizations use our tools (software, data, methodologies) to analyze their own data integrated with other data. Follow ProximityOne on Twitter at www.twitter.com/proximityone. Contact ProximityOne (888-364-7656) with questions about data covered in this section or to discuss custom estimates, projections or analyses for your areas of interest. |
|
|