
|
|
|
.. data analytics tip of the day series Data on housing characteristics are estimated annually based on the American Community Survey (ACS). Among the itemns collected is housing value See question 18, page 7, on the ACS 2018 questionnaire). Based on respondent data from this item, and in combination with other items, various attributes of housing value are estimated and tabluated by ZIP code area and many other geographic levels. This section is focused on accessing and using median housing value by ZIP code area .. 5 ways to access/analyze the most recent estimates of median housing value and other subject matter by ZIP Code area .. based on the American Community Survey (ACS) 5-year estimates. Option 1. View the data as a thematic pattern map Option 1 is presented as Option 1A (using CV XE GIS) and Option 1B (using Visual Data Analytics VDA Mapserver). See more about GIS. Option 1A. View $MHV as a thematic pattern map; using CV XE GIS: -- Median Housing Value by ZIP Code Area; Los Angeles Area Click graphic for larger view with more detail. 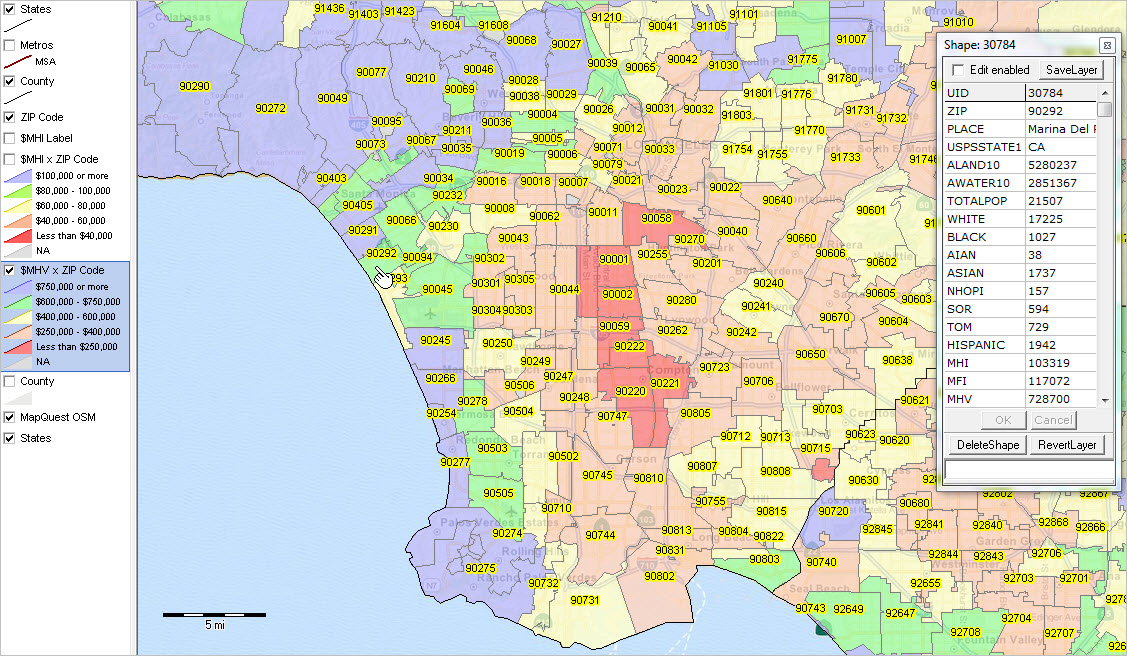
Click graphic for larger view. Use the Mapping ZIP Code Demographics resources to develop similar views anywhere in U.S. Option 1B. View $MHV (ACS 2018) as a thematic pattern map; using VDA Mapserver: -- Median Housing Value by ZIP Code Area; Phoenix/Scottsdale, AZ area 
Click graphic for larger view. Expand window to full screen for best quality view. View features: - profile of ZIP 85258 (blue crosshatch highlight) shown in Attributes panel at left - values-colors shown in Legend panel at left - transparency setting allows "see through" to view ground topology below. Use VDA Mapserver: to develop similar views anywhere in U.S. using only a browser. Nothing to install. Option 2. Use the interactive table: - go to http://proximityone.com/zip18dp4.htm (5-year estimates) - median housing value is item H089; see item list above interactive table. - scroll left on the table until H089 appears in the header column. - that column shows the 2018 ACS H089 estimate for for all ZIP codes. - click column header to sort; click again to sort other direction. - use this table to look up the median housing value for ZIP codes of interest. - see usage notes below table. Option 3. Use the API operation: - develop file containing $MHV for all ZIP code areas in U.S. - load into Excel, other software; link with other data. - median housing value ($MHV) is item B25077_001E. - click this link to get B25077_001E ($MHV) using the API tool. - this API call retrieves U.S. national scope data. - a new page displays showing a line/row for each ZIP code. - median housing value appears on the left, then ZIP code. - optionally save this file and import the data into a preferred program. - more about API tools. Extending option 3 ... accessing race, origin and $MHV for each ZIP code ... click on these example APIs to access data for all ZIP codes .. get extended subject matter for all ZIP codes .. get extended subject matter for two selected ZIP codes (64112 and 65201) Items used in these API calls: .. B01003_001E - Total population Age .. B01001_011E -- Male: 25 to 29 years (illustrating age cohort access) .. B01001_035E -- Female: 25 to 29 years (illustrating age cohort access) Race/Origin .. B02001_002E - White alone .. B02001_003E - Black or African American alone .. B02001_004E - American Indian and Alaska Native alone .. B02001_005E - Asian alone .. B02001_006E - Native Hawaiian and Other Pacific Islander alone .. B02001_007E - Some other race alone .. B02001_008E - Two or more races .. B03001_003E - Hispanic (of any race) Income .. B19013_001E - Median household income ($) .. B19113_001E - Median family income ($) Housing & Households .. B25001_001E - Total housing units .. B25002_002E - Occupied housing units (households) .. B19001_017E -- Households with household income $200,000 or more .. B25003_002E -- Owner Occupied housing units .. B25075_023E --- Housing units value $500,000 to $749,999 .. B25075_024E --- Housing units with value $750,000 to $999,999 .. B25075_025E --- Housing units with value $1,000,000 or more .. B25002_003E - Vacant housing units .. B25077_001E - Median housing value ($) - owner occupied units .. B25064_001E - Median gross rent ($) - renter occupied units View additional subject matter options. Option 4. View the $MHV in context of other attributes for a ZIP code. Using - ACS demographic-economic profiles. Example for ZIP 85258: - General Demographics ACS 2018 .. ACS 2017 - Social Characteristics ACS 2018 .. ACS 2017 - Economic Characteristics ACS 2018 .. ACS 2017 - Housing Characteristics ACS 2018 .. ACS 2017 .. $MHV shown in this profile. Option 5. View 5- and 10-mile circular area profile from ZIP center. - profile for ZIP 80204 dynamically made using SiteReport tool. - with SiteReport running, enter the ZIP code, radii and click Run. - comparative analysis report is generated in HTML and Excel structure. - Click this link to view resulting profile. - from the profile, site 2 is 1.9 times the population of site 1. - Site 1 $MHV is $296,998 compared to Site 2 $MHV $269,734. - GIS view with integrated radius shown below.  ProximityOne User Group ... goto top Join the ProximityOne User Group to keep up-to-date with new developments relating to metros and component geography decision-making information resources. Receive updates and access to tools and resources available only to members. Use this form to join the User Group. Support Using these Resources Learn more about accessing and using demographic-economic data and related analytical tools. Join us in a Data Analytics Lab session. There is no fee for these one-hour Web sessions. Each informal session is focused on a specific topic. The open structure also provides for Q&A and discussion of application issues of interest to participants. Additional Information ProximityOne develops geodemographic-economic data and analytical tools and helps organizations knit together and use diverse data in a decision-making and analytical framework. We develop custom demographic/economic estimates and projections, develop geographic and geocoded address files, and assist with impact and geospatial analyses. Wide-ranging organizations use our tools (software, data, methodologies) to analyze their own data integrated with other data. Follow ProximityOne on Twitter at www.twitter.com/proximityone. Contact us (888-364-7656) with questions about data covered in this section or to discuss custom estimates, projections or analyses for your areas of interest. |
|
|