
|
|
|
K-12 Schools Data Analytics -- tools, data & methods to reach goals and objectives
Data Analytics can help a K-12 school, school system or school district more effectively reach their goals and objectives. Whether traditional, charter, public or private, similar tools and methods apply. This section provides an overview of using geographic-demographic-economic data, Geographic Information System (GIS) tools and data analytics methods for analysis of K-12 schools located in Tomball ISD school district, Texas. Tomball ISD is used as an example. Similar data and analyses are available for any school or school district. Tools and methods described here can help leadership, staff and stakeholders answer key questions and facilitate strategic planning. ProximityOne provides strategic planning advisory services to K-12 schools, school districts and stakeholder organizations. We develop K-12 schools data analytics resources for individual schools, school districts, states, regions and the U.S. In addition, we geocode and integrate student data into GIS and analytical applications, develop or redistrict school attendance zones, provide enrollment projections by school by grade annually to 2025, assist with performance analyses and analyze patterns of student movers. We install these resources on school/school district computers for ongoing data analytics. Contact us ... leave a message in the text section or call 888.364.7656. Examining Where We Are Now While most schools and school districts know a lot about the students, often less is known about children's living environment and the broader school district community. See the demographic-economic profile for the Tomball ISD total population. The profile tells a story. It helps stakeholders know "where we are now." These profiles are available for all school districts. See more information. Based on data from the American Community Survey (ACS 5-year data), these same data can be used in the interactive ranking tables to compare and contrast one district with another, districts in a state or a peer group. The ACS School District Special Tabulation provides similar data but for the grade relevant population by type of enrollment universe. See Tomball ISD Children's Demographic-Economic Profile by Universe of Enrollment. Small area demographic-economic data can be used to examine children's living environment in vicinity of a school. • Census block and block group level data from Census 2010. - see illustrative view below. • Block group data from the annually updated American Community Survey (ACS 5 year estimates). - see illustrative view below. • Attributes of students enrolled in the school from the U.S. Department of Education. - see illustrative view below. More geographically detailed characteristics for neighborhoods and school locations are reviewed below in this section. Tomball ISD School District in Context Tomball ISD (bold brown boundary) shown in regional context. 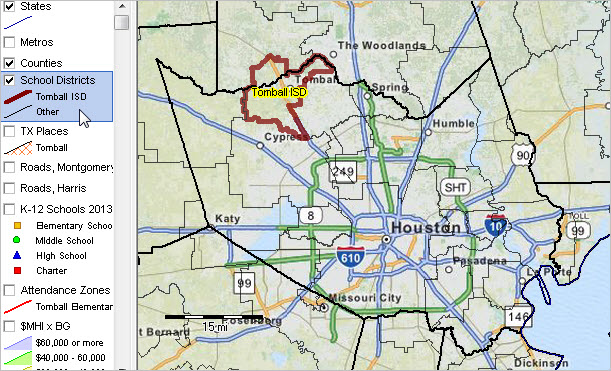 -- view created using CV XE GIS and associated GIS Project -- click graphic for larger showing details. School Locations in Context [goto top] Zoom-in to Tomball ISD. Pointer at county boundary; Tomball ISD is located partly in Montgomery County and partly Harris County. Schools are shown by different types of markers. See markers/style in legend at left. Using the query feature, it is possible to identify charter schools as one type of marker, irrespective of grade range. Use the national scope interactive tables to examine characteristics of individual public schools and individual private schools. Rank, query, compare and contrast schools within a state or on a national basis. 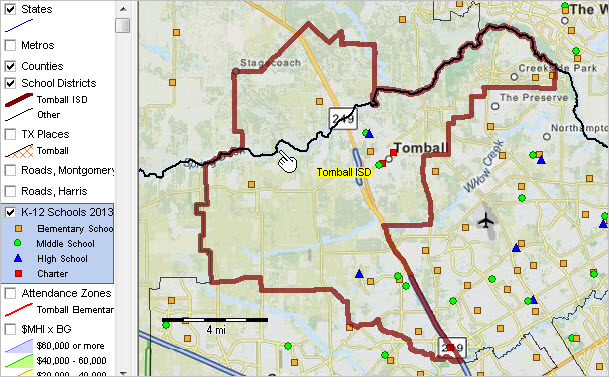 -- view created using CV XE GIS and associated GIS Project -- click graphic for larger showing details. Zoom-in View of Schools; School Characteristics [goto top] Further zoom-in shows schools labeled with name. The identify tool is used to show a mini-profile of a school by clicking on the Tomball El school marker. The partial view of the profile shows free and reduced lunch participation and enrollment by grade. 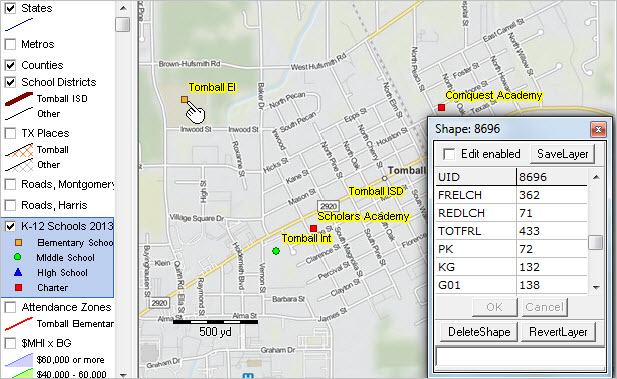 -- view created using CV XE GIS and associated GIS Project -- click graphic for larger showing details. School Attendance Zones [goto top] Elementary school attendance (red boundaries) are shown in the next graphic. Tomball ISD has three types of attendance zones (elementary, middle, high school). The query feature is used to show only elementary zones, labeled with the zone name. 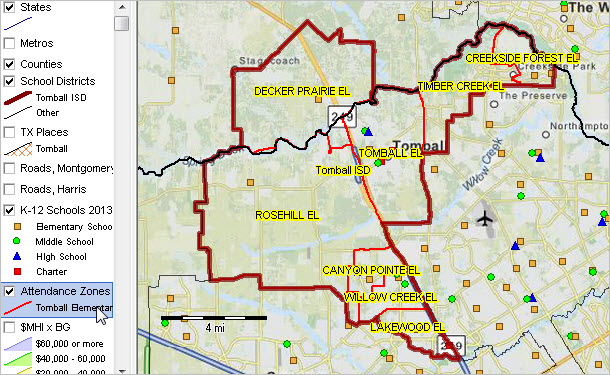 -- view created using CV XE GIS and associated GIS Project -- click graphic for larger showing details. Cities/Places & School District [goto top] Cities/places are shown in the next graphic (cross-hatch pattern) in context with the school district. Places are non-incorporated areas of population concentration. The pointer is located on a section of Houston city outside of and as it enters into the district. Does the City of Houston intersect with Tomball ISD? Yes. 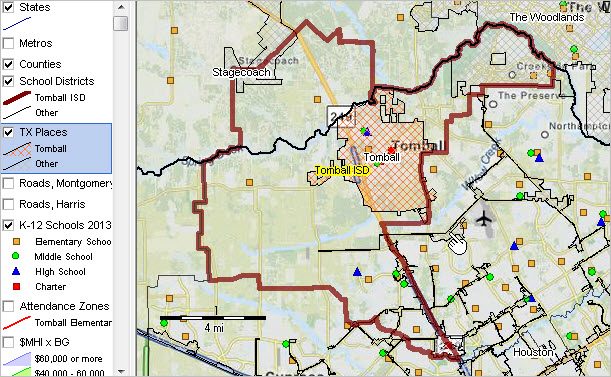 -- view created using CV XE GIS and associated GIS Project -- click graphic for larger showing details. Road Infrastructure [goto top] Roads/streets are added to the view as shown in the next graphic. Vital to student transportation planning and management, the street density view also helps view the scope of build-out. 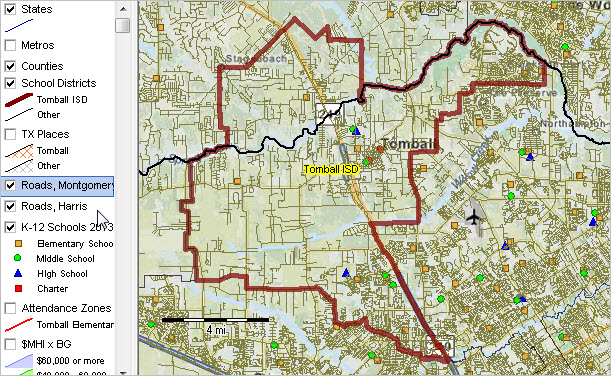 -- view created using CV XE GIS and associated GIS Project -- click graphic for larger showing details. Schools in Context of Urban/Rural Geography [goto top] Census blocks are categorized as urban or rural based on Census 2010. The graphic below shows urban census blocks with an orange fill pattern. It is easy see that the school near the pointer is located in a predominately rural area. It is also easy to see what parts of the school district are urban or rural and how the urbanization of one district compares to another. See related K-12 Schools by Urban/Rural Status . 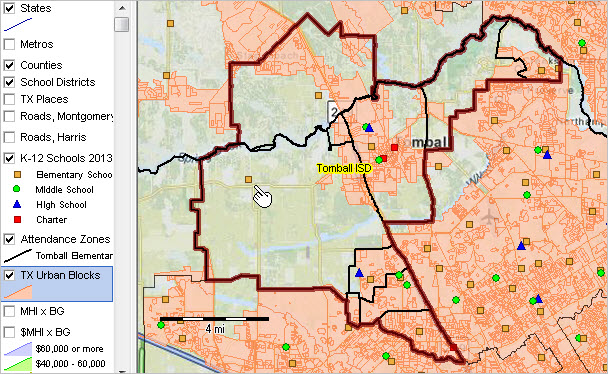 -- view created using CV XE GIS and associated GIS Project -- click graphic for larger showing details. Patterns of Economic Prosperity by Block Group [goto top] Block groups are statistically defined geographic areas covering the U.S. wall-to-wall 217,740 areas). The view below shows patterns of economic prosperity, as measured by the median household income (MHI), MHI interval/color patterns are shown in the highlighted layer at left of the map. Click on graphic to view larger version that uses the MHI as a label for each BG. It is easy to see the MHI for the three BGs in vicinity of Decker Prairie ES (see pointer in map). Choose from hundreds of demographic-economic measures to assess patterns of well-being, age distribution, housing structure and age, educational attainment, housing value, race/origin, employment, language spoken at home among many others. 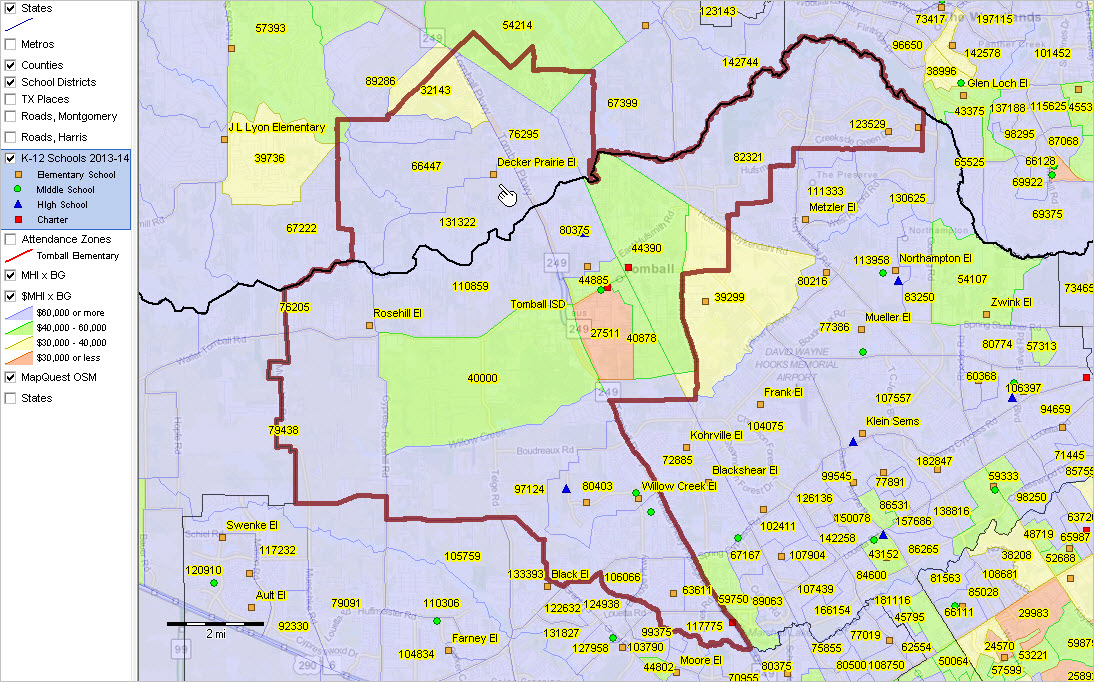 -- view created using CV XE GIS and associated GIS Project -- click graphic for larger showing details. Support Using these Resources Learn more about demographic economic data and related analytical tools. Join us in a Data Analytics Lab session. There is no fee for these Web sessions. Each informal session is focused on a specific topic. The open structure also provides for Q&A and discussion of application issues of interest to participants. ProximityOne User Group Join the ProximityOne User Group to keep up-to-date with new developments relating to geographic-demographic-economic decision-making information resources. Receive updates and access to tools and resources available only to members. Use this form to join the User Group. Additional Information ProximityOne develops geographic-demographic-economic data and analytical tools and helps organizations knit together and use diverse data in a decision-making and analytical framework. We develop custom demographic/economic estimates and projections, develop geographic and geocoded address files, and assist with impact and geospatial analyses. Wide-ranging organizations use our software, data and methodologies to analyze their own data integrated with other data. Follow ProximityOne on Twitter at www.twitter.com/proximityone. Contact ProximityOne (888-364-7656) with questions about data covered in this section or to discuss custom estimates, projections or analyses for your areas of interest. |
|
|