
|
|
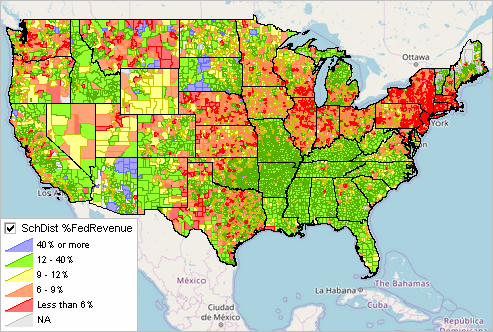
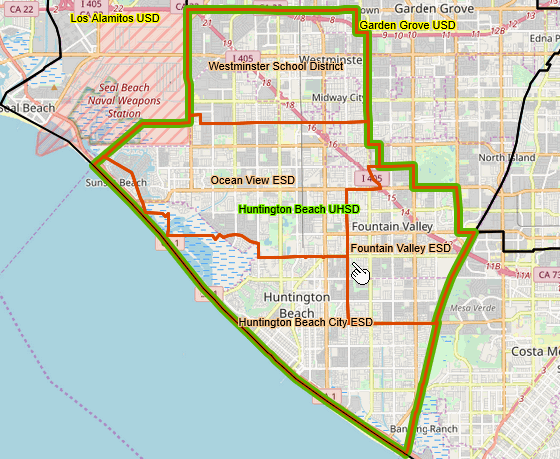
-- mapping & geospatial analysis of K-12 schools and school districts August 2023 .. this section summaries the scope, access to and use of the K-12 Schools & School Districts (K12) GIS project. K12 GIS project includes a wide range of data on K-12 schools and school districts together with other types of geography and subject matter. The purpose of the K12 GIS project is to support mapping and geospatial analysis of K-12 schools and school districts on a local to national scale to facilitate locational analysis, planning, and evaluation. There are now two K-12 GIS projects available via VDA Web GIS (start). .. these use the same GIS files but have a different start-up view and settings. .. Select the project from the project manager form. K-12 Schools/School Districts 1 .. start-up: zoom-in view of the Huntington Beach, CA area .. relationship between elementary and secondary districts .. enables examination of schools and school attendance zones. K-12 Schools/School Districts 2 .. start-up: U.S. contiguous states .. patterns of total Federal revenue as a percent of total revenue by school district. School District Sources & Uses of Funds  .. click graphic for larger view K12 Analytics Windows Tool • c:\k12\k12.exe K12 GIS project .. may be used with: • CV XE GIS • VDA Desktop GIS • VDA Web GIS (nothing to install, use any device) Click here to start using the K12 GIS project now Start-up View of the K12 GIS Project .. goto top .. the start-up view of the K12 GIS project using VDA Desktop GIS is shown below. .. 4 elementary districts (orange boundaries) each offering grades K-8 education. .. 1 secondary district (green bold boundary) offering grades 9-12 education. and covering the same ground area as the 4 K-8 districts. .. see School District Geography & GeoSpatial Analysis for details about this view. .. click graphic for larger view showing the legend panel  About the K12 GIS Project .. goto top The K12 GIS project is comprised of these layers:
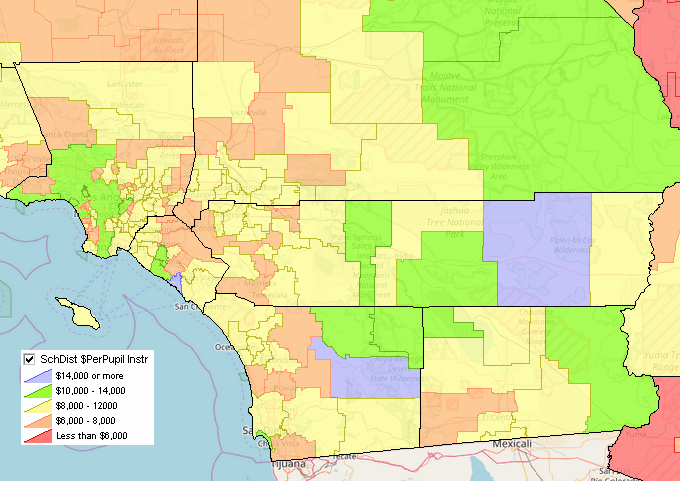
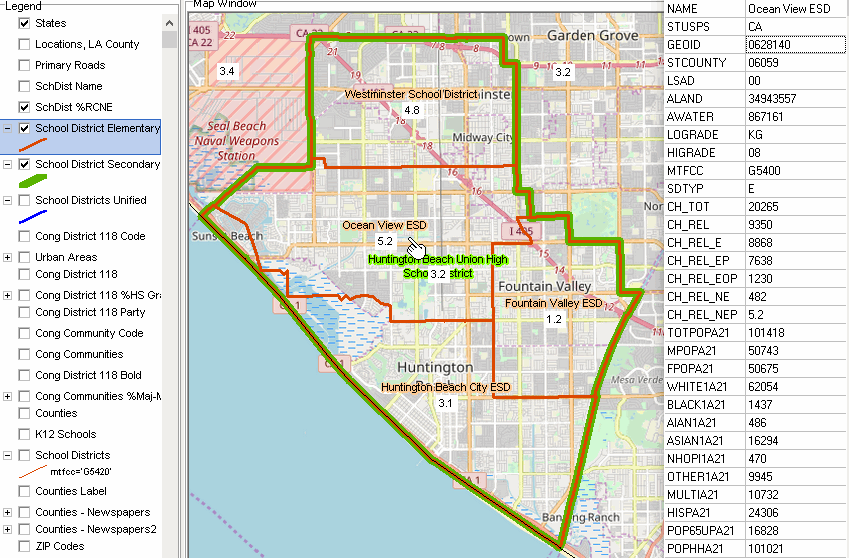
School District Finances .. goto top School district finance data, sources and uses of funds, are sourced from the Census Bureau Annual Survey of School System Finances .. Public Elementary-Secondary Education Finance. These data are collected by the Census Bureau under sponsorship of the National Census For Education Statistics (CCD fiscal data). The latest data available for 2021 are used in this GIS project. See more about these data in the 2021 School District Finances documentation. Per Pupil Instruction Expenditure by District .. goto top .. the start-up view of the K12 GIS project using VDA Desktop GIS is shown below .. click graphic for larger view showing the legend panel  Codes -1 † indicates that the data are not applicable. -2 – indicates that the data are missing. -3 ‡ indicates that the data do not meet data quality standards. Huntington Beach CA Area School Districts -- goto top Below is an illustration of the relationship among "stacked" districts; 4 elementary and 1 secondary -- start-up view. Refer to the School District Special Tabulation table. The button in the third row below the table, marked "Group2 5 Areas (enter LEA ID)" has been populated with the LEA ID for all five Huntington Beach school areas. Here is the view of the interactive table after the "Group2 5 Areas (enter LEA ID)" button is clicked. The table shows 4 component elementary districts and 1 secondary district. Please note, the total populations for each of the 4 elementary districts sum to the same 321,439 as the secondary district. This population is the total population for all residents in the area, not just children. The population of total children in the school district is shown in the Total Children column. The number of total children in the 4 elementary districts sums to the same 65,208 figure as the secondary district. The figure of 65,208 exceeds the total listed in the Relevant Children (Rel Children) column, which totals 47,449. In other words, Relevant Children are the school age children, for grades offerred by that district, including 18 and 19 year olds who have not yet finished high school (for those districts offering grade 12). The 17,759 who are not included in the relevant children total have not yet reached school attending age for the purposes of the survey according to the parameters set by each district. The next four columns indicate the number of relevant children enrolled, those who are enrolled in public school, those who are enrolled in something other than public school, and those who are not enrolled. For each district, the sum of those enrolled in public schools, enrolled in other schools, and those not enrolled equals the total number of relevant children. Note: Relevant Children Not Enrolled is figure only found here. It is a not a figure that school districts or the National Center for Education Statistics reports. The view of the interactive table when Group2 button clicked. .. shows list of 4 component elementary districts comprising 1 secondary districts.  A view of 4 elementary districts (orange) comprising ground equivalent of 1 secondary district (green). .. profile of OceanView ESD shown at right.  Navigating and Using the K12 GIS Project .. goto top In general, consult the appropriate reference for the tool being used: • CV XE GIS guide • VDA Desktop GIS Guide • VDA Web GIS Guide These additional notes apply to VDA Web GIS after opening the K12 GIS project. .. see related notes above about starting VDA Web GIS and opening the K12 GIS project. .. the notes below assume you are using a freshly opened K12 GIS project and no addtional settings have been made. ProximityOne User Group .. goto top Join the ProximityOne User Group to keep up-to-date with new developments relating to metros and component geography decision-making information resources. Receive updates and access to tools and resources available only to members. Use this form to join the User Group. Data Analytics Web Sessions Learn more about accessing and using demographic-economic data and related analytical tools. Join us in a Data Analytics Lab session. There is no fee for these one-hour Web sessions. Each informal session is focused on a specific topic. The open structure also provides for Q&A and discussion of application issues of interest to participants. Additional Information ProximityOne develops geodemographic-economic data and analytical tools and helps organizations knit together and use diverse data in a decision-making and analytical framework. We develop custom demographic/economic estimates and projections, develop geographic and geocoded address files, and assist with impact and geospatial analyses. Wide-ranging organizations use our tools (software, data, methodologies) to analyze their own data integrated with other data. Follow ProximityOne on Twitter at www.twitter.com/proximityone. Contact us (888-364-7656) with questions about data covered in this section or to discuss custom estimates, projections or analyses for your areas of interest. |
|
|