
|
|
|
ZIP Code Demographics by City-Place & Outside City-Places
Census 2010 data provide a way to examine ZIP Code demographics by city/place as well as areas outside city/places. Many ZIP codes transcend city/place boundaries extending into non-city/place areas or other city/places. Use data described in this section to view which ZIP codes serve a city/place and corresponding demographics. See which places and non-places are served by a specific ZIP code and associated demographics. See this example showing a map and tabular data depiction. Sort the ranking table below to see that the Place/ZIP code areas with the largest population include Chicago/60629 (113,916), El Paso/79936 (111,086), New York/11368 (109,931) and Norwalk CA/90650 (105,549) and Los Angeles/90011 (103,892) ... the population of these ZIP code areas exceed the population of many metros. Census 2010 ZIP Code Tabulation Areas (ZCTAs) and Places geographies are both comprised of sets of census blocks. Census block level data from the Census 2010 Summary File 1 (SF1) have been aggregated into ZIP code-Place parts to develop data presented in the ranking table. Data in the ranking table are part of the ProximityOne national ZIP Code-Place demographic dataset. See additional details. Census 2010 ZIP Code Area population & housing interactive ranking table, national scope, all ZIP codes -- http://proximityone.com/cen2010_zcta_dp.htm Use the ranking table to view a city/place by ZIP code and selected associated demographics for each ZIP code portion in that city/place. Examine how ZIP codes are split by specific place and non-place areas. City/ZIP combinations with population 10 or less are not shown in the table but are in included in related dataset. Nationally, there are 69,979 unique City or Non-City/ZIP combinations with population of 10 or more. See related ranking table with total ZIP code population (ZIP code not split) at http://proximityone.com/cen2010_zcta_dp.htm. ZIP Code Demographics by City-Place and Outside Cities - Interactive Ranking Table See ranking table usage notes below ranking table. See related ranking tables -- http://proximityone.com/rankingtables.htm. All data based on Census 2010 Summary File 1. See column header descriptions below table. Click ShowAll button between Find/Queries. Using the Ranking Table • Click on a column header to sort on that column; click column header again to sort in other direction. • Click ShowAll button to show all tabulation areas and restore full set of data view. • Click State to select on geographies in a selected state (click ShowAll between selections). • Area Name Query -- key in text/area name in text box to right of Find-in-Name button then click button to locate all matches. - case sensitive; click ShowAll button between queries. • Place Code Query -- key in place code in text box to right of Find-in-Place button then click button to locate all matches. - place code must be FIPS 5 digit code, lead zero as applicable); click ShowAll button between queries. • ZIP Code Query -- key in ZIP code in text box to right of Find-in-ZIP button then click button to locate all matches. - ZIP code must be FIPS 5 digit code, lead zero as applicable); click ShowAll button between queries. Place-ZIP combinations with fewer than 10 persons omitted from table. Column Headers • Area Name • Place -- Census 2010-based Place Code • ZIP -- Census 2010-based ZIP Code Tabulation Area • State -- State postal code Census 2010 SF1-sourced population aggregated from census blocks: • Population • Housing • %White A - Percent Population White alone (P0030002) • %Black A - Percent Population Black or African American alone (P0030003) • %AI/AN A - Percent Population American Indian and Alaska Native alone (P0030004) • %Asian A - Percent Population Asian alone (P0030005) • %NHOPI A - Percent Population Native Hawaiian and Other Pacific Islander alone (P0030006) • %OthRace A - Percent Population Some Other Race alone (P0030007) • %2+Races - Percent Population Two or More Races (P0030008) • %Hispanic - Percent Population Hispanic or Latino (P0040003) -- percents are percentages of total population in this ZCTA Mapping City-ZIP Code Areas The following view shows a zoom-in to the Beverly Hills area in Los Angeles County, CA. This view was developed using the Mapping ZIP Code Demographics GIS Project. Beverly Hills city is shown with a red boundary and labeled with city name. The ZIP code areas are shown with ZIP codes as labels and color fill patterns corresponding to median household income values (see in legend panel at left of map). ZIP codes 90211 and 90212 are wholly contained within Beverly Hills. ZIP code area 90210 in partly within Beverly Hills and partly outside Beverly Hills. Using the interactive table above, it is possible to view demographics for the parts of the ZIP code area within the city and outside of the city. See the next graphic. 
The following graphic illustrates use of the Find in Place Code (06308) to show those ZIP code parts of the ZIP code areas, and demographics, that intersect with this city/place. To develop this view, click ShowAll, select California, key in 06308 as place code and click Find in Place button. The sum of those ZIP code total population values (those parts intersecting the city) is 14,142 + 8,434 + 11,529 = 34,105. The same method of examining city/place by ZIP code area part can be applied to any area of the U.S. 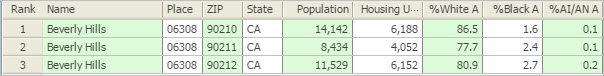
The next view shows all ZIP code rows for ZIP code 90210. To develop this view, click ShowAll, select California, key in 90210 as ZIP code and click Find in ZIP button. This graphic shows how ZIP code 90210 intersects with other place-related geography. Part of 90210 in in Beverly Hills (population 14,142 and as also shown in graphic above) while the other two parts are in Los Angeles city and an unincorporated area. The same method of examining city/place by ZIP code area part can be applied to any area of the U.S. 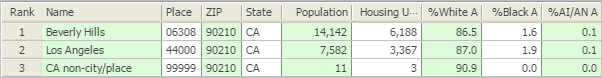
ZIP Code Tabulations Data presented in the ranking table sum to the total population/housing units for the corresponding state. The demographic characteristics for each census block in each state are aggregated into a ZIP-Place or ZIP-Outside Places combination. For those blocks outside of city/places, the place code of 99999 is used. When a ranking table row shows the place code 99999, the area is not in a city/place and the area name appears as 'Not in a city/place.' There are many instances of ZIP-Place combinations that show zero or nearly zero population. These areas are often geographic slivers, almost lines. ZIP Code Equivalence Files The following 2010 ZIP Code (ZCTA) equivalence/relationship files are available. Contact us for details (888-364-7656). • ZIP to County • ZIP to County Subdivision • ZIP to Place • ZIP to Census Tract • ZIP to Congressional District • ZIP to Metropolitan and Micropolitan Statistical Areas Support Using these Resources Learn more about demographic economic data and related analytical tools. Join us in a Data Analytics Web session. There is no fee for these Web sessions. Each informal session is focused on a specific topic. The open structure also provides for Q&A and discussion of application issues of interest to participants. ProximityOne User Group Join the ProximityOne User Group to keep up-to-date with new developments relating to geographic-demographic-economic decision-making information resources. Receive updates and access to tools and resources available only to members. Use this form to join the User Group. Additional Information ProximityOne develops geographic-demographic-economic data and analytical tools and helps organizations knit together and use diverse data in a decision-making and analytical framework. We develop custom demographic/economic estimates and projections, develop geographic and geocoded address files, and assist with impact and geospatial analyses. Wide-ranging organizations use our tools (software, data, methodologies) to analyze their own data integrated with other data. Follow ProximityOne on Twitter at www.twitter.com/proximityone. Contact ProximityOne (888-364-7656) with questions about data covered in this section or to discuss custom estimates, projections or analyses for your areas of interest. |
|
|