
| Decision-Making Information |
|
ProximityOne information resources & solutions (888) DMI-SOLN (888) 364-7656 Put data to work more effectively. Certificate in Data Analytics Power of Combining Maps with Data Support & Technical Assistance help using these resources Metro in Regional Context 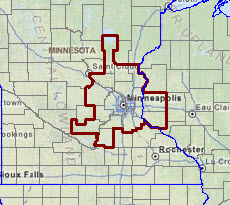 |
Situation & Outlook Report
Minneapolis-St. Paul-Bloomington, MN-WI Metropolitan Statistical Area (CBSA 33460)
Geographic-Demographic-Economic Characteristics -- access other areas
See about updates.
This section is no longer being updated. Access the permanent replacement section at http://proximityone.com/cbsa/1/cbsa33460.htm. Please bookmark this new URL.
Access 2018 S&O Reports, featuring county and metro projections to 2030, via the interactive table at http://proximityone.com/metros.htm. The 2018 reports are similar but have been greatly expanded and updated.
Contents of this Report
This document is organized into these sections:
1. Recent Trends & Outlook
Summary of recent business, demographic, economic trends; year-ahead & 5-year outlook.
- the Recent Trends & Outlook section, updated quarterly, covers topics about this metro such as .. assessing the implications of next jobs report .. impact of Fed''s interest rate action .. which sectors are expanding or contracting .. housing market conditions .. insights to help your planning and decision-making. The Recent Trends & Outlook section is available in the subscription edition.
2. Overview & Update
The total population of the Minneapolis-St. Paul-Bloomington, MN-WI MSA metro changed from 3,355,540 in 2010 to 3,495,656 in 2015, a change of 169,043 (5%). Among all 917 metros, this metro was ranked number 16 in 2010 and 16 in 2015, based on total population. Annual net migration was 10,699 (2011), 9,802 (2012), 13,851 (2013), 12,064 (2014), 12,064 (2015). View annual population estimates and components of change table. See more about population characteristics below.
This metro is projected to have a total population in 2020 of 3,698,877. The projected population change from 2010 to 2020 is 343,772 (10.2%). The population ages 65 years and over is projected to change from 372,335 (2010) to 603,936 (2020), a change of 231,601 (62.2%). See more about population projections.
Based on per capita personal income (PCPI), this metro was ranked number 37 in 2008 and 44 in 2014. among the 917 metros for which personal income was estimated.The PCPI changed from $47,956 in 2008 to $53,166 in 2014, a change of $5,210 (10.9%). Per capita personal income (PCPI) is a comprehensive measure of individual economic well-being. Use the interactive table to compare PCPI in this metro to other metros. See more about PCPI in Economic Characteristics section below.
282 metropolitan statistical areas, of the total 381, experienced an increase in real Gross Domestic Product (GDP) between 2009 and 2014. This metro ranked number 14 among the 381 metros based on 2014 GDP. The GDP (millions of current dollars) changed from $192,594 in 2009 to $235,733 in 2014 a change of $43,139 (22.4%). Real GDP (millions of real, inflation adjusted, dollars) changed from $192,594 in 2009 to $216,891 in 2014, a change of $24,297 (12.62%). GDP is the most comprehensive measure of metro economic activity. GDP is the sum of the GDP originating in all industries in the metro. See more about GDP in Economic Characteristics section below.
Attributes of driil-down, small area geography within the metro ... metros account for 65,744 of the national scope 73,056 census tracts (others are in non-metro areas). This metro is comprised of 789 tracts covering the metro wall-to-wall. View, rank, compare demographic-economic attributes of these tracts using the interactive tables. Use the CBSA code 33460; see table usage details below the table.
Fortune 1000 Companies with headquarters in this metro.
• 3M Company
• Ameriprise Financial, Inc.
• Best Buy Co., Inc.
• C. H. Robinson Worldwide, Inc.
• CHS Inc.
• Donaldson Company, Inc.
• Ecolab Inc.
• General Mills, Inc.
• H.B. Fuller Company
• Land O'Lakes, Inc.
• Medtronic, Inc.
• Michael Foods Group, Inc
• Patterson Companies, Inc.
• Polaris Industries Inc.
• Regis Corporation
• Securian Financial Group, Inc.
• St. Jude Medical, Inc.
• Supervalu Inc.
• Target
• The Mosaic Company
• The Toro Company
• The Valspar Corporation
• Thrivent Financial for Lutherans
• U.S. Bancorp
• UnitedHealth Group
• Xcel Energy Inc.
Number in this metro: 26. Extended data & analysis in subscription edition.• Ameriprise Financial, Inc.
• Best Buy Co., Inc.
• C. H. Robinson Worldwide, Inc.
• CHS Inc.
• Donaldson Company, Inc.
• Ecolab Inc.
• General Mills, Inc.
• H.B. Fuller Company
• Land O'Lakes, Inc.
• Medtronic, Inc.
• Michael Foods Group, Inc
• Patterson Companies, Inc.
• Polaris Industries Inc.
• Regis Corporation
• Securian Financial Group, Inc.
• St. Jude Medical, Inc.
• Supervalu Inc.
• Target
• The Mosaic Company
• The Toro Company
• The Valspar Corporation
• Thrivent Financial for Lutherans
• U.S. Bancorp
• UnitedHealth Group
• Xcel Energy Inc.
3. Lay of the Land & Neighborhood Patterns of Economic Prosperity go top
3.1. Lay of the Land go top
Lay of the Land. The following map shows the metro with bold boundary.
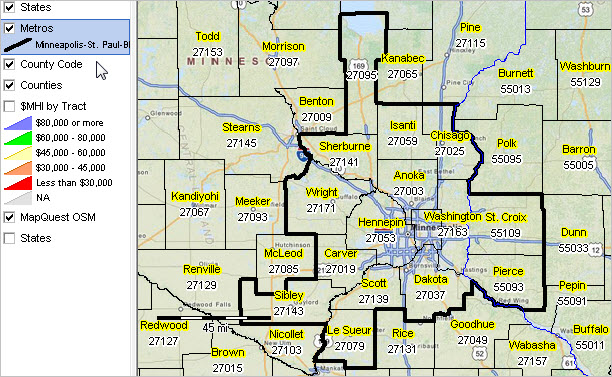
Counties are labeled with county name and state-county FIPS code.
View developed with CV XE GIS software. See this section to learn about making custom metro maps.
3.2. Patterns of Economic Prosperity by Neighborhood go top
Median household income by census tract (see color/data legend at left of map).
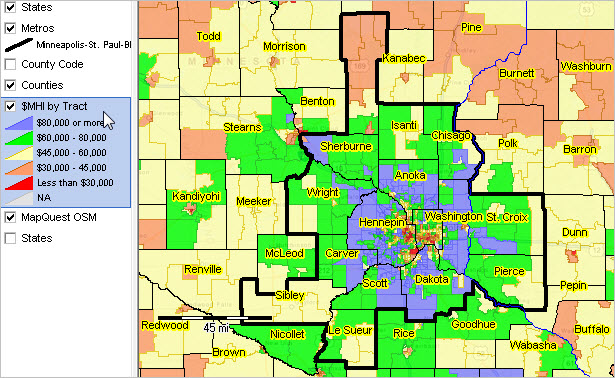
View developed with CV XE GIS software. See this section to learn about making custom metro maps.
4. Population Characteristics & Trends go top
Updated monthly, quarterly, annually. Housing market conditions and extended detail Available in subscription edition.
4.1. Component City Characteristics go top
Principal Cities (about principal cities); Click link to view city profile.
• Bloomington
• Eagan
• Eden Prairie
• Minneapolis
• Plymouth
• St. Paul
Cities 10,000 population and over; click link to view city profile.
| Area | Census 2010 | July 1 2010 | July 1 2011 | July 1 2012 | July 1 2013 | July 1 2014 | Change 2010-14 | %Change 2010-14 |
| Andover, MN (2701486) | 30,598 | 30,661 | 30,837 | 31,171 | 31,666 | 31,996 | 1,335 | 4.40 |
| Anoka, MN (2701720) | 17,142 | 17,157 | 17,155 | 17,233 | 17,248 | 17,276 | 119 | 0.70 |
| Apple Valley, MN (2701900) | 49,084 | 49,133 | 49,790 | 49,969 | 50,233 | 50,487 | 1,354 | 2.80 |
| Big Lake, MN (2705752) | 10,060 | 10,103 | 10,188 | 10,245 | 10,308 | 10,360 | 257 | 2.50 |
| Blaine, MN (2706382) | 57,186 | 57,396 | 58,128 | 59,353 | 60,386 | 61,190 | 3,794 | 6.60 |
| Bloomington, MN (2706616) | 82,893 | 83,036 | 83,917 | 86,060 | 86,397 | 86,314 | 3,278 | 3.90 |
| Brooklyn Center, MN (2707948) | 30,104 | 30,160 | 30,426 | 30,676 | 30,770 | 30,729 | 569 | 1.90 |
| Brooklyn Park, MN (2707966) | 75,781 | 75,970 | 76,889 | 77,769 | 78,442 | 78,728 | 2,758 | 3.60 |
| Buffalo, MN (2708452) | 15,453 | 15,493 | 15,642 | 15,726 | 15,807 | 15,912 | 419 | 2.70 |
| Burnsville, MN (2708794) | 60,306 | 60,408 | 60,655 | 61,128 | 61,482 | 61,630 | 1,222 | 2.00 |
| Champlin, MN (2710846) | 23,089 | 23,140 | 23,478 | 23,699 | 23,817 | 23,828 | 688 | 3.00 |
| Chanhassen, MN (2710918) | 22,952 | 23,081 | 23,504 | 23,903 | 24,481 | 24,967 | 1,886 | 8.20 |
| Chaska, MN (2710972) | 23,770 | 23,821 | 23,974 | 24,088 | 24,464 | 24,838 | 1,017 | 4.30 |
| Columbia Heights, MN (2712700) | 19,496 | 19,519 | 19,551 | 19,651 | 19,655 | 19,675 | 156 | 0.80 |
| Coon Rapids, MN (2713114) | 61,476 | 61,541 | 61,506 | 61,879 | 62,027 | 62,112 | 571 | 0.90 |
| Cottage Grove, MN (2713456) | 34,589 | 34,694 | 34,912 | 35,191 | 35,415 | 35,630 | 936 | 2.70 |
| Crystal, MN (2714158) | 22,151 | 22,166 | 22,357 | 22,523 | 22,602 | 22,605 | 439 | 2.00 |
| Eagan, MN (2717288) | 64,206 | 64,258 | 64,526 | 64,853 | 65,485 | 66,084 | 1,826 | 2.80 |
| East Bethel, MN (2717486) | 11,626 | 11,637 | 11,613 | 11,586 | 11,601 | 11,642 | 5 | 0.00 |
| Eden Prairie, MN (2718116) | 60,797 | 60,856 | 61,610 | 62,220 | 62,596 | 63,228 | 2,372 | 3.90 |
| Edina, MN (2718188) | 47,941 | 47,997 | 48,636 | 49,060 | 49,428 | 49,596 | 1,599 | 3.30 |
| Elk River, MN (2718674) | 22,974 | 23,048 | 23,258 | 23,277 | 23,444 | 23,746 | 698 | 3.00 |
| Farmington, MN (2720618) | 21,086 | 21,154 | 21,472 | 21,921 | 22,177 | 22,571 | 1,417 | 6.70 |
| Forest Lake, MN (2721770) | 18,375 | 18,413 | 18,687 | 18,963 | 19,142 | 19,399 | 986 | 5.40 |
| Fridley, MN (2722814) | 27,208 | 27,229 | 27,311 | 27,618 | 27,645 | 27,670 | 441 | 1.60 |
| Golden Valley, MN (2724308) | 20,371 | 20,375 | 20,580 | 20,761 | 20,846 | 20,866 | 491 | 2.40 |
| Ham Lake, MN (2726738) | 15,296 | 15,320 | 15,380 | 15,537 | 15,718 | 15,888 | 568 | 3.70 |
| Hastings, MN (2727530) | 22,172 | 22,191 | 22,261 | 22,327 | 22,453 | 22,566 | 375 | 1.70 |
| Hopkins, MN (2730140) | 17,591 | 17,618 | 17,796 | 17,995 | 18,054 | 18,056 | 438 | 2.50 |
| Hudson, WI (5536250) | 12,719 | 12,724 | 12,867 | 12,997 | 13,153 | 13,415 | 691 | 5.40 |
| Hugo, MN (2730392) | 13,332 | 13,450 | 13,656 | 13,838 | 14,091 | 14,239 | 789 | 5.90 |
| Inver Grove Heights, MN (2731076) | 33,880 | 33,908 | 34,055 | 34,197 | 34,380 | 34,709 | 801 | 2.40 |
| Lakeville, MN (2735180) | 55,954 | 56,106 | 56,625 | 57,334 | 58,617 | 59,866 | 3,760 | 6.70 |
| Lino Lakes, MN (2737322) | 20,216 | 20,256 | 20,530 | 20,738 | 20,840 | 20,948 | 692 | 3.40 |
| Maple Grove, MN (2740166) | 61,567 | 61,799 | 63,200 | 64,431 | 65,463 | 66,945 | 5,146 | 8.30 |
| Maplewood, MN (2740382) | 38,018 | 38,077 | 38,778 | 39,402 | 39,840 | 40,199 | 2,122 | 5.60 |
| Mendota Heights, MN (2741696) | 11,071 | 11,079 | 11,115 | 11,139 | 11,181 | 11,222 | 143 | 1.30 |
| Minneapolis, MN (2743000) | 382,578 | 383,062 | 388,253 | 392,966 | 400,647 | 407,207 | 24,145 | 6.30 |
| Minnetonka, MN (2743252) | 49,734 | 49,784 | 50,626 | 51,120 | 51,402 | 51,486 | 1,702 | 3.40 |
| Monticello, MN (2743774) | 12,759 | 12,804 | 12,897 | 12,961 | 13,022 | 13,136 | 332 | 2.60 |
| Mounds View, MN (2744530) | 12,155 | 12,174 | 12,316 | 12,428 | 12,554 | 12,657 | 483 | 4.00 |
| New Brighton, MN (2745430) | 21,456 | 21,483 | 21,694 | 21,899 | 22,112 | 22,266 | 783 | 3.60 |
| New Hope, MN (2745628) | 20,339 | 20,367 | 20,569 | 20,741 | 20,813 | 20,792 | 425 | 2.10 |
| North Branch, MN (2746798) | 10,125 | 10,130 | 10,078 | 10,009 | 10,096 | 10,160 | 30 | 0.30 |
| North St. Paul, MN (2747221) | 11,460 | 11,477 | 11,615 | 11,714 | 11,852 | 12,224 | 747 | 6.50 |
| Oakdale, MN (2747680) | 27,378 | 27,421 | 27,575 | 27,714 | 27,779 | 28,033 | 612 | 2.20 |
| Otsego, MN (2749138) | 13,571 | 13,657 | 13,913 | 14,129 | 14,520 | 15,047 | 1,390 | 10.20 |
| Plymouth, MN (2751730) | 70,576 | 70,684 | 71,658 | 72,928 | 74,023 | 75,057 | 4,373 | 6.20 |
| Prior Lake, MN (2752594) | 22,796 | 22,984 | 23,331 | 23,882 | 24,471 | 25,039 | 2,055 | 8.90 |
| Ramsey, MN (2753026) | 23,668 | 23,722 | 23,864 | 24,049 | 24,908 | 25,598 | 1,876 | 7.90 |
| Richfield, MN (2754214) | 35,228 | 35,262 | 35,599 | 36,099 | 36,217 | 36,179 | 917 | 2.60 |
| River Falls, WI (5568275) | 15,000 | 15,047 | 15,032 | 15,012 | 15,015 | 15,175 | 128 | 0.90 |
| Robbinsdale, MN (2754808) | 13,953 | 13,964 | 14,126 | 14,265 | 14,319 | 14,320 | 356 | 2.50 |
| Rosemount, MN (2755726) | 21,874 | 21,947 | 22,220 | 22,418 | 22,685 | 22,998 | 1,051 | 4.80 |
| Roseville, MN (2755852) | 33,660 | 33,707 | 34,047 | 34,652 | 34,988 | 35,319 | 1,612 | 4.80 |
| Savage, MN (2758738) | 26,911 | 26,998 | 27,364 | 27,976 | 28,704 | 29,208 | 2,210 | 8.20 |
| Shakopee, MN (2759350) | 37,076 | 37,360 | 38,013 | 38,783 | 39,275 | 39,677 | 2,317 | 6.20 |
| Shoreview, MN (2759998) | 25,043 | 25,083 | 25,412 | 25,668 | 25,971 | 26,194 | 1,111 | 4.40 |
| South St. Paul, MN (2761492) | 20,160 | 20,169 | 20,365 | 20,404 | 20,458 | 20,487 | 318 | 1.60 |
| St. Louis Park, MN (2757220) | 45,250 | 45,287 | 45,747 | 46,369 | 47,458 | 47,502 | 2,215 | 4.90 |
| St. Michael, MN (2757346) | 16,399 | 16,450 | 16,599 | 16,761 | 16,870 | 17,087 | 637 | 3.90 |
| St. Paul, MN (2758000) | 285,068 | 285,468 | 288,884 | 291,244 | 295,431 | 297,640 | 12,172 | 4.30 |
| Stillwater, MN (2762824) | 18,225 | 18,293 | 18,386 | 18,568 | 18,686 | 18,800 | 507 | 2.80 |
| Vadnais Heights, MN (2766460) | 12,302 | 12,332 | 12,542 | 12,784 | 13,004 | 13,143 | 811 | 6.60 |
| Waconia, MN (2767432) | 10,697 | 10,740 | 10,928 | 11,231 | 11,492 | 11,774 | 1,034 | 9.60 |
| West St. Paul, MN (2769700) | 19,540 | 19,549 | 19,590 | 19,709 | 19,773 | 19,806 | 257 | 1.30 |
| White Bear Lake, MN (2769970) | 23,797 | 23,815 | 24,114 | 24,332 | 24,589 | 24,986 | 1,171 | 4.90 |
| Woodbury, MN (2771428) | 61,961 | 62,239 | 63,523 | 64,512 | 65,665 | 66,807 | 4,568 | 7.30 |
All places time series population estimates interactive table.
4.2. Component County Characteristics go top
Updated periodically, annually. General demographics, social characteristics and extended detail Available in subscription edition.
Metropolitan areas are defined as one or more contiguous counties based on a set of demographic-economic criteria. Counties comprising the metro are shown below. For multi-county metros, this section provides insights into how the population is changing by county. Many metros changed geographic composition (counties included in the metro) between the Census 2010 vintage and the current vintage. These changes, if any, are also shown below (county is marked with **). See projections in related section.Click county code link to view county components of change.
** indicates this county added since Census 2010 vintage metro definition.
All counties interactive tables General Demographics | Social | Economic | HousingMetropolitan areas are defined as one or more contiguous counties based on a set of demographic-economic criteria. Counties comprising the metro are shown below. For multi-county metros, this section provides insights into how the population is changing by county. Many metros changed geographic composition (counties included in the metro) between the Census 2010 vintage and the current vintage. These changes, if any, are also shown below (county is marked with **). See projections in related section.Click county code link to view county components of change.
| Area | July 1 2010 | Pct | July 1 2011 | Pct | July 1 2012 | Pct | July 1 2013 | Pct | July 1 2014 | Pct | July 1 2015 | Pct |
| Metro Summary ... more details | 3,355,540 | 100.0 | 3,389,626 | 100.0 | 3,423,250 | 100.0 | 3,460,826 | 100.0 | 3,495,656 | 100.0 | 3,524,583 | 100.0 |
| Anoka County, MN (27003) | 331,453 | 9.9 | 332,877 | 9.8 | 336,021 | 9.8 | 339,027 | 9.8 | 341,742 | 9.8 | 344,151 | 9.8 |
| Carver County, MN (27019) | 91,394 | 2.7 | 92,843 | 2.7 | 93,923 | 2.7 | 95,671 | 2.8 | 97,396 | 2.8 | 98,741 | 2.8 |
| Chisago County, MN (27025) | 53,917 | 1.6 | 53,742 | 1.6 | 53,479 | 1.6 | 53,728 | 1.6 | 53,928 | 1.5 | 54,293 | 1.5 |
| Dakota County, MN (27037) | 399,188 | 11.9 | 401,977 | 11.9 | 404,925 | 11.8 | 408,508 | 11.8 | 412,182 | 11.8 | 414,686 | 11.8 |
| Hennepin County, MN (27053) | 1,154,250 | 34.4 | 1,169,437 | 34.5 | 1,184,617 | 34.6 | 1,199,581 | 34.7 | 1,212,097 | 34.7 | 1,223,149 | 34.7 |
| Isanti County, MN (27059) | 37,884 | 1.1 | 38,243 | 1.1 | 38,239 | 1.1 | 38,175 | 1.1 | 38,394 | 1.1 | 38,429 | 1.1 |
| Le Sueur County, MN (27079) ** | 27,701 | 0.8 | 27,809 | 0.8 | 27,650 | 0.8 | 27,664 | 0.8 | 27,748 | 0.8 | 27,663 | 0.8 |
| Mille Lacs County, MN (27095) ** | 26,095 | 0.8 | 25,884 | 0.8 | 25,737 | 0.8 | 25,842 | 0.7 | 25,794 | 0.7 | 25,788 | 0.7 |
| Ramsey County, MN (27123) | 509,428 | 15.2 | 515,945 | 15.2 | 521,288 | 15.2 | 528,056 | 15.3 | 533,634 | 15.3 | 538,133 | 15.3 |
| Scott County, MN (27139) | 130,537 | 3.9 | 132,681 | 3.9 | 135,265 | 4.0 | 137,533 | 4.0 | 139,470 | 4.0 | 141,660 | 4.0 |
| Sherburne County, MN (27141) | 88,799 | 2.6 | 89,286 | 2.6 | 89,555 | 2.6 | 90,251 | 2.6 | 91,208 | 2.6 | 91,705 | 2.6 |
| Sibley County, MN (27143) ** | 15,234 | 0.5 | 15,182 | 0.4 | 15,109 | 0.4 | 15,040 | 0.4 | 14,897 | 0.4 | 14,875 | 0.4 |
| Washington County, MN (27163) | 238,995 | 7.1 | 241,609 | 7.1 | 244,138 | 7.1 | 246,686 | 7.1 | 249,320 | 7.1 | 251,597 | 7.1 |
| Wright County, MN (27171) | 125,137 | 3.7 | 126,343 | 3.7 | 127,372 | 3.7 | 128,402 | 3.7 | 130,026 | 3.7 | 131,311 | 3.7 |
| Pierce County, WI (55093) | 41,091 | 1.2 | 40,805 | 1.2 | 40,658 | 1.2 | 40,721 | 1.2 | 40,920 | 1.2 | 40,889 | 1.2 |
| St. Croix County, WI (55109) | 84,437 | 2.5 | 84,963 | 2.5 | 85,274 | 2.5 | 85,941 | 2.5 | 86,900 | 2.5 | 87,513 | 2.5 |
All counties population estimates & components of change time series interactive table.
4.2.1. RDEMS County Characteristics
Updated quarterly. For more information, see RDEMS Main.
Links open HSG1 Housing & New Residential Construction section. Select other sections from list above table.
Anoka County, MN
Carver County, MN
Dakota County, MN
Hennepin County, MN
Ramsey County, MN
Scott County, MN
Sherburne County, MN
Washington County, MN
Wright County, MN
St. Croix County, WI
Carver County, MN
Dakota County, MN
Hennepin County, MN
Ramsey County, MN
Scott County, MN
Sherburne County, MN
Washington County, MN
Wright County, MN
St. Croix County, WI
4.3. General Demographic Characteristics
Updated annually. For more information, detail & to compare areas use interactive table.
| Item | 2013 | 2014 | Change 2013-14 | %Change 2013-14 |
| Total Population: Race/Origin | 3,459,146 | 3,495,176 | 36,030 | 1.04 |
| One race | 3,353,045 | 3,387,191 | 34,146 | 1.02 |
| White | 2,792,981 | 2,804,667 | 11,686 | 0.42 |
| Black/African American | 2,792,981 | 2,804,667 | 11,686 | 0.42 |
| American Indian/Alaska Native | 20,530 | 20,290 | -240 | -1.17 |
| Asian alone | 208,466 | 221,429 | 12,963 | 6.22 |
| Native Hawaiian/Pacific Islander | 1,230 | 1,474 | 244 | 19.84 |
| Some other race alone | 68,573 | 67,661 | -912 | -1.33 |
| Two or more races | 106,101 | 107,985 | 1,884 | 1.78 |
| Hispanic or Latino (of any race) | 192,140 | 196,495 | 4,355 | 2.27 |
| Population 25 years and over | 2,312,459 | 2,344,679 | 32,220 | 2.27 |
| % high school graduate or higher | 93.0 | 93.2 | 0.2 | 0.22 |
| % bachelor's degree or higher | 39.3 | 40.0 | 0.7 | 1.78 |
| Total Households | 1,332,110 | 1,337,263 | 5,153 | 1.78 |
| Median household income ($) | 67,194 | 69,111 | 1,917 | 2.85 |
| Mean household income ($) | 86,712 | 91,246 | 4,534 | 5.23 |
| Item | 2013 | 2014 | Change 2013-14 | %Change 2013-14 |
| Total Population: Gender & Age | 3,459,146 | 3,495,176 | 36,030 | 1.04 |
| Male | 1,709,324 | 1,728,205 | 18,881 | 5.23 |
| Female | 1,749,822 | 1,766,971 | 17,149 | 5.23 |
| Under 5 years | 229,262 | 229,547 | 285 | 5.23 |
| 5 to 9 years | 234,580 | 237,832 | 3,252 | 1.39 |
| 10 to 14 years | 238,235 | 236,607 | -1,628 | -0.68 |
| 15 to 19 years | 223,798 | 225,238 | 1,440 | 0.64 |
| 20 to 24 years | 220,812 | 221,273 | 461 | 0.21 |
| 25 to 34 years | 510,594 | 516,670 | 6,076 | 1.19 |
| 35 to 44 years | 458,243 | 458,789 | 546 | 0.12 |
| 45 to 54 years | 506,291 | 502,782 | -3,509 | -0.69 |
| 55 to 59 years | 235,073 | 240,481 | 5,408 | 2.30 |
| 55 to 59 years | 235,073 | 240,481 | 5,408 | 2.30 |
| 60 to 64 years | 191,230 | 196,705 | 5,475 | 2.86 |
| 65 to 74 years | 233,227 | 246,352 | 13,125 | 5.63 |
| 75 to 84 years | 122,231 | 121,952 | -279 | -0.23 |
| 85 years and over | 55,570 | 60,948 | 5,378 | 9.68 |
| Median age | 36.6 | 36.6 | 0.0 | 0.00 |
| 18 years and over | 2,618,190 | 2,651,789 | 33,599 | 1.28 |
| 21 years and over | 2,492,798 | 2,524,805 | 32,007 | 1.28 |
| 62 years and over | 521,742 | 544,298 | 22,556 | 4.32 |
| 65 years and over | 411,028 | 429,252 | 18,224 | 4.43 |
5. Housing Characteristics & Trends go top
Updated monthly, quarterly, annually. Housing market conditions and extended detail Available in subscription edition.
5.1. Total Housing Units
Updated Annually. Independent annual model-based estimates. For more information, detail & to compare areas use interactive table.
| Item | Census 2010 | July 1 2010 | July 1 2011 | July 1 2012 | July 1 2013 | July 1 2014 | Change 2010-2014 | %Change 2010-2014 |
| Total Housing Units | 1,386,721 | 1,387,264 | 1,392,496 | 1,398,231 | 1,407,300 | 1,416,931 | 29,667 | 2.14 |
5.2. General Housing Characteristics
Updated Annually. For more information, detail & to compare areas use interactive table.
| Item | 2013 | 2014 | Change 2013-14 | %Change 2013-14 |
| Housing Units: Units in Structure | 1,406,054 | 1,416,988 | 10,934 | 0.78 |
| 1-unit, detached | 860,512 | 870,539 | 10,027 | 1.17 |
| 1-unit, attached | 149,554 | 153,309 | 3,755 | 2.51 |
| 2 units | 36,410 | 34,726 | -1,684 | -4.63 |
| 3 or 4 units | 30,949 | 28,971 | -1,978 | -6.39 |
| 5 to 9 units | 33,314 | 33,454 | 140 | 0.42 |
| 10 to 20 units | 56,054 | 55,243 | -811 | -1.45 |
| 20 or more units | 216,659 | 217,965 | 1,306 | 0.60 |
| Item | 2013 | 2014 | Change 2013-14 | %Change 2013-14 |
| Housing Units: Occupancy & Tenure | 1,406,054 | 1,416,988 | 10,934 | 0.78 |
| Occupied Housing Units | 1,332,110 | 1,337,263 | 5,153 | 0.39 |
| Owner | 925,512 | 935,151 | 9,639 | 1.04 |
| Renter | 406,598 | 402,112 | -4,486 | -1.10 |
| Vacant Housing Units | 73,944 | 79,725 | 5,781 | 7.82 |
| Homeowner vacancy rate | 1.40 | 0.90 | -0.50 | ... |
| Rental vacancy rate | 3.20 | 3.70 | 0.50 | ... |
| Average household size; owner-occ | 2.67 | 2.68 | 0.01 | 0.37 |
| Average household size; renter-occ | 2.27 | 2.30 | 0.03 | 1.32 |
| Median Value $ owner occupied | 206,100 | 216,400 | 10,300 | 5.00 |
| Median Rent $ renter occupied | 911 | 938 | 27 | 2.96 |
5.3. Residential Construction; Housing Units Authorized & Value
Updated Monthly. 12 most recent months. For more information, detail & to compare areas use interactive table.
| Item | Aug15 | Sep15 | Oct15 | Nov15 | Dec15 | Jan16 | Feb16 | Mar16 | Apr16 | May16 | Jun16 | Jul16 |
| Total Residential Units | 1,248 | 1,389 | 1,272 | 1,139 | 635 | 382 | 575 | 880 | 876 | 1,019 | 1,236 | 1,079 |
| in 1 unit bldgs | 663 | 570 | 607 | 480 | 527 | 352 | 479 | 619 | 674 | 794 | 813 | 665 |
| in 2 unit bldgs | 4 | 8 | 8 | 0 | 4 | 0 | 4 | 2 | 2 | 14 | 4 | 6 |
| in 3-4 unit bldgs | 7 | 3 | 3 | 0 | 7 | 7 | 3 | 8 | 11 | 0 | 0 | 14 |
| in 5+ unit bldgs | 574 | 808 | 654 | 659 | 97 | 23 | 89 | 251 | 189 | 211 | 419 | 394 |
| Bldgs with 5+ units | 21 | 8 | 10 | 7 | 5 | 3 | 3 | 3 | 8 | 13 | 9 | 4 |
| Percent Coverage | 99 | 99 | 99 | 99 | 99 | 99 | 99 | 99 | 99 | 99 | 99 | 99 |
| Value ($000), Total Units | 287,749 | 266,904 | 296,154 | 245,229 | 176,875 | 117,065 | 162,222 | 232,147 | 230,729 | 265,467 | 308,125 | 285,433 |
| 1 unit structures | 200,797 | 169,580 | 182,035 | 146,084 | 165,239 | 112,190 | 156,013 | 185,268 | 199,248 | 231,801 | 249,765 | 195,638 |
| 2 unit structures | 540 | 1,210 | 1,066 | 0 | 642 | 0 | 438 | 338 | 250 | 1,790 | 604 | 630 |
| 3-4 unit structures | 1,367 | 687 | 583 | 0 | 770 | 1,858 | 687 | 1,719 | 1,690 | 0 | 0 | 2,632 |
| 5+ unit structures | 85,045 | 95,427 | 112,470 | 99,145 | 10,224 | 3,017 | 5,084 | 44,822 | 29,541 | 31,876 | 57,756 | 86,533 |
5.4. Housing Price Index go top
Updated quarterly. All transactions; not seasonally adjusted. See related Housing Price Index (HPI) interactive table.
See related 5-Digit ZIP Code HPI interactive table.
| Housing Price Index: | 2015Q3 | 2015Q4 | 2016Q1 | 2016Q2 | 2016Q3 |
| 208.38 | 209.06 | 209.73 | 215.34 | 217.77 | |
| Quarter-to-Quarter/Year Percent Change: | 2015Q3-2015Q4 | 2015Q4-2016Q1 | 2016Q1-2016Q2 | 2016Q2-2016Q3 | 2015Q3-2016Q3 |
| 0.33 | 0.32 | 2.67 | 1.13 | 4.51 |
6.1. Economic Profile go top
The Economic Profile shows shows derivation and key components of total personal income. Data are organized by place of residence and place of work. The place of residence profile includes estimates of total personal income, population, and per capita personal income. The place of work profile includes estimates of total earnings, total employment and average earnings per job. Updated annually. See related interactive table.
Dollar items are in current dollars (not adjusted for inflation). Per capita items in dollars; other dollar items in thousands of dollars.
See related notes.
| Item | 2011 | 2012 | 2013 | 2014 | 2015 | Change 2011-2015 | %Change 2011-2015 |
| Personal income | 163,305,670 | 173,991,959 | 175,413,603 | 186,241,484 | 194,372,260 | 31,066,590 | 19.0 |
| Net earnings 1/ | 111,706,271 | 118,551,162 | 119,979,219 | 126,558,438 | 132,863,845 | 21,157,574 | 18.9 |
| Personal current transfer receipts | 22,676,055 | 22,786,919 | 23,681,690 | 24,913,387 | 25,781,059 | 3,105,004 | 13.7 |
| Income maintenance 2/ | 2,185,754 | 2,351,065 | 2,429,221 | 2,448,811 | 2,431,977 | 246,223 | 11.3 |
| Unemployment insurance compensation | 1,121,913 | 788,277 | 610,851 | 461,756 | 428,488 | -693,425 | -61.8 |
| Retirement and other | 19,368,388 | 19,647,577 | 20,641,618 | 22,002,820 | 22,920,594 | 3,552,206 | 18.3 |
| Dividends, interest, and rent 3/ | 28,923,344 | 32,653,878 | 31,752,694 | 34,769,659 | 35,727,356 | 6,804,012 | 23.5 |
| Population 4/ | 3,389,626 | 3,423,250 | 3,460,826 | 3,495,656 | 3,524,583 | 134,957 | 4.0 |
| Per capita personal income | 48,178 | 50,827 | 50,685 | 53,278 | 55,148 | 6,970 | 14.5 |
| Per capita net earnings | 32,955 | 34,631 | 34,668 | 36,204 | 37,696 | 4,741 | 14.4 |
| Per capita personal current transfer receipts | 6,690 | 6,657 | 6,843 | 7,127 | 7,315 | 625 | 9.3 |
| Per capita income maintenance | 645 | 687 | 702 | 701 | 690 | 45 | 7.0 |
| Per capita unemployment insurance compensation | 331 | 230 | 177 | 132 | 122 | -209 | -63.1 |
| Per capita retirement and other | 5,714 | 5,739 | 5,964 | 6,294 | 6,503 | 789 | 13.8 |
| Per capita dividends, interest, and rent | 8,533 | 9,539 | 9,175 | 9,947 | 10,137 | 1,604 | 18.8 |
| Earnings by place of work | 126,374,468 | 133,834,455 | 137,773,093 | 145,050,881 | 152,041,687 | 25,667,219 | 20.3 |
| Wages and salaries | 95,957,986 | 100,647,725 | 103,951,385 | 109,041,266 | 115,032,706 | 19,074,720 | 19.9 |
| Supplements to wages and salaries | 22,275,321 | 21,484,759 | 21,991,632 | 23,300,132 | 23,500,945 | 1,225,624 | 5.5 |
| Employer cont. for empl. pension & insur. funds 6/ | 14,938,988 | 13,813,552 | 13,988,794 | 15,125,800 | 15,117,455 | 178,467 | 1.2 |
| Employer cont. for government social insurance | 7,336,333 | 7,671,207 | 8,002,838 | 8,174,332 | 8,383,490 | 1,047,157 | 14.3 |
| Proprietors' income | 8,141,161 | 11,701,971 | 11,830,076 | 12,709,483 | 13,508,036 | 5,366,875 | 65.9 |
| Nonfarm proprietors' income | 295,505 | 369,363 | 315,915 | 153,373 | 220,134 | -75,371 | -25.5 |
| Farm proprietors' income | 7,845,656 | 11,332,608 | 11,514,161 | 12,556,110 | 13,287,902 | 5,442,246 | 69.4 |
| Total full-time and part-time employment | 2,274,032 | 2,301,879 | 2,342,673 | 2,382,331 | 2,433,222 | 159,190 | 7.0 |
| Wage and salary jobs | 1,836,776 | 1,867,959 | 1,903,886 | 1,937,817 | 1,975,838 | 139,062 | 7.6 |
| Number of proprietors | 437,256 | 433,920 | 438,787 | 444,514 | 457,384 | 20,128 | 4.6 |
| Number of nonfarm proprietors 7/ | 11,661 | 11,362 | 11,504 | 11,420 | 11,357 | -304 | -2.6 |
| Number of farm proprietors | 425,595 | 422,558 | 427,283 | 433,094 | 446,027 | 20,432 | 4.8 |
| Average earnings per job (dollars) | 55,573 | 58,141 | 58,810 | 60,886 | 62,486 | 6,913 | 12.4 |
| Average wages and salaries | 52,243 | 53,881 | 54,600 | 56,270 | 58,220 | 5,977 | 11.4 |
| Average nonfarm proprietors' income | 18,435 | 26,819 | 26,947 | 28,992 | 29,792 | 11,357 | 61.6 |
See related notes.
6.2. Cost of Living Indexes go top
Updated periodically. Available in subscription edition.
6.3. Cost of Doing Business Indexes go top
Updated periodically. Available in subscription edition.
6.4. Consumer Price Index go top
Updated monthly. Available in subscription edition.
6.5. Gross Domestic Product by Sector go top
Updated quarterly, annually. For more information, detail & to compare areas use interactive table. Additional detail in subscription edition.
| Item | 2009 | 2010 | 2011 | 2012 | 2013 | 2014 | Change 2009-14 | %Change 2009-14 |
| Gross Domestic Product, millions of current dollars | 192,594 | 200,768 | 210,569 | 218,376 | 227,962 | 235,733 | 43,139 | 22.40 |
| Real Gross Domestic Product, millions of real dollars | 192,594 | 198,541 | 204,253 | 207,005 | 212,664 | 216,891 | 24,297 | 12.62 |
6.6. Establishments, Employment & Earnings by Detailed Type of Business go top
Updated quarterly. For more information, detail & to compare areas use interactive table.
| Sector | Establishments 2015Q1 | Employment 2015Q1 | Avg Weekly Wages 2015Q1 | Establishments 2015Q2 | Employment 2015Q2 | Avg Weekly Wages 2015Q2 |
| Total, all industries | 92,752 | 2,977,773 | 1,196 | 89,631 | 3,061,683 | 1,064 |
| Total, all industries - Fed Govt | 406 | 33,415 | 1,564 | 403 | 33,811 | 1,297 |
| Total, all industries - St Govt | 596 | 86,252 | 1,121 | 595 | 86,861 | 1,303 |
| Total, all industries - Local Govt | 1,620 | 261,737 | 922 | 1,623 | 262,803 | 1,071 |
| Total, all industries - Private | 90,130 | 2,596,368 | 1,222 | 87,010 | 2,678,207 | 1,053 |
| Goods-producing | 14,292 | 430,091 | 1,356 | 13,618 | 456,243 | 1,223 |
| Natural resources and mining | 609 | 8,448 | 855 | 526 | 11,496 | 766 |
| Construction | 8,482 | 101,827 | 1,228 | 8,167 | 121,628 | 1,193 |
| Manufacturing | 5,201 | 319,816 | 1,411 | 4,925 | 323,120 | 1,251 |
| Service-providing | 75,838 | 2,166,277 | 1,195 | 73,392 | 2,221,964 | 1,018 |
| Trade, transportation & utilities | 18,346 | 541,297 | 991 | 17,891 | 549,773 | 887 |
| Information | 1,598 | 60,702 | 1,719 | 1,465 | 61,266 | 1,411 |
| Financial activities | 9,550 | 229,107 | 2,539 | 9,224 | 232,172 | 1,566 |
| Professional & business services | 17,616 | 464,242 | 1,657 | 16,573 | 474,582 | 1,482 |
| Education and health services | 10,245 | 494,541 | 863 | 10,160 | 504,492 | 873 |
| Leisure and hospitality | 8,214 | 278,298 | 399 | 8,196 | 297,822 | 400 |
| Other services | 10,267 | 98,060 | 616 | 9,883 | 101,857 | 623 |
| Unclassified | 2 | 32 | 38 | 0 | 0 | 0 |
Notes: cell value of '...' indicates value suppressed to maintain confidentiality.
Use the following links to access detailed establishment and employment data by type of business (CSV files).
.. see notes on using these files.
2013Q1 .. 2013Q2 .. 2013Q3 .. 2013Q4 .|. 2014Q1 .. 2014Q2 .. 2014Q3 .. 2014Q4 .|. 2015Q1 .. 2015Q2 .. 2015Q3 .. 2015Q4 .. 2016Q1 .. 2016Q2
6.7. Labor Market Characteristics & Trends go top
Updated monthly. Available in subscription edition.
For more information, detail & to compare areas use interactive table.
Table shows 13 most recent months.
| Item | Aug15 | Sep15 | Oct15 | Nov15 | Dec15 | Jan16 | Feb16 | Mar16 | Apr16 | May16 | Jun16 | Jul16 | Aug16 |
| Unemplymnt Rate | 3.3 | 3.3 | 3.0 | 3.0 | 3.4 | 4.2 | 4.1 | 4.2 | 3.5 | 3.2 | 3.9 | 3.7 | 3.8 |
| Unemployment | 6,392 | 6,233 | 5,787 | 5,649 | 6,420 | 8,011 | 7,940 | 8,189 | 6,874 | 6,195 | 7,560 | 7,151 | 7,228 |
| Employment | 186,226 | 184,866 | 184,691 | 185,502 | 184,781 | 184,016 | 186,274 | 185,981 | 186,928 | 187,674 | 186,423 | 187,397 | 185,464 |
| Labor Force | 192,618 | 191,099 | 190,478 | 191,151 | 191,201 | 192,027 | 194,214 | 194,170 | 193,802 | 193,869 | 193,983 | 194,548 | 192,692 |
7. Education Infrastructure go top
7.1. Component School District Characteristics go top
Districts in this metro. Updated periodically. See related School District interactive table.
| District Name | City Name | District Code | Locale Code | County | State | 2012-13 Enrollment | 2013 Total Population | Grade Relevant Pop Ages 5-17 |
| Annandale Public School District | Annandale | 2703150 | 32 | 27171 | MN | 1,687 | 10,671 | 1,855 |
| Anoka-Hennepin Public School Dist. | Anoka | 2703180 | 21 | 27003 | MN | 38,467 | 231,525 | 43,971 |
| Becker Public School District | Becker | 2703870 | 32 | 27141 | MN | 2,793 | 11,608 | 2,820 |
| Belle Plaine Public School District | Belle Plaine | 2704050 | 32 | 27139 | MN | 1,646 | 9,474 | 1,907 |
| Big Lake Public School District | Big Lake | 2705460 | 31 | 27141 | MN | 3,379 | 17,673 | 4,066 |
| Bloomington Public School District | Bloomington | 2705790 | 13 | 27053 | MN | 10,501 | 86,125 | 12,126 |
| Braham Public School District | Braham | 2706060 | 42 | 27059 | MN | 864 | 6,183 | 1,161 |
| Brooklyn Center School District | Brooklyn Center | 2706240 | 21 | 27053 | MN | 2,214 | 9,267 | 1,612 |
| Buffalo-Hanover-Montrose Public Sch | Buffalo | 2707200 | 31 | 27171 | MN | 5,907 | 32,802 | 6,964 |
| Burnsville Public School District | Burnsville | 2707290 | 21 | 27037 | MN | 9,752 | 68,515 | 11,825 |
| Cambridge-Isanti Public School Dist | Cambridge | 2707410 | 32 | 27059 | MN | 5,117 | 28,595 | 5,395 |
| Centennial Public School District | Circle Pines | 2708100 | 21 | 27003 | MN | 6,503 | 32,805 | 6,689 |
| Central Public School District | Norwood Young America | 2723910 | 32 | 27019 | MN | 1,030 | 8,315 | 1,570 |
| Chisago Lakes School District | Lindstrom | 2700017 | 32 | 27025 | MN | 3,388 | 21,087 | 3,814 |
| Cleveland Public School District | Cleveland | 2709330 | 42 | 27079 | MN | 441 | 2,442 | 440 |
| Columbia Heights Public School Dist | Columbia Heights | 2709510 | 21 | 27003 | MN | 3,124 | 25,856 | 3,737 |
| Dassel-Cokato Public School Dist. | Cokato | 2710060 | 41 | 27171 | MN | 2,285 | 10,204 | 2,312 |
| Delano Public School District | Delano | 2710170 | 31 | 27171 | MN | 2,357 | 11,214 | 2,505 |
| Eastern Carver County Public School | Chaska | 2708190 | 21 | 27019 | MN | 9,353 | 54,034 | 11,935 |
| Eden Prairie Public School District | Eden Prairie | 2714220 | 13 | 27053 | MN | 9,402 | 59,877 | 11,675 |
| Edina Public School District | Edina | 2711250 | 21 | 27053 | MN | 8,525 | 41,121 | 8,455 |
| Elk River Public School District | Elk River | 2711370 | 21 | 27141 | MN | 12,783 | 68,143 | 14,670 |
| Farmington Public School District | Farmington | 2711820 | 21 | 27037 | MN | 6,843 | 33,741 | 7,360 |
| Forest Lake Public School District | Forest Lake | 2712270 | 31 | 27163 | MN | 6,791 | 46,912 | 8,534 |
| Franconia Public School District | Scandia | 2708880 | 42 | 27163 | MN | ... | 258 | 46 |
| Fridley Public School District | Fridley | 2712420 | 21 | 27003 | MN | 2,947 | 15,912 | 2,526 |
| G.F.W. | Gibbon | 2712580 | 43 | 27143 | MN | 811 | 6,041 | 998 |
| Hastings Public School District | Hastings | 2713530 | 31 | 27037 | MN | 4,716 | 32,478 | 5,700 |
| Hopkins Public School District | Hopkins | 2714260 | 21 | 27053 | MN | 7,152 | 64,368 | 8,947 |
| Howard Lake-Waverly-Winsted | Howard Lake | 2700123 | 42 | 27171 | MN | 1,142 | 8,904 | 1,596 |
| Inver Grove Heights Schools | Inver Grove Heights | 2715030 | 21 | 27037 | MN | 3,859 | 29,817 | 4,763 |
| Isle Public School District | Isle | 2715510 | 43 | 27095 | MN | 504 | 3,222 | 463 |
| Jordan Public School District | Jordan | 2715750 | 31 | 27139 | MN | 1,775 | 9,496 | 2,155 |
| Lakeville Public School District | Lakeville | 2717780 | 21 | 27037 | MN | 11,006 | 53,109 | 12,500 |
| Le Sueur-Henderson School District | Lesueur | 2718070 | 32 | 27079 | MN | 1,100 | 7,553 | 1,358 |
| Mahtomedi Public School District | Mahtomedi | 2718750 | 21 | 27163 | MN | 3,317 | 14,262 | 2,979 |
| Maple Lake Public School District | Maple Lake | 2718810 | 42 | 27171 | MN | 946 | 5,091 | 1,041 |
| Milaca Public School District | Milaca | 2720670 | 32 | 27095 | MN | 1,903 | 11,570 | 2,191 |
| Minneapolis Public School Dist. | Minneapolis | 2721240 | 11 | 27053 | MN | 35,842 | 397,992 | 51,928 |
| Minnetonka Public School District | Minnetonka | 2711670 | 21 | 27053 | MN | 9,596 | 41,849 | 8,833 |
| Monticello Public School District | Monticello | 2721390 | 31 | 27171 | MN | 4,071 | 21,131 | 4,435 |
| Mounds View Public School District | Shoreview | 2722950 | 21 | 27123 | MN | 10,431 | 76,678 | 11,769 |
| New Prague Area Schools | New Prague | 2723430 | 32 | 27139 | MN | 3,960 | 19,226 | 4,321 |
| North Branch Public Schools | North Branch | 2723820 | 32 | 27025 | MN | 3,216 | 19,942 | 3,923 |
| North St Paul-Maplewood School Dist | Maplewood | 2723850 | 21 | 27123 | MN | 10,855 | 79,482 | 13,242 |
| Onamia Public School District | Onamia | 2725050 | 43 | 27095 | MN | 637 | 5,618 | 1,000 |
| Orono Public School District | Long Lake | 2725080 | 41 | 27053 | MN | 2,794 | 12,341 | 2,713 |
| Osseo Public School District | Maple Grove | 2725200 | 21 | 27053 | MN | 20,843 | 140,557 | 26,548 |
| Princeton Public School District | Princeton | 2730030 | 32 | 27095 | MN | 3,288 | 20,454 | 3,911 |
| Prior Lake-Savage Area Schools | Prior Lake | 2730060 | 21 | 27139 | MN | 7,412 | 39,869 | 8,674 |
| Randolph Public School District | Randolph | 2730150 | 42 | 27037 | MN | 582 | 2,459 | 449 |
| Richfield Public School District | Richfield | 2731750 | 21 | 27053 | MN | 4,488 | 41,502 | 5,192 |
| Robbinsdale Public School District | New Hope | 2731780 | 21 | 27053 | MN | 12,409 | 103,064 | 15,597 |
| Rockford Public School District | Rockford | 2732070 | 41 | 27171 | MN | 1,614 | 9,850 | 2,001 |
| Rosemount-Apple Valley-Eagan | Rosemount | 2732390 | 21 | 27037 | MN | 27,243 | 147,378 | 29,106 |
| Roseville Public School District | Roseville | 2732430 | 21 | 27123 | MN | 7,182 | 56,669 | 8,023 |
| Rush City Public School District | Rush City | 2732550 | 32 | 27025 | MN | 902 | 6,561 | 908 |
| Shakopee Public School District | Shakopee | 2733000 | 21 | 27139 | MN | 7,666 | 44,932 | 9,142 |
| Sibley East School District | Arlington | 2700102 | 43 | 27143 | MN | 1,239 | 7,589 | 1,437 |
| South St. Paul Public School Dist. | South St. Paul | 2733270 | 21 | 27037 | MN | 3,414 | 20,179 | 3,213 |
| South Washington County School Dist | Cottage Grove | 2733810 | 21 | 27163 | MN | 18,048 | 96,044 | 19,933 |
| Spring Lake Park Public Schools | Spring Lake Park | 2733330 | 21 | 27003 | MN | 5,502 | 31,171 | 5,236 |
| St. Anthony-New Brighton Schools | St. Anthony | 2733420 | 21 | 27053 | MN | 1,798 | 10,218 | 1,243 |
| St. Francis Public School District | St. Francis | 2733540 | 31 | 27003 | MN | 5,023 | 32,386 | 6,440 |
| St. Louis Park Public School Dist. | St. Louis Park | 2733780 | 21 | 27053 | MN | 4,677 | 45,405 | 5,461 |
| St. Michael-Albertville School Dist | Albertville | 2733790 | 21 | 27171 | MN | 5,687 | 23,382 | 5,856 |
| St. Paul Public School District | St. Paul | 2733840 | 11 | 27123 | MN | 38,419 | 295,197 | 50,756 |
| Stillwater Area Public School Dist. | Stillwater | 2738190 | 21 | 27163 | MN | 8,640 | 61,829 | 11,425 |
| Tri-City United School District | Montgomery | 2700379 | 32 | 27079 | MN | 1,864 | 12,326 | 2,328 |
| Waconia Public School District | Waconia | 2741460 | 31 | 27019 | MN | 3,621 | 20,130 | 4,309 |
| Watertown-Mayer Public School Dist. | Watertown | 2741910 | 41 | 27019 | MN | 1,619 | 9,953 | 1,963 |
| Waterville-Elysian-Morristown | Waterville | 2700013 | 42 | 27079 | MN | 869 | 6,776 | 1,075 |
| Wayzata Public School District | Wayzata | 2742160 | 13 | 27053 | MN | 10,785 | 61,298 | 12,158 |
| West St. Paul-Mendota Hts.-Eagan | Mendota Heights | 2742270 | 21 | 27037 | MN | 4,820 | 42,977 | 6,466 |
| Westonka Public School District | Minnetrista | 2722920 | 41 | 27053 | MN | 2,288 | 18,580 | 3,116 |
| White Bear Lake School District | White Bear Lake | 2742360 | 21 | 27123 | MN | 8,231 | 63,315 | 10,401 |
| Baldwin-Woodville Area School District | Baldwin | 5500720 | 41 | 55109 | WI | 1,631 | 8,860 | 1,693 |
| Ellsworth Community School District | Ellsworth | 5504320 | 32 | 55093 | WI | 1,691 | 11,168 | 1,930 |
| Elmwood School District | Elmwood | 5504350 | 43 | 55093 | WI | 333 | 2,043 | 337 |
| Glenwood City School District | Glenwood City | 5505520 | 43 | 55109 | WI | 728 | 4,126 | 758 |
| Hudson School District | Hudson | 5506690 | 31 | 55109 | WI | 5,609 | 30,696 | 6,367 |
| New Richmond School District | New Richmond | 5510620 | 32 | 55109 | WI | 3,222 | 17,044 | 3,327 |
| Plum City School District | Plum City | 5511880 | 43 | 55093 | WI | 281 | 1,818 | 315 |
| Prescott School District | Prescott | 5512240 | 31 | 55093 | WI | 1,329 | 7,816 | 1,505 |
| River Falls School District | River Falls | 5513050 | 32 | 55093 | WI | 3,109 | 23,066 | 3,336 |
| Saint Croix Central School District | Hammond | 5506060 | 32 | 55109 | WI | 1,543 | 7,692 | 1,576 |
| Somerset School District | Somerset | 5514010 | 31 | 55109 | WI | 1,584 | 8,140 | 1,776 |
| Spring Valley School District | Spring Valley | 5514340 | 42 | 55093 | WI | 732 | 4,088 | 747 |
Number of districts: 88 ... Total enrollment: 519,697
All school districts interactive tables General Demographics | Social | Economic | Housing
All school districts enrollment & adminstratively reported data interactive table.
7.2. Component Higher Education Institution Characteristics go top
2014-15 School Year. Extended detail Available in subscription edition.
| Institution | City Name | Code | Level | Total UG Enrollment | Fulltime UG Enrollment | Total Grad Enrollment | Fulltime Grad Enrollment |
| Academy College | Minneapolis, MN | 172866 | 5 | 127 | 79 | 0 | 0 |
| Anoka Technical College | Anoka, MN | 172954 | 4 | 2,221 | 991 | 0 | 0 |
| Anoka-Ramsey Community College | Coon Rapids, MN | 172963 | 4 | 7,877 | 3,068 | 0 | 0 |
| Argosy University-Twin Cities | Eagan, MN | 173984 | 9 | 1,072 | 294 | 421 | 91 |
| Augsburg College | Minneapolis, MN | 173045 | 9 | 2,619 | 2,002 | 929 | 566 |
| Bethel University | Saint Paul, MN | 173160 | 9 | 3,045 | 2,577 | 934 | 384 |
| Brown College-Brooklyn Center | Brooklyn Center, MN | 475291 | 5 | 169 | 41 | 0 | 0 |
| Brown College-Mendota Heights | Mendota Heights, MN | 174394 | 5 | 150 | 76 | 0 | 0 |
| Capella University | Minneapolis, MN | 413413 | 9 | 8,750 | 1,624 | 26,311 | 965 |
| Century College | White Bear Lake, MN | 175315 | 4 | 9,478 | 3,618 | 0 | 0 |
| Concordia University-Saint Paul | Saint Paul, MN | 173328 | 9 | 2,431 | 1,369 | 1,650 | 1,451 |
| Crown College | Saint Bonifacius, MN | 174862 | 7 | 1,113 | 826 | 165 | 126 |
| Dakota County Technical College | Rosemount, MN | 173416 | 4 | 2,910 | 1,361 | 0 | 0 |
| DeVry University-Minnesota | Edina, MN | 482529 | 7 | 232 | 78 | 138 | 22 |
| Dunwoody College of Technology | Minneapolis, MN | 175227 | 5 | 1,070 | 873 | 0 | 0 |
| Globe University-Minneapolis | Minneapolis, MN | 456834 | 9 | 52 | 37 | 112 | 64 |
| Globe University-Woodbury | Woodbury, MN | 173629 | 7 | 717 | 493 | 59 | 30 |
| Hamline University | Saint Paul, MN | 173665 | 9 | 2,242 | 2,162 | 2,227 | 430 |
| Hazelden Graduate School of Addiction Studies | Center City, MN | 173683 | 7 | 1 | 1 | 102 | 87 |
| Hennepin Technical College | Brooklyn Park, MN | 173708 | 4 | 5,985 | 2,063 | 0 | 0 |
| Herzing University-Minneapolis | Minneapolis, MN | 174154 | 5 | 263 | 113 | 0 | 0 |
| ITT Technical Institute-Brooklyn Center | Brooklyn Center, MN | 470870 | 5 | 176 | 147 | 0 | 0 |
| ITT Technical Institute-Eden Prairie | Eden Prairie, MN | 445081 | 5 | 216 | 148 | 0 | 0 |
| Institute of Production and Recording | Minneapolis, MN | 454616 | 3 | 243 | 151 | 0 | 0 |
| Inver Hills Community College | Inver Grove Heights, MN | 173799 | 3 | 5,958 | 1,996 | 0 | 0 |
| Le Cordon Bleu College of Culinary Arts-Minneapolis | Mendota Heights, MN | 446844 | 3 | 491 | 491 | 0 | 0 |
| Macalester College | Saint Paul, MN | 173902 | 5 | 2,073 | 2,045 | 0 | 0 |
| McNally Smith College of Music | Saint Paul, MN | 367194 | 7 | 497 | 385 | 21 | 19 |
| Metropolitan State University | Saint Paul, MN | 174020 | 9 | 7,595 | 2,715 | 760 | 175 |
| Miami Ad School-Minneapolis | Minneapolis, MN | 440800 | 4 | 23 | 23 | 0 | 0 |
| Minneapolis Business College | Roseville, MN | 174118 | 3 | 231 | 231 | 0 | 0 |
| Minneapolis College of Art and Design | Minneapolis, MN | 174127 | 7 | 672 | 642 | 111 | 42 |
| Minneapolis Community and Technical College | Minneapolis, MN | 174136 | 4 | 9,237 | 3,187 | 0 | 0 |
| Minneapolis Media Institute | Edina, MN | 474881 | 5 | 157 | 84 | 0 | 0 |
| Minnesota School of Business-Blaine | Blaine, MN | 451769 | 5 | 239 | 142 | 0 | 0 |
| Minnesota School of Business-Brooklyn Center | Brooklyn Center, MN | 407285 | 5 | 109 | 58 | 0 | 0 |
| Minnesota School of Business-Elk River | Elk River, MN | 456782 | 5 | 236 | 149 | 0 | 0 |
| Minnesota School of Business-Lakeville | Lakeville, MN | 458742 | 5 | 195 | 146 | 0 | 0 |
| Minnesota School of Business-Plymouth | Plymouth, MN | 442578 | 5 | 130 | 85 | 0 | 0 |
| Minnesota School of Business-Richfield | Richfield, MN | 174279 | 7 | 693 | 440 | 70 | 36 |
| National American University-Bloomington | Bloomington, MN | 436483 | 5 | 422 | 86 | 0 | 0 |
| National American University-Brooklyn Center | Brooklyn Center, MN | 440767 | 5 | 512 | 29 | 0 | 0 |
| National American University-Burnsville | Burnsville, MN | 478005 | 5 | 183 | 12 | 0 | 0 |
| National American University-Roseville | Roseville, MN | 174385 | 5 | 264 | 20 | 0 | 0 |
| Normandale Community College | Bloomington, MN | 174428 | 3 | 9,539 | 3,995 | 0 | 0 |
| North Central University | Minneapolis, MN | 174437 | 6 | 1,083 | 889 | 108 | 0 |
| North Hennepin Community College | Brooklyn Park, MN | 174376 | 3 | 7,384 | 2,034 | 0 | 0 |
| Northwestern Health Sciences University | Bloomington, MN | 174507 | 9 | 120 | 54 | 759 | 710 |
| Saint Paul College | Saint Paul, MN | 175041 | 4 | 6,600 | 2,565 | 0 | 0 |
| St Catherine University | Saint Paul, MN | 175005 | 9 | 3,491 | 2,093 | 1,564 | 1,155 |
| The Art Institutes International-Minnesota | Minneapolis, MN | 173887 | 5 | 932 | 667 | 0 | 0 |
| University of Minnesota-Twin Cities | Minneapolis, MN | 174066 | 9 | 34,351 | 28,904 | 16,796 | 9,719 |
| University of Northwestern-St Paul | Saint Paul, MN | 174491 | 7 | 3,222 | 1,931 | 205 | 7 |
| University of Phoenix-Minneapolis St Paul Campus | Saint Louis Park, MN | 445319 | 7 | 132 | 132 | 14 | 14 |
| University of St Thomas | Saint Paul, MN | 174914 | 9 | 6,148 | 5,883 | 3,992 | 1,231 |
| University of Wisconsin-River Falls | River Falls, WI | 240471 | 8 | 5,740 | 5,209 | 458 | 143 |
| Walden University | Minneapolis, MN | 125231 | 9 | 8,960 | 817 | 43,228 | 26,650 |
Number of institutions: 57 ... Total undergraduate enrollment: 170,778
Levels: 3-Assoc degree, 4-at least 2, but < 4 years, 5-Bach degree, 6-Postbacc cert, 7 Masters degree, 8 Post-masters cert, 9 Doctors degree
8. GeoPolitics go top
Updated periodically. Voting patterns, citizen voting age population, state legislative districts, congressional districts .. in this metro.
Available in subscription edition.
Notes
• All data are for current vintage county and metro definition.
• Developed by ProximityOne -- Metro Reports (888-364-7656)
• Data sources: ProximityOne, Census Bureau, Bureau of Economic Analysis, Bureau of Labor Statistics, Federal Housing Finance Agency,
National Center for Education Statistics.
Updates go top
The subscription edition updates frequently. Selected items are listed below. Register to receive update notifications.
• Overview lead narrative; quarterly & annual/March.
• Housing Price Index (section 5.4) quarterly.
• Establishments, employment & earnings (section 6.6) quarterly.
• Economic profile and personal income (section 6.1) annual/November.
• Labor market situation (section 6.7) monthly.
• Residential construction; units authorized & value (section 5.3.) monthly.
• Population by county; annual series 2010-2016 (section 4.2.) annual/July.
• Population by county; links for individual counties (section 4.2.) annual/July.
-- includes annual data 2010-2016.
-- includes components of change; race/origin; single year of age; age group summaries.
• Total population and components of change; annual/March.
• Census tracts overview section; annual/December.
• General Demographics section updated/extended; annual/December.
• Gross Domestic Product section; annual/September.
• Higher education institutions; annual/February.
• Metro & county demographic component detailed annual estimates; annual/March.
• School districts in metro & K-12 enrollment; annual/August.
More about schedule and upcoming events ... Calendar ... Upcoming Events ... Find Event
Terms of Use go top
Situation & Outlook Reports are a proprietary resource developed by ProximityOne. There is no warranty of any type associated with any aspect of this report. The user of this document is solely responsible to any use, direct or indirect, that might be made of this document.
Related Resources go top
• Metros main page
• Current estimates and projections: states to 2030, counties & metros to 2020 by age, counties & states to 2060.
• Making Custom Metropolitan Area Maps
• Rental Market Conditions by Metropolitan Area
• Metro Gross Domestic Product
• Housing Price Index
• Establishments, Employment & Earnings
• Regional Economic Information System
• ACS 2014 1-year General Demographics ... Social Characteristics ... Economic Characteristics ... Housing Characteristics
Using this Document go top
The Situation & Outlook Report, a component of the Situation & Outlook, is a core ProximityOne information resource providing insights into characteristics and trends of counties, metropolitan areas, states and the U.S. The Report also provides a gateway to drill-down demographic, economic and business data for smaller geographic areas.
Metropolitan areas include approximately 94 percent of the U.S. population -- 85 percent in metropolitan statistical areas (MSAs) and 9 percent in micropolitan statistical areas (MISAs).
About Metropolitan Areas & Principal Cities -- scroll section go top
Metropolitan Areas are designated by OMB ("Standards for Delineating Metropolitan and Micropolitan Statistical Areas") based
mainly on Census Bureau-sourced data.
Metropolitan areas are defined as Metropolitan Statistical Areas (MSA) and Micropolitan Statistical Areas (MISA).
MSAs and MISAs are also referred to a Core-Based Statistical Areas (CBSAs).
Contiguous CBSAs are defined as Combined Statistical Areas (CSA).
By definition, metropolitan areas are comprised of one or more contiguous counties. Metropolitan areas are not single cities and typically include many cities. Metropolitan areas are comprised of urban and rural areas and often have large expanses of rural territory. A business and demographic-economic synergy exists within each metro; metros often interact with adjacent metros. The demographic-economic make-up of metros vary widely and change often. See more about metros.
Principal Cities. The largest city in each metropolitan or micropolitan statistical area is designated a "principal city." Principal cities are designated by OMB based on Census-sourced data. Additional cities qualify as principal cities if specified requirements are met concerning population size and employment. The title of each metropolitan or micropolitan statistical area consists of the names of up to three of its principal cities and the name of each state into which the metropolitan or micropolitan statistical area extends. Titles of metropolitan divisions also typically are based on principal city names but in certain cases consist of county names.
One or more principal cities are designated within each Metropolitan Statistical Area (MSA) and Micropolitan Statistical Area (MISA). The term "principal city" is defined in the OMB "Standards for Delineating Metropolitan and Micropolitan Statistical Areas." A principal city is an OMB designation applied to one or more incorporated places and/or census designated places (CDPs). The OMB standards designate a Principal City (or Cities) of a Core-Based Statistical Area (CBSA) as determined by:
a) The largest incorporated place with a 2010 Census population of at least 10,000 in the CBSA or,
if no incorporated place of at least 10,000 population is present in the CBSA,
the largest incorporated place or census designated place in the CBSA; and
b) Additional places with 2010 Census population of at least 250,000 or in which 100,000 or more persons work; and
c) Additional places with 2010 Census population of 50,000-250,000,
and number of workers working in the place meets or exceeds the number of workers living in the place; and
d) Additional places with 2010 Census population of 10,000-50,000, and at least one-third the population size of the largest place,
and in which the number of workers working in the place meets or exceeds the number of workers living in the place.
ProximityOne User Group go top
Join the ProximityOne User Group to keep up-to-date with new developments relating to metros and component geography decision-making information resources. Receive updates and access to tools and resources available only to members. Use this form to join the User Group.
Support Using these Resources go top
Learn more about accessing and using demographic-economic data and related analytical tools. Join us in a Data Analytics Lab session. There is no fee for these one-hour Web sessions. Each informal session is focused on a specific topic. The open structure also provides for Q&A and discussion of application issues of interest to participants.
Additional Information go top
ProximityOne develops geographic-demographic-economic data and analytical tools and helps organizations knit together and use diverse data in a decision-making and analytical framework. We develop custom demographic/economic estimates and projections, develop geographic and geocoded address files, and assist with impact and geospatial analyses. Wide-ranging organizations use our tools (software, data, methodologies) to analyze their own data integrated with other data. Follow ProximityOne on Twitter at www.twitter.com/proximityone. Contact us (888-364-7656) with questions about data covered in this section or to discuss custom estimates, projections or analyses for your areas of interest.
Copyright © 2018 ProximityOne