
| Decision-Making Information |
|
ProximityOne information resources & solutions (888) DMI-SOLN (888) 364-7656 Put data to work more effectively. Certificate in Data Analytics Power of Combining Maps with Data Support & Technical Assistance help using these resources Metro in Regional Context 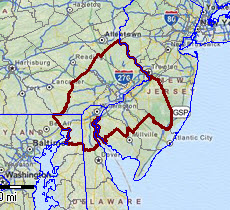 |
Situation & Outlook Report
Philadelphia-Camden-Wilmington, PA-NJ-DE-MD Metropolitan Statistical Area (CBSA 37980)
Geographic-Demographic-Economic Characteristics -- access other areas
See about updates.
This section is no longer being updated. Access the permanent replacement section at http://proximityone.com/cbsa/1/cbsa37980.htm. Please bookmark this new URL.
Access 2018 S&O Reports, featuring county and metro projections to 2030, via the interactive table at http://proximityone.com/metros.htm. The 2018 reports are similar but have been greatly expanded and updated.
Contents of this Report
This document is organized into these sections:
1. Recent Trends & Outlook
Summary of recent business, demographic, economic trends; year-ahead & 5-year outlook.
- the Recent Trends & Outlook section, updated quarterly, covers topics about this metro such as .. assessing the implications of next jobs report .. impact of Fed''s interest rate action .. which sectors are expanding or contracting .. housing market conditions .. insights to help your planning and decision-making. The Recent Trends & Outlook section is available in the subscription edition.
2. Overview & Update
The total population of the Philadelphia-Camden-Wilmington, PA-NJ-DE-MD MSA metro changed from 5,971,463 in 2010 to 6,053,720 in 2015, a change of 98,412 (1.6%). Among all 917 metros, this metro was ranked number 5 in 2010 and 7 in 2015, based on total population. Annual net migration was 5,402 (2011), 3,473 (2012), -2,177 (2013), 1,894 (2014), 1,894 (2015). View annual population estimates and components of change table. See more about population characteristics below.
This metro is projected to have a total population in 2020 of 6,381,046. The projected population change from 2010 to 2020 is 409,770 (6.9%). The population ages 65 years and over is projected to change from 815,641 (2010) to 1,184,060 (2020), a change of 368,419 (45.2%). See more about population projections.
Based on per capita personal income (PCPI), this metro was ranked number 36 in 2008 and 36 in 2014. among the 917 metros for which personal income was estimated.The PCPI changed from $48,557 in 2008 to $54,936 in 2014, a change of $6,379 (13.1%). Per capita personal income (PCPI) is a comprehensive measure of individual economic well-being. Use the interactive table to compare PCPI in this metro to other metros. See more about PCPI in Economic Characteristics section below.
282 metropolitan statistical areas, of the total 381, experienced an increase in real Gross Domestic Product (GDP) between 2009 and 2014. This metro ranked number 8 among the 381 metros based on 2014 GDP. The GDP (millions of current dollars) changed from $340,442 in 2009 to $391,118 in 2014 a change of $50,676 (14.89%). Real GDP (millions of real, inflation adjusted, dollars) changed from $340,442 in 2009 to $358,469 in 2014, a change of $18,027 (5.3%). GDP is the most comprehensive measure of metro economic activity. GDP is the sum of the GDP originating in all industries in the metro. See more about GDP in Economic Characteristics section below.
Attributes of driil-down, small area geography within the metro ... metros account for 65,744 of the national scope 73,056 census tracts (others are in non-metro areas). This metro is comprised of 1,477 tracts covering the metro wall-to-wall. View, rank, compare demographic-economic attributes of these tracts using the interactive tables. Use the CBSA code 37980; see table usage details below the table.
Fortune 1000 Companies with headquarters in this metro.
• AMETEK, Inc.
• Airgas, Inc.
• American Water Works Company, Inc.
• AmerisourceBergen
• Aramark Holdings Corporation
• Burlington Stores, Inc.
• Campbell Soup Company
• Chemtura Corporation
• Comcast
• Crown Holdings, Inc.
• E.I. du Pont de Nemours and Company
• Endo International plc
• FMC Corporation
• Lincoln National Corporation
• PHH Corporation
• SLM Corporation
• SunGard Data Systems Inc.
• The Pep Boys - Manny, Moe & Jack
• Toll Brothers, Inc.
• Triumph Group, Inc.
• UGI Corporation
• Unisys Corporation
• Universal Health Services, Inc.
• Urban Outfitters, Inc.
• VWR Funding, Inc.
• Vishay Intertechnology, Inc.
Number in this metro: 26. Extended data & analysis in subscription edition.• Airgas, Inc.
• American Water Works Company, Inc.
• AmerisourceBergen
• Aramark Holdings Corporation
• Burlington Stores, Inc.
• Campbell Soup Company
• Chemtura Corporation
• Comcast
• Crown Holdings, Inc.
• E.I. du Pont de Nemours and Company
• Endo International plc
• FMC Corporation
• Lincoln National Corporation
• PHH Corporation
• SLM Corporation
• SunGard Data Systems Inc.
• The Pep Boys - Manny, Moe & Jack
• Toll Brothers, Inc.
• Triumph Group, Inc.
• UGI Corporation
• Unisys Corporation
• Universal Health Services, Inc.
• Urban Outfitters, Inc.
• VWR Funding, Inc.
• Vishay Intertechnology, Inc.
3. Lay of the Land & Neighborhood Patterns of Economic Prosperity go top
3.1. Lay of the Land go top
Lay of the Land. The following map shows the metro with bold boundary.
Counties are labeled with county name and state-county FIPS code.
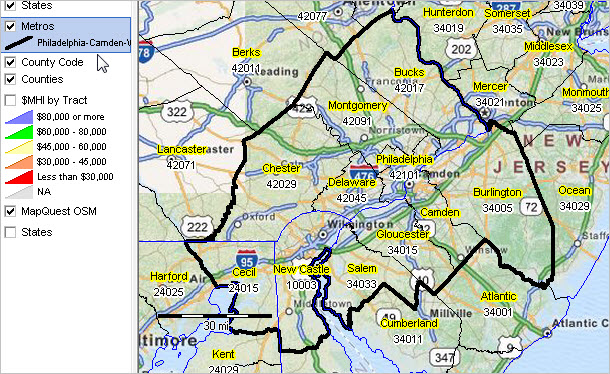
View developed with CV XE GIS software. See this section to learn about making custom metro maps.
3.2. Patterns of Economic Prosperity by Neighborhood go top
Median household income by census tract (see color/data legend at left of map).
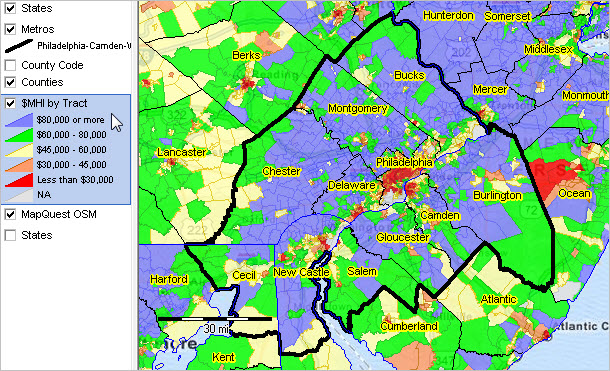
View developed with CV XE GIS software. See this section to learn about making custom metro maps.
4. Population Characteristics & Trends go top
Updated monthly, quarterly, annually. Housing market conditions and extended detail Available in subscription edition.
4.1. Component City Characteristics go top
Principal Cities (about principal cities); Click link to view city profile.
• Camden
• Philadelphia
• Wilmington
Cities 10,000 population and over; click link to view city profile.
| Area | Census 2010 | July 1 2010 | July 1 2011 | July 1 2012 | July 1 2013 | July 1 2014 | Change 2010-14 | %Change 2010-14 |
| Bellmawr, NJ (3404750) | 11,583 | 11,579 | 11,574 | 11,553 | 11,521 | 11,454 | -125 | -1.10 |
| Camden, NJ (3410000) | 77,344 | 77,423 | 77,567 | 77,271 | 76,783 | 77,332 | -91 | -0.10 |
| Chester, PA (4213208) | 33,972 | 34,008 | 33,815 | 34,021 | 34,110 | 34,133 | 125 | 0.40 |
| Coatesville, PA (4214712) | 13,100 | 13,103 | 13,130 | 13,132 | 13,148 | 13,164 | 61 | 0.50 |
| Collingswood, NJ (3414260) | 13,926 | 13,925 | 13,906 | 13,890 | 13,905 | 13,962 | 37 | 0.30 |
| Darby, PA (4218152) | 10,687 | 10,688 | 10,668 | 10,685 | 10,692 | 10,695 | 7 | 0.10 |
| Elkton, MD (2425800) | 15,443 | 15,506 | 15,645 | 15,668 | 15,702 | 15,852 | 346 | 2.20 |
| Glassboro, NJ (3426340) | 18,579 | 18,559 | 18,737 | 18,837 | 18,933 | 19,007 | 448 | 2.40 |
| Gloucester City, NJ (3426820) | 11,456 | 11,451 | 11,438 | 11,424 | 11,383 | 11,317 | -134 | -1.20 |
| Haddonfield, NJ (3428770) | 11,593 | 11,584 | 11,568 | 11,541 | 11,490 | 11,411 | -173 | -1.50 |
| Lansdale, PA (4241432) | 16,269 | 16,282 | 16,313 | 16,386 | 16,432 | 16,487 | 205 | 1.30 |
| Lansdowne, PA (4241440) | 10,620 | 10,619 | 10,599 | 10,621 | 10,632 | 10,641 | 22 | 0.20 |
| Lindenwold, NJ (3440440) | 17,613 | 17,603 | 17,572 | 17,543 | 17,472 | 17,417 | -186 | -1.10 |
| Middletown, DE (1047030) | 18,871 | 18,966 | 19,291 | 19,465 | 19,625 | 19,910 | 944 | 5.00 |
| Newark, DE (1050670) | 31,454 | 31,519 | 31,934 | 32,415 | 32,510 | 33,008 | 1,489 | 4.70 |
| Norristown, PA (4254656) | 34,324 | 34,347 | 34,406 | 34,461 | 34,494 | 34,484 | 137 | 0.40 |
| Philadelphia, PA (4260000) | 1,526,006 | 1,528,544 | 1,539,313 | 1,550,396 | 1,556,052 | 1,560,297 | 31,753 | 2.10 |
| Phoenixville, PA (4260120) | 16,440 | 16,472 | 16,494 | 16,509 | 16,525 | 16,599 | 127 | 0.80 |
| Pine Hill, NJ (3458770) | 10,233 | 10,225 | 10,206 | 10,518 | 10,476 | 10,464 | 239 | 2.30 |
| Pottstown, PA (4262416) | 22,377 | 22,392 | 22,474 | 22,505 | 22,603 | 22,684 | 292 | 1.30 |
| West Chester, PA (4282704) | 18,461 | 18,468 | 18,781 | 18,918 | 18,986 | 19,189 | 721 | 3.90 |
| Wilmington, DE (1077580) | 70,851 | 70,782 | 70,978 | 71,307 | 71,489 | 71,817 | 1,035 | 1.50 |
| Woodbury, NJ (3482120) | 10,174 | 10,167 | 10,145 | 10,100 | 10,066 | 10,016 | -151 | -1.50 |
| Yeadon, PA (4286968) | 11,443 | 11,454 | 11,475 | 11,501 | 11,514 | 11,525 | 71 | 0.60 |
All places time series population estimates interactive table.
4.2. Component County Characteristics go top
Updated periodically, annually. General demographics, social characteristics and extended detail Available in subscription edition.
Metropolitan areas are defined as one or more contiguous counties based on a set of demographic-economic criteria. Counties comprising the metro are shown below. For multi-county metros, this section provides insights into how the population is changing by county. Many metros changed geographic composition (counties included in the metro) between the Census 2010 vintage and the current vintage. These changes, if any, are also shown below (county is marked with **). See projections in related section.Click county code link to view county components of change.
All counties interactive tables General Demographics | Social | Economic | HousingMetropolitan areas are defined as one or more contiguous counties based on a set of demographic-economic criteria. Counties comprising the metro are shown below. For multi-county metros, this section provides insights into how the population is changing by county. Many metros changed geographic composition (counties included in the metro) between the Census 2010 vintage and the current vintage. These changes, if any, are also shown below (county is marked with **). See projections in related section.Click county code link to view county components of change.
| Area | July 1 2010 | Pct | July 1 2011 | Pct | July 1 2012 | Pct | July 1 2013 | Pct | July 1 2014 | Pct | July 1 2015 | Pct |
| Metro Summary ... more details | 5,971,463 | 100.0 | 5,997,102 | 100.0 | 6,021,349 | 100.0 | 6,036,356 | 100.0 | 6,053,720 | 100.0 | 6,069,875 | 100.0 |
| New Castle County, DE (10003) | 538,911 | 9.0 | 542,349 | 9.0 | 546,211 | 9.1 | 549,529 | 9.1 | 553,347 | 9.1 | 556,779 | 9.2 |
| Cecil County, MD (24015) | 101,164 | 1.7 | 101,644 | 1.7 | 101,767 | 1.7 | 101,871 | 1.7 | 102,135 | 1.7 | 102,382 | 1.7 |
| Burlington County, NJ (34005) | 449,218 | 7.5 | 450,549 | 7.5 | 451,227 | 7.5 | 450,103 | 7.5 | 450,677 | 7.4 | 450,226 | 7.4 |
| Camden County, NJ (34007) | 513,594 | 8.6 | 513,185 | 8.6 | 512,993 | 8.5 | 511,922 | 8.5 | 510,967 | 8.4 | 510,923 | 8.4 |
| Gloucester County, NJ (34015) | 288,701 | 4.8 | 289,470 | 4.8 | 289,719 | 4.8 | 289,923 | 4.8 | 290,898 | 4.8 | 291,479 | 4.8 |
| Salem County, NJ (34033) | 65,998 | 1.1 | 66,031 | 1.1 | 65,656 | 1.1 | 65,062 | 1.1 | 64,670 | 1.1 | 64,180 | 1.1 |
| Bucks County, PA (42017) | 625,473 | 10.5 | 626,435 | 10.4 | 626,194 | 10.4 | 626,313 | 10.4 | 626,608 | 10.4 | 627,367 | 10.3 |
| Chester County, PA (42029) | 499,950 | 8.4 | 503,702 | 8.4 | 506,428 | 8.4 | 509,624 | 8.4 | 513,291 | 8.5 | 515,939 | 8.5 |
| Delaware County, PA (42045) | 559,053 | 9.4 | 559,075 | 9.3 | 560,869 | 9.3 | 561,619 | 9.3 | 562,957 | 9.3 | 563,894 | 9.3 |
| Montgomery County, PA (42091) | 801,063 | 13.4 | 805,575 | 13.4 | 809,701 | 13.4 | 813,704 | 13.5 | 816,608 | 13.5 | 819,264 | 13.5 |
| Philadelphia County, PA (42101) | 1,528,338 | 25.6 | 1,539,087 | 25.7 | 1,550,584 | 25.8 | 1,556,686 | 25.8 | 1,561,562 | 25.8 | 1,567,442 | 25.8 |
All counties population estimates & components of change time series interactive table.
4.2.1. RDEMS County Characteristics
Updated quarterly. For more information, see RDEMS Main.
Links open HSG1 Housing & New Residential Construction section. Select other sections from list above table.
New Castle County, DE
Cecil County, MD
Burlington County, NJ
Camden County, NJ
Gloucester County, NJ
Salem County, NJ
Bucks County, PA
Chester County, PA
Delaware County, PA
Montgomery County, PA
Philadelphia County, PA
Cecil County, MD
Burlington County, NJ
Camden County, NJ
Gloucester County, NJ
Salem County, NJ
Bucks County, PA
Chester County, PA
Delaware County, PA
Montgomery County, PA
Philadelphia County, PA
4.3. General Demographic Characteristics
Updated annually. For more information, detail & to compare areas use interactive table.
| Item | 2013 | 2014 | Change 2013-14 | %Change 2013-14 |
| Total Population: Race/Origin | 6,034,678 | 6,051,170 | 16,492 | 0.27 |
| One race | 5,890,484 | 5,904,756 | 14,272 | 0.24 |
| White | 4,098,678 | 4,095,418 | -3,260 | -0.08 |
| Black/African American | 4,098,678 | 4,095,418 | -3,260 | -0.08 |
| American Indian/Alaska Native | 9,086 | 13,465 | 4,379 | 48.20 |
| Asian alone | 325,884 | 336,834 | 10,950 | 3.36 |
| Native Hawaiian/Pacific Islander | 1,135 | 1,881 | 746 | 65.73 |
| Some other race alone | 186,049 | 190,812 | 4,763 | 2.56 |
| Two or more races | 144,194 | 146,414 | 2,220 | 1.54 |
| Hispanic or Latino (of any race) | 515,338 | 530,095 | 14,757 | 2.86 |
| Population 25 years and over | 4,089,458 | 4,120,984 | 31,526 | 2.86 |
| % high school graduate or higher | 89.5 | 89.5 | 0.0 | 0.00 |
| % bachelor's degree or higher | 34.6 | 35.3 | 0.7 | 2.02 |
| Total Households | 2,218,312 | 2,230,807 | 12,495 | 2.02 |
| Median household income ($) | 60,482 | 62,171 | 1,689 | 2.79 |
| Mean household income ($) | 84,501 | 86,635 | 2,134 | 2.53 |
| Item | 2013 | 2014 | Change 2013-14 | %Change 2013-14 |
| Total Population: Gender & Age | 6,034,678 | 6,051,170 | 16,492 | 0.27 |
| Male | 2,916,409 | 2,923,159 | 6,750 | 2.53 |
| Female | 3,118,269 | 3,128,011 | 9,742 | 2.53 |
| Under 5 years | 368,199 | 364,842 | -3,357 | 2.53 |
| 5 to 9 years | 372,326 | 368,388 | -3,938 | -1.06 |
| 10 to 14 years | 384,011 | 382,535 | -1,476 | -0.38 |
| 15 to 19 years | 400,137 | 397,908 | -2,229 | -0.56 |
| 20 to 24 years | 420,547 | 416,513 | -4,034 | -0.96 |
| 25 to 34 years | 828,203 | 841,358 | 13,155 | 1.59 |
| 35 to 44 years | 753,906 | 748,911 | -4,995 | -0.66 |
| 45 to 54 years | 878,742 | 863,483 | -15,259 | -1.74 |
| 55 to 59 years | 415,113 | 433,969 | 18,856 | 4.54 |
| 55 to 59 years | 415,113 | 433,969 | 18,856 | 4.54 |
| 60 to 64 years | 355,644 | 355,209 | -435 | -0.12 |
| 65 to 74 years | 465,421 | 485,002 | 19,581 | 4.21 |
| 75 to 84 years | 260,337 | 262,956 | 2,619 | 1.01 |
| 85 years and over | 132,092 | 130,096 | -1,996 | -1.51 |
| Median age | 38.3 | 38.3 | 0.0 | 0.00 |
| 18 years and over | 4,674,830 | 4,700,574 | 25,744 | 0.55 |
| 21 years and over | 4,421,386 | 4,454,906 | 33,520 | 0.76 |
| 62 years and over | 1,063,475 | 1,077,469 | 13,994 | 1.32 |
| 65 years and over | 857,850 | 878,054 | 20,204 | 2.36 |
5. Housing Characteristics & Trends go top
Updated monthly, quarterly, annually. Housing market conditions and extended detail Available in subscription edition.
5.1. Total Housing Units
Updated Annually. Independent annual model-based estimates. For more information, detail & to compare areas use interactive table.
| Item | Census 2010 | July 1 2010 | July 1 2011 | July 1 2012 | July 1 2013 | July 1 2014 | Change 2010-2014 | %Change 2010-2014 |
| Total Housing Units | 2,433,611 | 2,434,321 | 2,436,228 | 2,438,294 | 2,442,617 | 2,448,852 | 14,531 | 0.60 |
5.2. General Housing Characteristics
Updated Annually. For more information, detail & to compare areas use interactive table.
| Item | 2013 | 2014 | Change 2013-14 | %Change 2013-14 |
| Housing Units: Units in Structure | 2,438,273 | 2,448,985 | 10,712 | 0.44 |
| 1-unit, detached | 1,072,115 | 1,088,195 | 16,080 | 1.50 |
| 1-unit, attached | 726,161 | 719,327 | -6,834 | -0.94 |
| 2 units | 120,272 | 117,405 | -2,867 | -2.38 |
| 3 or 4 units | 108,267 | 103,906 | -4,361 | -4.03 |
| 5 to 9 units | 90,327 | 89,446 | -881 | -0.98 |
| 10 to 20 units | 95,993 | 94,968 | -1,025 | -1.07 |
| 20 or more units | 194,734 | 203,217 | 8,483 | 4.36 |
| Item | 2013 | 2014 | Change 2013-14 | %Change 2013-14 |
| Housing Units: Occupancy & Tenure | 2,438,273 | 2,448,985 | 10,712 | 0.44 |
| Occupied Housing Units | 2,218,312 | 2,230,807 | 12,495 | 0.56 |
| Owner | 1,483,780 | 1,493,966 | 10,186 | 0.69 |
| Renter | 734,532 | 736,841 | 2,309 | 0.31 |
| Vacant Housing Units | 219,961 | 218,178 | -1,783 | -0.81 |
| Homeowner vacancy rate | 1.70 | 1.70 | 0.00 | ... |
| Rental vacancy rate | 7.00 | 7.10 | 0.10 | ... |
| Average household size; owner-occ | 2.79 | 2.77 | -0.02 | -0.72 |
| Average household size; renter-occ | 2.35 | 2.37 | 0.02 | 0.85 |
| Median Value $ owner occupied | 233,600 | 234,400 | 800 | 0.34 |
| Median Rent $ renter occupied | 997 | 1,020 | 23 | 2.31 |
5.3. Residential Construction; Housing Units Authorized & Value
Updated Monthly. 12 most recent months. For more information, detail & to compare areas use interactive table.
| Item | Aug15 | Sep15 | Oct15 | Nov15 | Dec15 | Jan16 | Feb16 | Mar16 | Apr16 | May16 | Jun16 | Jul16 |
| Total Residential Units | 1,154 | 1,246 | 1,336 | 1,032 | 983 | 886 | 872 | 987 | 965 | 1,074 | 1,255 | 868 |
| in 1 unit bldgs | 572 | 581 | 558 | 533 | 449 | 502 | 499 | 611 | 676 | 654 | 664 | 579 |
| in 2 unit bldgs | 24 | 28 | 32 | 28 | 14 | 18 | 24 | 22 | 26 | 16 | 14 | 20 |
| in 3-4 unit bldgs | 27 | 35 | 50 | 16 | 38 | 40 | 44 | 37 | 33 | 36 | 114 | 39 |
| in 5+ unit bldgs | 531 | 602 | 696 | 455 | 482 | 326 | 305 | 317 | 230 | 368 | 463 | 230 |
| Bldgs with 5+ units | 30 | 20 | 25 | 30 | 47 | 13 | 18 | 22 | 18 | 21 | 19 | 22 |
| Percent Coverage | 100 | 100 | 100 | 100 | 100 | 100 | 100 | 100 | 100 | 100 | 100 | 100 |
| Value ($000), Total Units | 166,052 | 187,174 | 242,103 | 158,623 | 122,802 | 130,011 | 148,771 | 155,941 | 151,570 | 166,413 | 202,916 | 148,145 |
| 1 unit structures | 109,149 | 112,842 | 113,657 | 104,304 | 82,711 | 99,455 | 92,308 | 105,872 | 125,012 | 122,027 | 122,840 | 108,550 |
| 2 unit structures | 2,575 | 2,421 | 2,676 | 3,050 | 1,475 | 2,799 | 3,036 | 2,457 | 2,195 | 1,970 | 1,519 | 2,439 |
| 3-4 unit structures | 3,186 | 3,449 | 5,652 | 968 | 3,407 | 4,741 | 4,193 | 3,362 | 4,079 | 4,149 | 14,413 | 3,938 |
| 5+ unit structures | 51,142 | 68,462 | 120,118 | 50,301 | 35,209 | 23,016 | 49,234 | 44,250 | 20,284 | 38,267 | 64,144 | 33,218 |
5.4. Housing Price Index go top
Updated quarterly. All transactions; not seasonally adjusted. See related Housing Price Index (HPI) interactive table.
See related 5-Digit ZIP Code HPI interactive table.
| Housing Price Index: | 2015Q3 | 2015Q4 | 2016Q1 | 2016Q2 | 2016Q3 |
| 226.18 | 225.91 | 229.39 | 234.89 | 239.02 | |
| Quarter-to-Quarter/Year Percent Change: | 2015Q3-2015Q4 | 2015Q4-2016Q1 | 2016Q1-2016Q2 | 2016Q2-2016Q3 | 2015Q3-2016Q3 |
| -0.12 | 1.54 | 2.40 | 1.76 | 5.68 |
6.1. Economic Profile go top
The Economic Profile shows shows derivation and key components of total personal income. Data are organized by place of residence and place of work. The place of residence profile includes estimates of total personal income, population, and per capita personal income. The place of work profile includes estimates of total earnings, total employment and average earnings per job. Updated annually. See related interactive table.
Dollar items are in current dollars (not adjusted for inflation). Per capita items in dollars; other dollar items in thousands of dollars.
See related notes.
| Item | 2011 | 2012 | 2013 | 2014 | 2015 | Change 2011-2015 | %Change 2011-2015 |
| Personal income | 302,778,441 | 318,053,338 | 320,087,487 | 333,836,899 | 347,031,985 | 44,253,544 | 14.6 |
| Net earnings 1/ | 199,647,716 | 208,468,162 | 211,471,498 | 219,219,222 | 228,325,349 | 28,677,633 | 14.4 |
| Personal current transfer receipts | 51,648,715 | 51,737,294 | 52,703,844 | 54,659,575 | 57,296,118 | 5,647,403 | 10.9 |
| Income maintenance 2/ | 5,610,377 | 5,811,659 | 5,899,462 | 6,030,134 | 6,096,191 | 485,814 | 8.7 |
| Unemployment insurance compensation | 3,371,487 | 2,624,251 | 1,950,141 | 1,112,357 | 985,270 | -2,386,217 | -70.8 |
| Retirement and other | 42,666,851 | 43,301,384 | 44,854,241 | 47,517,084 | 50,214,657 | 7,547,806 | 17.7 |
| Dividends, interest, and rent 3/ | 51,482,010 | 57,847,882 | 55,912,145 | 59,958,102 | 61,410,518 | 9,928,508 | 19.3 |
| Population 4/ | 5,997,102 | 6,021,349 | 6,036,356 | 6,053,720 | 6,069,875 | 72,773 | 1.2 |
| Per capita personal income | 50,487 | 52,821 | 53,027 | 55,146 | 57,173 | 6,686 | 13.2 |
| Per capita net earnings | 33,291 | 34,622 | 35,033 | 36,212 | 37,616 | 4,325 | 13.0 |
| Per capita personal current transfer receipts | 8,612 | 8,592 | 8,731 | 9,029 | 9,439 | 827 | 9.6 |
| Per capita income maintenance | 936 | 965 | 977 | 996 | 1,004 | 68 | 7.3 |
| Per capita unemployment insurance compensation | 562 | 436 | 323 | 184 | 162 | -400 | -71.2 |
| Per capita retirement and other | 7,115 | 7,191 | 7,431 | 7,849 | 8,273 | 1,158 | 16.3 |
| Per capita dividends, interest, and rent | 8,584 | 9,607 | 9,263 | 9,904 | 10,117 | 1,533 | 17.9 |
| Earnings by place of work | 215,721,098 | 224,646,801 | 231,142,166 | 239,327,620 | 249,636,192 | 33,915,094 | 15.7 |
| Wages and salaries | 150,989,033 | 156,544,955 | 159,620,514 | 166,040,516 | 173,064,369 | 22,075,336 | 14.6 |
| Supplements to wages and salaries | 37,192,947 | 37,298,237 | 38,689,916 | 39,431,619 | 41,202,387 | 4,009,440 | 10.8 |
| Employer cont. for empl. pension & insur. funds 6/ | 25,624,429 | 25,377,595 | 26,414,104 | 26,738,739 | 28,090,652 | 2,466,223 | 9.6 |
| Employer cont. for government social insurance | 11,568,518 | 11,920,642 | 12,275,812 | 12,692,880 | 13,111,735 | 1,543,217 | 13.3 |
| Proprietors' income | 27,539,118 | 30,803,609 | 32,831,736 | 33,855,485 | 35,369,436 | 7,830,318 | 28.4 |
| Nonfarm proprietors' income | 111,650 | 122,947 | 93,141 | 94,197 | 51,312 | -60,338 | -54.0 |
| Farm proprietors' income | 27,427,468 | 30,680,662 | 32,738,595 | 33,761,288 | 35,318,124 | 7,890,656 | 28.8 |
| Total full-time and part-time employment | 3,454,966 | 3,477,836 | 3,526,350 | 3,584,470 | 3,643,714 | 188,748 | 5.5 |
| Wage and salary jobs | 2,793,933 | 2,814,647 | 2,841,285 | 2,882,527 | 2,920,555 | 126,622 | 4.5 |
| Number of proprietors | 661,033 | 663,189 | 685,065 | 701,943 | 723,159 | 62,126 | 9.4 |
| Number of nonfarm proprietors 7/ | 5,648 | 5,496 | 5,611 | 5,661 | 5,611 | -37 | -0.7 |
| Number of farm proprietors | 655,385 | 657,693 | 679,454 | 696,282 | 717,548 | 62,163 | 9.5 |
| Average earnings per job (dollars) | 62,438 | 64,594 | 65,547 | 66,768 | 68,511 | 6,073 | 9.7 |
| Average wages and salaries | 54,042 | 55,618 | 56,179 | 57,602 | 59,257 | 5,215 | 9.6 |
| Average nonfarm proprietors' income | 41,849 | 46,649 | 48,184 | 48,488 | 49,221 | 7,372 | 17.6 |
See related notes.
6.2. Cost of Living Indexes go top
Updated periodically. Available in subscription edition.
6.3. Cost of Doing Business Indexes go top
Updated periodically. Available in subscription edition.
6.4. Consumer Price Index go top
Updated monthly. Available in subscription edition.
6.5. Gross Domestic Product by Sector go top
Updated quarterly, annually. For more information, detail & to compare areas use interactive table. Additional detail in subscription edition.
| Item | 2009 | 2010 | 2011 | 2012 | 2013 | 2014 | Change 2009-14 | %Change 2009-14 |
| Gross Domestic Product, millions of current dollars | 340,442 | 348,104 | 355,652 | 367,916 | 379,899 | 391,118 | 50,676 | 14.89 |
| Real Gross Domestic Product, millions of real dollars | 340,442 | 344,275 | 345,885 | 349,855 | 354,468 | 358,469 | 18,027 | 5.30 |
6.6. Establishments, Employment & Earnings by Detailed Type of Business go top
Updated quarterly. For more information, detail & to compare areas use interactive table.
| Sector | Establishments 2015Q1 | Employment 2015Q1 | Avg Weekly Wages 2015Q1 | Establishments 2015Q2 | Employment 2015Q2 | Avg Weekly Wages 2015Q2 |
| Total, all industries | 162,088 | 4,370,087 | 1,182 | 162,873 | 4,468,608 | 1,089 |
| Total, all industries - Fed Govt | 687 | 83,946 | 1,569 | 735 | 84,926 | 1,353 |
| Total, all industries - St Govt | 355 | ... | ... | 353 | ... | ... |
| Total, all industries - Local Govt | 2,679 | ... | ... | 2,677 | ... | ... |
| Total, all industries - Private | 158,367 | 3,821,194 | 1,186 | 159,108 | 3,913,899 | 1,079 |
| Goods-producing | 19,267 | 471,785 | 1,371 | 19,373 | 492,993 | 1,320 |
| Natural resources and mining | 713 | 16,455 | 708 | 719 | 19,230 | 722 |
| Construction | 13,082 | 156,566 | 1,180 | 13,159 | 173,188 | 1,238 |
| Manufacturing | 5,472 | 298,764 | 1,509 | 5,495 | 300,575 | 1,407 |
| Service-providing | 139,100 | 3,349,409 | 1,159 | 139,735 | 3,420,906 | 1,044 |
| Trade, transportation & utilities | 31,635 | 805,536 | 905 | 31,670 | 814,380 | 850 |
| Information | 1,955 | 72,226 | 1,778 | 1,972 | 71,863 | 1,592 |
| Financial activities | 13,817 | 324,879 | 2,302 | 13,844 | 327,360 | 1,723 |
| Professional & business services | 32,386 | 671,161 | 1,719 | 32,685 | 684,331 | 1,482 |
| Education and health services | 28,528 | 934,544 | 933 | 28,448 | 945,588 | 967 |
| Leisure and hospitality | 14,822 | 390,485 | 410 | 14,945 | 422,201 | 421 |
| Other services | 15,153 | 147,831 | 620 | 15,195 | 151,685 | 633 |
| Unclassified | 804 | 2,747 | 602 | 976 | 3,498 | 517 |
Notes: cell value of '...' indicates value suppressed to maintain confidentiality.
Use the following links to access detailed establishment and employment data by type of business (CSV files).
.. see notes on using these files.
2013Q1 .. 2013Q2 .. 2013Q3 .. 2013Q4 .|. 2014Q1 .. 2014Q2 .. 2014Q3 .. 2014Q4 .|. 2015Q1 .. 2015Q2 .. 2015Q3 .. 2015Q4 .. 2016Q1 .. 2016Q2
6.7. Labor Market Characteristics & Trends go top
Updated monthly. Available in subscription edition.
For more information, detail & to compare areas use interactive table.
Table shows 13 most recent months.
| Item | Aug15 | Sep15 | Oct15 | Nov15 | Dec15 | Jan16 | Feb16 | Mar16 | Apr16 | May16 | Jun16 | Jul16 | Aug16 |
| Unemplymnt Rate | 5.1 | 4.8 | 4.7 | 4.2 | 4.1 | 4.8 | 4.5 | 4.2 | 3.8 | 3.9 | 4.8 | 4.7 | 4.5 |
| Unemployment | 14,829 | 14,056 | 13,775 | 12,425 | 12,201 | 14,322 | 13,580 | 12,607 | 11,638 | 11,605 | 14,321 | 13,927 | 13,304 |
| Employment | 277,190 | 276,525 | 281,478 | 285,972 | 287,472 | 285,152 | 286,246 | 290,123 | 291,432 | 288,630 | 286,044 | 284,905 | 282,066 |
| Labor Force | 292,019 | 290,581 | 295,253 | 298,397 | 299,673 | 299,474 | 299,826 | 302,730 | 303,070 | 300,235 | 300,365 | 298,832 | 295,370 |
7. Education Infrastructure go top
7.1. Component School District Characteristics go top
Districts in this metro. Updated periodically. See related School District interactive table.
| District Name | City Name | District Code | Locale Code | County | State | 2012-13 Enrollment | 2013 Total Population | Grade Relevant Pop Ages 5-17 |
| Appoquinimink School District | Odessa | 1000080 | 41 | 10003 | DE | 9,380 | 54,976 | 12,222 |
| Brandywine School District | Wilmington | 1001240 | 21 | 10003 | DE | 10,851 | 90,014 | 13,601 |
| Christina School District | Wilmington | 1000200 | 21 | 10003 | DE | 16,384 | 173,681 | 26,436 |
| Colonial School District | New Castle | 1000230 | 21 | 10003 | DE | 9,697 | 84,059 | 14,200 |
| Red Clay Consolidated School District | Wilmington | 1001300 | 21 | 10003 | DE | 16,157 | 141,104 | 21,990 |
| Cecil County Public Schools | Elkton | 2400240 | 41 | 24015 | MD | 15,634 | 101,913 | 18,187 |
| Alloway Twp School District | Alloway | 3400810 | 42 | 34033 | NJ | 406 | 3,419 | 678 |
| Audubon Public Schools | Audubon | 3401050 | 21 | 34007 | NJ | 1,489 | 9,826 | 1,370 |
| Barrington School District | Barrington | 3401170 | 21 | 34007 | NJ | 626 | 6,969 | 978 |
| Bass River Township Board of Education | New Gretna | 3401200 | 41 | 34005 | NJ | 128 | 1,452 | 101 |
| Bellmawr Public Schools | Bellmawr | 3401380 | 21 | 34007 | NJ | 1,036 | 11,564 | 1,063 |
| Berlin Borough School District | Berlin | 3401590 | 21 | 34007 | NJ | 890 | 7,576 | 875 |
| Berlin Township School District | West Berlin | 3401620 | 21 | 34007 | NJ | 656 | 5,348 | 823 |
| Beverly City School | Beverly | 3401740 | 21 | 34005 | NJ | 307 | 2,589 | 397 |
| Black Horse Pike Regional School District | Blackwood | 3401770 | 21 | 34007 | NJ | 3,998 | 84,549 | 4,812 |
| Bordentown Regional | Bordentown | 3402030 | 21 | 34005 | NJ | 2,495 | 15,905 | 2,616 |
| Brooklawn Public School District | Brooklawn | 3402370 | 21 | 34007 | NJ | 361 | 1,952 | 313 |
| Burlington City Public Schools | Burlington | 3402430 | 21 | 34005 | NJ | 1,781 | 9,967 | 1,620 |
| Burlington Township Board of Education | Burlington | 3402460 | 21 | 34005 | NJ | 4,035 | 22,704 | 4,454 |
| Camden City Public Schools | Camden | 3402640 | 13 | 34007 | NJ | 12,608 | 77,222 | 16,160 |
| Cherry Hill Public Schools | Cherry Hill | 3403000 | 21 | 34007 | NJ | 11,516 | 70,762 | 12,070 |
| Chesilhurst | Chesilhurst | 3403030 | 21 | 34007 | NJ | 147 | 1,631 | 213 |
| Chesterfield Township School District | Chesterfield | 3403090 | 21 | 34005 | NJ | 640 | 7,735 | 515 |
| Cinnaminson Township Public Schools | Cinnaminson | 3403120 | 21 | 34005 | NJ | 2,328 | 15,642 | 2,623 |
| Clayton Public Schools | Clayton | 3403180 | 21 | 34015 | NJ | 1,367 | 8,239 | 1,518 |
| Clearview Regional High School District | Mullica Hill | 3403210 | 21 | 34015 | NJ | 2,466 | 27,824 | 2,866 |
| Clementon Elementary School | Clementon | 3403240 | 21 | 34007 | NJ | 467 | 4,992 | 724 |
| Collingswood Public Schools | Collingswood | 3403420 | 21 | 34007 | NJ | 1,862 | 13,911 | 1,757 |
| Delanco Township Schools | Delanco | 3403690 | 21 | 34005 | NJ | 386 | 4,303 | 582 |
| Delran Township School District | Delran | 3403780 | 21 | 34005 | NJ | 2,860 | 16,975 | 2,975 |
| Delsea Regional High School District | Franklinville | 3415450 | 41 | 34015 | NJ | 1,766 | 21,180 | 1,894 |
| Deptford Township Public School District | Deptford | 3403900 | 21 | 34015 | NJ | 4,350 | 30,783 | 4,548 |
| East Greenwich Township Board of Education | Mickleton | 3404140 | 21 | 34015 | NJ | 1,195 | 9,621 | 1,050 |
| Eastampton Township School District | Eastampton | 3404350 | 21 | 34005 | NJ | 631 | 6,098 | 701 |
| Eastern Camden County Regional School District | Voorhees | 3404380 | 21 | 34007 | NJ | 2,080 | 39,111 | 2,225 |
| Edgewater Park Township | Edgewater Park | 3404470 | 21 | 34005 | NJ | 878 | 8,923 | 1,217 |
| Elk Township School District | Glassboro | 3404620 | 41 | 34015 | NJ | 371 | 4,245 | 376 |
| Elmer Borough Board of Education | Pittsgrove | 3404650 | 41 | 34033 | NJ | ... | 1,376 | 225 |
| Elsinboro Township School District | Salem | 3404680 | 31 | 34033 | NJ | 121 | 1,022 | 130 |
| Evesham Township School District | Marlton | 3404890 | 21 | 34005 | NJ | 4,667 | 45,744 | 5,188 |
| Florence Township School District | Florence | 3405220 | 21 | 34005 | NJ | 1,593 | 12,166 | 1,881 |
| Franklin Township Board of Education | Franklinville | 3405430 | 41 | 34015 | NJ | 1,369 | 16,935 | 1,449 |
| Gateway Regional School Dsitrict | Woodbury Heights | 3405820 | 21 | 34015 | NJ | 894 | 12,744 | 995 |
| Gibbsboro Elementary School | Gibbsboro | 3405850 | 21 | 34007 | NJ | 266 | 2,266 | 233 |
| Glassboro Public Schools | Glassboro | 3405880 | 21 | 34015 | NJ | 2,213 | 18,706 | 2,454 |
| Gloucester City Public Schools | Gloucester City | 3406000 | 21 | 34007 | NJ | 2,027 | 11,440 | 1,990 |
| Gloucester Township Public Schools | Blackwood | 3406030 | 21 | 34007 | NJ | 6,929 | 64,530 | 7,509 |
| Greenwich Township School District | Gibbstown | 3406180 | 21 | 34015 | NJ | 510 | 4,933 | 738 |
| Haddon Heights Public Schools | Haddon Heights | 3406330 | 21 | 34007 | NJ | 1,326 | 7,461 | 1,198 |
| Haddon Township School District | Westmont | 3406360 | 21 | 34007 | NJ | 2,094 | 14,683 | 2,228 |
| Haddonfield Board of Education | Haddonfield | 3406390 | 21 | 34007 | NJ | 2,482 | 11,579 | 2,411 |
| Hainesport Township School District | Hainesport | 3406420 | 21 | 34005 | NJ | 695 | 6,139 | 792 |
| Harrison Township School District | Mullica Hill | 3406900 | 21 | 34015 | NJ | 1,437 | 12,502 | 1,530 |
| Hi Nella | Somerdale | 3407080 | 21 | 34007 | NJ | 2 | 869 | 115 |
| Kingsway Regional School District | Woolwich Twp. | 3407980 | 41 | 34015 | NJ | 2,360 | 25,676 | 2,167 |
| Laurel Springs School | Laurel Springs | 3408280 | 21 | 34007 | NJ | 185 | 1,905 | 310 |
| Lawnside School Distric | Lawnside | 3408340 | 21 | 34007 | NJ | 276 | 2,943 | 514 |
| Lenape Regional High School District | Shamong | 3408490 | 21 | 34005 | NJ | 7,064 | 140,924 | 8,160 |
| Lindenwold Board of Education | Lindenwold | 3408640 | 21 | 34007 | NJ | 2,411 | 17,585 | 2,386 |
| Logan Township School District | Logan Township | 3408880 | 21 | 34015 | NJ | ... | 6,083 | 1,213 |
| Lower Alloways Creek | Salem | 3409030 | 42 | 34033 | NJ | 203 | 1,745 | 282 |
| Lumberton Township Board of Education | Lumberton | 3409180 | 21 | 34005 | NJ | 1,532 | 12,618 | 1,730 |
| Magnolia | Magnolia | 3409300 | 21 | 34007 | NJ | 419 | 4,334 | 442 |
| Mannington Township School | Salem | 3409480 | 41 | 34033 | NJ | 183 | 1,781 | 230 |
| Mansfield Township School District | Columbus | 3409510 | 41 | 34005 | NJ | 700 | 8,584 | 701 |
| Mantua Township Board of Education | Sewell | 3409600 | 21 | 34015 | NJ | 1,327 | 15,321 | 1,413 |
| Maple Shade Schools | Maple Shade | 3409660 | 21 | 34005 | NJ | 2,080 | 19,221 | 2,292 |
| Medford Lakes School District | Medford Lakes | 3409840 | 21 | 34005 | NJ | 536 | 4,165 | 555 |
| Medford Township Public Schools | Medford | 3409870 | 41 | 34005 | NJ | 2,926 | 23,141 | 3,131 |
| Merchantville School District | Merchantville | 3409960 | 21 | 34007 | NJ | 374 | 3,815 | 565 |
| Monroe Township Board of Education | Williamstown | 3410470 | 21 | 34015 | NJ | 6,099 | 36,373 | 6,713 |
| Moorestown Township Public School District | Moorestown | 3410710 | 21 | 34005 | NJ | 3,998 | 20,823 | 4,502 |
| Mount Holly Township Public Schools | Mt. Holly | 3410920 | 21 | 34005 | NJ | 1,021 | 9,581 | 1,010 |
| Mount Laurel Township School District | Mount Laurel | 3410950 | 21 | 34005 | NJ | 4,125 | 42,061 | 4,491 |
| Mt. Ephraim | Mt. Ephraim | 3410890 | 21 | 34007 | NJ | 453 | 4,667 | 671 |
| National Park Boro School District | National Park | 3411100 | 21 | 34015 | NJ | 256 | 3,057 | 252 |
| New Hanover Township | Wrightstown | 3411250 | 31 | 34005 | NJ | 190 | 6,959 | 287 |
| Newfield Boro | Pittsgrove | 3411370 | 41 | 34033 | NJ | 13 | 1,564 | 277 |
| North Hanover Township School District | Wrightstown | 3411580 | 41 | 34005 | NJ | 1,271 | 8,981 | 1,007 |
| Northern Burlington County Regional School District | Columbus | 3411700 | 41 | 34005 | NJ | 1,987 | 28,730 | 1,997 |
| Oaklyn Public School | Oaklyn | 3411940 | 21 | 34007 | NJ | 439 | 4,032 | 544 |
| Oldmans Township | Pedricktown | 3412210 | 41 | 34033 | NJ | 228 | 1,748 | 285 |
| Palmyra Public Schools | Palmyra | 3412390 | 21 | 34005 | NJ | 965 | 7,433 | 924 |
| Paulsboro Public Schools | Paulsboro | 3412720 | 21 | 34015 | NJ | 1,174 | 6,139 | 1,188 |
| Pemberton Township Schools | Pemberton | 3412810 | 41 | 34005 | NJ | 4,994 | 29,459 | 4,875 |
| Penns Grove-Carneys Point Regional School District | Penns Grove | 3412840 | 21 | 34033 | NJ | 2,301 | 13,013 | 2,176 |
| Pennsauken Township Board of Education | Pennsauken | 3412870 | 21 | 34007 | NJ | 5,237 | 35,827 | 6,182 |
| Pennsville Public School District | Pennsville | 3409120 | 21 | 34033 | NJ | 1,830 | 13,222 | 2,073 |
| Pine Hill Borough Board of Education | Pine Hill | 3412990 | 21 | 34007 | NJ | 1,874 | 10,217 | 1,605 |
| Pine Valley | Clementon | 3413020 | 21 | 34007 | NJ | ... | 12 | 2 |
| Pitman Boro Public Schools | Pitman | 3413080 | 21 | 34015 | NJ | 1,458 | 9,073 | 1,496 |
| Pittsgrove Township Board of Education | Pittsgrove | 3413110 | 41 | 34033 | NJ | 1,796 | 9,263 | 1,605 |
| Quinton Township Board of Education | Quinton | 3413500 | 41 | 34033 | NJ | 379 | 2,629 | 439 |
| Rancocas Valley Regional High School | Mount Holly | 3413620 | 21 | 34005 | NJ | 2,014 | 43,290 | 2,563 |
| Riverside Township | Riverside | 3414010 | 21 | 34005 | NJ | 1,417 | 8,117 | 1,253 |
| Riverton School District | Riverton | 3414040 | 21 | 34005 | NJ | 268 | 2,792 | 405 |
| Runnemede Public School District | Runnemede | 3414430 | 21 | 34007 | NJ | 851 | 8,454 | 817 |
| Salem City Board of Education | Salem | 3414550 | 31 | 34033 | NJ | 1,205 | 5,075 | 947 |
| Shamong Township School District | Shamong | 3414880 | 21 | 34005 | NJ | 897 | 6,491 | 885 |
| Somerdale Public School | Somerdale | 3415000 | 21 | 34007 | NJ | 509 | 5,143 | 494 |
| South Harrison Township School District | Harrisonville | 3415270 | 41 | 34015 | NJ | 347 | 3,184 | 379 |
| Southampton Township School District | Southampton | 3415420 | 21 | 34005 | NJ | 768 | 10,513 | 799 |
| Springfield Township School District | Jobstown | 3415660 | 41 | 34005 | NJ | 264 | 3,430 | 317 |
| Sterling School District | Somerdale | 3402880 | 21 | 34007 | NJ | 906 | 16,505 | 867 |
| Stratford School District | Stratford | 3415870 | 21 | 34007 | NJ | 743 | 7,029 | 778 |
| Swedesboro-Woolwich Board of Education | Woolwich Twp | 3415990 | 21 | 34015 | NJ | 1,732 | 12,872 | 1,732 |
| Tabernacle Township School District | Tabernacle | 3416020 | 21 | 34005 | NJ | 788 | 7,011 | 877 |
| Upper Pittsgrove Twp Scool District | Monroeville | 3416590 | 41 | 34033 | NJ | 395 | 3,456 | 579 |
| Voorhees Township Board of Education | Voorhees | 3416830 | 21 | 34007 | NJ | 3,064 | 29,269 | 3,201 |
| Washington Township Public Schools | Sewell | 3417070 | 21 | 34015 | NJ | 7,935 | 48,880 | 8,887 |
| Washington Township School District | Egg Harbor | 3417040 | 41 | 34005 | NJ | 37 | 690 | 92 |
| Waterford Township Public Schools | Atco | 3417250 | 21 | 34007 | NJ | 908 | 10,632 | 1,752 |
| Wenonah Boro School District | Wenonah | 3417340 | 21 | 34015 | NJ | 247 | 2,294 | 245 |
| West Deptford Township Public Schools | West Deptford | 3417430 | 21 | 34015 | NJ | 3,004 | 21,826 | 3,406 |
| Westampton Township Public School District | Westampton | 3417730 | 21 | 34005 | NJ | 980 | 8,854 | 1,062 |
| Westville Boro Public School District | Westville | 3417790 | 21 | 34015 | NJ | 347 | 4,317 | 323 |
| Willingboro Public School District | Willingboro | 3418000 | 21 | 34005 | NJ | 3,952 | 31,774 | 5,406 |
| Winslow Township School District | Atco | 3418060 | 41 | 34007 | NJ | 4,483 | 39,436 | 7,072 |
| Woodbury City Public School District | Woodbury | 3418150 | 21 | 34015 | NJ | 1,505 | 10,244 | 1,618 |
| Woodbury Heights Public School District | Woodbury Heights | 3418180 | 21 | 34015 | NJ | 221 | 3,076 | 245 |
| Woodland Township Board of Education | Chatsworth | 3418240 | 42 | 34005 | NJ | ... | 1,796 | 144 |
| Woodlynne Boro Public School | Woodlynne | 3418270 | 21 | 34007 | NJ | 435 | 2,973 | 647 |
| Woodstown-Pilesgrove Regional School District | Woodstown | 3418330 | 31 | 34033 | NJ | 1,620 | 7,417 | 1,251 |
| Abington Sd | Abington | 4202040 | 21 | 42091 | PA | 7,586 | 58,791 | 9,473 |
| Avon Grove Sd | West Grove | 4202790 | 21 | 42029 | PA | 5,170 | 30,702 | 6,558 |
| Bensalem Township Sd | Bensalem | 4203330 | 21 | 42017 | PA | 6,348 | 60,582 | 8,406 |
| Bristol Borough Sd | Bristol | 4204200 | 21 | 42017 | PA | 1,202 | 9,753 | 1,518 |
| Bristol Township Sd | Levittown | 4204230 | 21 | 42017 | PA | 6,142 | 54,732 | 8,325 |
| Bryn Athyn Sd | Bryn Athyn | 4204090 | 21 | 42091 | PA | 7 | 1,390 | 230 |
| Centennial Sd | Warminster | 4205190 | 21 | 42017 | PA | 5,706 | 49,010 | 6,972 |
| Central Bucks Sd | Doylestown | 4205310 | 21 | 42017 | PA | 19,814 | 114,692 | 22,109 |
| Cheltenham Township Sd | Elkins Park | 4205760 | 21 | 42091 | PA | 4,504 | 37,331 | 5,548 |
| Chester-Upland Sd | Chester | 4205860 | 21 | 42045 | PA | 3,146 | 41,390 | 7,761 |
| Chichester Sd | Aston | 4205910 | 21 | 42045 | PA | 3,452 | 24,574 | 3,894 |
| Coatesville Area Sd | Coatesville | 4206240 | 21 | 42029 | PA | 7,165 | 64,281 | 10,569 |
| Colonial Sd | Plymouth Meeting | 4219470 | 21 | 42091 | PA | 4,690 | 42,359 | 6,096 |
| Council Rock Sd | Newtown | 4206960 | 21 | 42017 | PA | 11,426 | 72,657 | 13,607 |
| Downingtown Area Sd | Downingtown | 4207710 | 21 | 42029 | PA | 11,915 | 69,916 | 14,354 |
| Garnet Valley Sd | Glen Mills | 4210590 | 21 | 42045 | PA | 4,885 | 28,719 | 5,255 |
| Great Valley Sd | Malvern | 4210870 | 21 | 42029 | PA | 3,995 | 30,433 | 5,102 |
| Hatboro-Horsham Sd | Horsham | 4211610 | 21 | 42091 | PA | 4,881 | 34,031 | 6,054 |
| Haverford Township Sd | Havertown | 4211670 | 21 | 42045 | PA | 5,637 | 48,766 | 7,916 |
| Interboro Sd | Prospect Park | 4212170 | 21 | 42045 | PA | 3,487 | 23,725 | 3,714 |
| Jenkintown Sd | Jenkintown | 4212420 | 21 | 42091 | PA | 623 | 4,491 | 749 |
| Kennett Consolidated Sd | Kennett Square | 4212690 | 21 | 42029 | PA | 4,281 | 27,649 | 5,251 |
| Lower Merion Sd | Ardmore | 4214160 | 21 | 42091 | PA | 7,800 | 63,090 | 10,567 |
| Lower Moreland Township Sd | Huntingdon Valley | 4214190 | 21 | 42091 | PA | 2,173 | 13,191 | 2,491 |
| Marple Newtown Sd | Newtown Square | 4214760 | 21 | 42045 | PA | 3,358 | 35,851 | 5,508 |
| Methacton Sd | Eagleville | 4214250 | 21 | 42091 | PA | 5,085 | 35,736 | 6,519 |
| Morrisville Borough Sd | Morrisville | 4215900 | 21 | 42017 | PA | 925 | 8,752 | 1,247 |
| Neshaminy Sd | Langhorne | 4216410 | 21 | 42017 | PA | 8,473 | 70,946 | 10,829 |
| New Hope-Solebury Sd | New Hope | 4216860 | 21 | 42017 | PA | 1,598 | 11,251 | 1,808 |
| Norristown Area Sd | Norristown | 4216980 | 21 | 42091 | PA | 7,060 | 64,571 | 8,965 |
| North Penn Sd | Lansdale | 4217280 | 21 | 42091 | PA | 12,650 | 99,706 | 15,879 |
| Octorara Area Sd | Atglen | 4218030 | 41 | 42029 | PA | 2,508 | 18,357 | 3,819 |
| Owen J Roberts Sd | Pottstown | 4218270 | 41 | 42029 | PA | 5,116 | 33,482 | 6,171 |
| Oxford Area Sd | Oxford | 4218300 | 21 | 42029 | PA | 3,790 | 26,348 | 5,280 |
| Palisades Sd | Kintnersville | 4218330 | 42 | 42017 | PA | 1,758 | 14,977 | 2,181 |
| Penn-Delco Sd | Aston | 4218580 | 21 | 42045 | PA | 3,388 | 27,082 | 3,948 |
| Pennridge Sd | Perkasie | 4218750 | 21 | 42017 | PA | 7,339 | 48,446 | 8,447 |
| Pennsbury Sd | Fallsington | 4218840 | 21 | 42017 | PA | 10,434 | 71,361 | 12,820 |
| Perkiomen Valley Sd | Collegeville | 4218930 | 21 | 42091 | PA | 5,813 | 38,266 | 6,715 |
| Philadelphia City Sd | Philadelphia | 4218990 | 11 | 42101 | PA | 143,898 | 1,553,165 | 236,225 |
| Phoenixville Area Sd | Phoenixville | 4219050 | 21 | 42029 | PA | 3,440 | 32,697 | 4,928 |
| Pottsgrove Sd | Pottstown | 4219650 | 22 | 42091 | PA | 3,233 | 21,580 | 3,863 |
| Pottstown Sd | Pottstown | 4219680 | 22 | 42091 | PA | 3,096 | 22,727 | 3,569 |
| Quakertown Community Sd | Quakertown | 4219890 | 21 | 42017 | PA | 5,329 | 36,526 | 6,125 |
| Radnor Township Sd | Wayne | 4219920 | 21 | 42045 | PA | 3,641 | 31,714 | 4,909 |
| Ridley Sd | Folsom | 4220370 | 21 | 42045 | PA | 5,569 | 40,414 | 6,301 |
| Rose Tree Media Sd | Media | 4220550 | 21 | 42045 | PA | 3,742 | 35,468 | 4,957 |
| Souderton Area Sd | Souderton | 4221870 | 21 | 42091 | PA | 6,535 | 45,990 | 8,333 |
| Southeast Delco Sd | Folcroft | 4222400 | 21 | 42045 | PA | 3,988 | 30,526 | 5,485 |
| Spring-Ford Area Sd | Royersford | 4222560 | 21 | 42091 | PA | 7,859 | 48,125 | 9,237 |
| Springfield Sd | Springfield | 4222600 | 21 | 42045 | PA | 3,818 | 27,036 | 4,519 |
| Springfield Township Sd | Oreland | 4222620 | 21 | 42091 | PA | 2,217 | 19,726 | 3,077 |
| Tredyffrin-Easttown Sd | Wayne | 4223640 | 21 | 42029 | PA | 6,487 | 40,655 | 7,728 |
| Unionville-Chadds Ford Sd | Kennett Square | 4224210 | 21 | 42029 | PA | 4,018 | 24,127 | 4,726 |
| Upper Darby Sd | Drexel Hill | 4224320 | 21 | 42045 | PA | 12,449 | 91,133 | 15,032 |
| Upper Dublin Sd | Maple Glen | 4224390 | 21 | 42091 | PA | 4,295 | 25,969 | 5,113 |
| Upper Merion Area Sd | King Of Prussia | 4224480 | 21 | 42091 | PA | 4,000 | 34,798 | 4,617 |
| Upper Moreland Township Sd | Willow Grove | 4224510 | 21 | 42091 | PA | 3,082 | 24,390 | 3,594 |
| Upper Perkiomen Sd | Pennsburg | 4224540 | 41 | 42091 | PA | 3,251 | 22,584 | 3,800 |
| Wallingford-Swarthmore Sd | Wallingford | 4224790 | 21 | 42045 | PA | 3,524 | 21,723 | 3,774 |
| West Chester Area Sd | West Chester | 4225290 | 21 | 42029 | PA | 11,682 | 110,558 | 17,571 |
| William Penn Sd | Lansdowne | 4226390 | 21 | 42045 | PA | 5,217 | 42,364 | 7,449 |
| Wissahickon Sd | Ambler | 4202400 | 21 | 42091 | PA | 4,436 | 37,271 | 6,281 |
Number of districts: 186 ... Total enrollment: 753,496
All school districts interactive tables General Demographics | Social | Economic | Housing
All school districts enrollment & adminstratively reported data interactive table.
7.2. Component Higher Education Institution Characteristics go top
2014-15 School Year. Extended detail Available in subscription edition.
| Institution | City Name | Code | Level | Total UG Enrollment | Fulltime UG Enrollment | Total Grad Enrollment | Fulltime Grad Enrollment |
| Abington Memorial Hospital Dixon School of Nursing | Willow Grove, PA | 210456 | 4 | 224 | 224 | 0 | 0 |
| All-State Career School-Allied Health Campus | Essington, PA | 474997 | 4 | 322 | 322 | 0 | 0 |
| American College of Financial Services | Bryn Mawr, PA | 210809 | 9 | 19,961 | 0 | 950 | 0 |
| Antonelli Institute | Erdenheim, PA | 210890 | 3 | 188 | 188 | 0 | 0 |
| Arcadia University | Glenside, PA | 211088 | 9 | 2,594 | 2,367 | 1,345 | 507 |
| Aria Health School of Nursing | Trevose, PA | 212568 | 4 | 217 | 217 | 0 | 0 |
| Automotive Training Center-Exton | Exton, PA | 211006 | 4 | 372 | 342 | 0 | 0 |
| Automotive Training Center-Warminster | Warminster, PA | 448770 | 4 | 319 | 299 | 0 | 0 |
| Aviation Institute of Maintenance-Philadelphia | Philadelphia, PA | 250285 | 4 | 320 | 305 | 0 | 0 |
| Bryn Athyn College of the New Church | Bryn Athyn, PA | 210492 | 7 | 273 | 265 | 8 | 5 |
| Bryn Mawr College | Bryn Mawr, PA | 211273 | 9 | 1,308 | 1,291 | 401 | 338 |
| Buck's County School of Beauty Culture Inc | Feasterville, PA | 211316 | 3 | 84 | 68 | 0 | 0 |
| Bucks County Community College | Newtown, PA | 211307 | 3 | 8,979 | 3,047 | 0 | 0 |
| Burlington County College | Pemberton, NJ | 183877 | 3 | 9,438 | 4,827 | 0 | 0 |
| Cabrini College | Radnor, PA | 211352 | 7 | 1,406 | 1,283 | 797 | 111 |
| Cairn University-Langhorne | Langhorne, PA | 215114 | 7 | 813 | 767 | 245 | 51 |
| Camden County College | Blackwood, NJ | 183938 | 3 | 12,051 | 6,173 | 0 | 0 |
| Cecil College | North East, MD | 162104 | 3 | 2,551 | 1,011 | 0 | 0 |
| Chestnut Hill College | Philadelphia, PA | 211583 | 9 | 1,491 | 1,180 | 572 | 238 |
| Cheyney University of Pennsylvania | Cheyney, PA | 211608 | 7 | 997 | 936 | 25 | 6 |
| Community College of Philadelphia | Philadelphia, PA | 215239 | 3 | 19,119 | 4,832 | 0 | 0 |
| Cooper Health System Center for Allied Health Education | Camden, NJ | 184153 | 6 | 40 | 40 | 12 | 11 |
| Curtis Institute of Music | Philadelphia, PA | 211893 | 7 | 132 | 132 | 44 | 44 |
| DeVry University-Pennsylvania | Fort Washington, PA | 482608 | 7 | 904 | 322 | 276 | 50 |
| Delaware College of Art and Design | Wilmington, DE | 432524 | 3 | 185 | 166 | 0 | 0 |
| Delaware County Community College | Media, PA | 211927 | 3 | 12,459 | 4,341 | 0 | 0 |
| Delaware Technical Community College-Stanton/Wilmington | Wilmington, DE | 130916 | 3 | 6,700 | 2,188 | 0 | 0 |
| Delaware Valley College | Doylestown, PA | 211981 | 9 | 1,860 | 1,682 | 277 | 28 |
| Drexel University | Philadelphia, PA | 212054 | 9 | 16,896 | 14,365 | 9,463 | 4,837 |
| Eastern University | Saint Davids, PA | 212133 | 9 | 2,402 | 1,992 | 1,360 | 632 |
| Gloucester County College | Sewell, NJ | 184791 | 3 | 7,130 | 4,009 | 0 | 0 |
| Goldey-Beacom College | Wilmington, DE | 130989 | 7 | 639 | 492 | 1,373 | 37 |
| Gratz College | Melrose Park, PA | 212771 | 9 | 8 | 0 | 604 | 33 |
| Gwynedd Mercy University | Gwynedd Valley, PA | 212832 | 9 | 1,983 | 1,808 | 476 | 405 |
| Harcum College | Bryn Mawr, PA | 212869 | 4 | 1,588 | 1,045 | 0 | 0 |
| Haverford College | Haverford, PA | 212911 | 5 | 1,194 | 1,189 | 0 | 0 |
| Holy Family University | Philadelphia, PA | 212984 | 9 | 1,985 | 1,337 | 673 | 65 |
| Hussian School of Art | Philadelphia, PA | 212993 | 5 | 79 | 79 | 0 | 0 |
| ITT Technical Institute-Levittown | Levittown, PA | 440642 | 3 | 352 | 303 | 0 | 0 |
| ITT Technical Institute-Marlton | Marlton, NJ | 479558 | 3 | 383 | 319 | 0 | 0 |
| ITT Technical Institute-Philadelphia | Philadelphia, PA | 479549 | 3 | 777 | 681 | 0 | 0 |
| ITT Technical Institute-Plymouth Meeting | Plymouth Meeting, PA | 442347 | 3 | 273 | 207 | 0 | 0 |
| Immaculata University | Immaculata, PA | 213011 | 9 | 2,138 | 1,107 | 1,161 | 175 |
| Jna Institute of Culinary Arts | Philadelphia, PA | 419341 | 3 | 59 | 59 | 0 | 0 |
| Kaplan Career Institute-Broomall | Broomall, PA | 215646 | 3 | 337 | 337 | 0 | 0 |
| Kaplan Career Institute-Franklin Mills | Philadelphia, PA | 211617 | 3 | 640 | 640 | 0 | 0 |
| Kaplan Career Institute-Philadelphia | Philadelphia, PA | 214254 | 3 | 610 | 610 | 0 | 0 |
| La Salle University | Philadelphia, PA | 213367 | 9 | 4,322 | 3,583 | 1,920 | 388 |
| Lansdale School of Business | North Wales, PA | 213473 | 3 | 344 | 173 | 0 | 0 |
| Lincoln Technical Institute-Center City Philadelphia | Philadelphia, PA | 442046 | 3 | 533 | 477 | 0 | 0 |
| Lincoln Technical Institute-Northeast Philadelphia | Philadelphia, PA | 442037 | 3 | 310 | 310 | 0 | 0 |
| Lincoln Technical Institute-Philadelphia | Philadelphia, PA | 213589 | 3 | 360 | 290 | 0 | 0 |
| Lincoln University of Pennsylvania | Lincoln University, PA | 213598 | 7 | 1,589 | 1,428 | 230 | 144 |
| Manor College | Jenkintown, PA | 213774 | 3 | 780 | 471 | 0 | 0 |
| Metropolitan Career Center Computer Technology Institute | Philadelphia, PA | 214023 | 3 | 31 | 22 | 0 | 0 |
| Montgomery County Community College | Blue Bell, PA | 214111 | 3 | 12,805 | 4,343 | 0 | 0 |
| Moore College of Art and Design | Philadelphia, PA | 214148 | 7 | 412 | 393 | 41 | 26 |
| National Massage Therapy Institute | Philadelphia, PA | 448114 | 3 | 138 | 126 | 0 | 0 |
| Neumann University | Aston, PA | 214272 | 9 | 2,562 | 1,992 | 485 | 107 |
| Northeastern Hospital School of Nursing | Philadelphia, PA | 383400 | 4 | 70 | 70 | 0 | 0 |
| Orleans Technical Institute | Philadelphia, PA | 214528 | 3 | 332 | 222 | 0 | 0 |
| Peirce College | Philadelphia, PA | 214883 | 7 | 1,771 | 347 | 62 | 7 |
| Pennco Tech-Blackwood | Blackwood, NJ | 186052 | 4 | 601 | 408 | 0 | 0 |
| Pennco Tech-Bristol | Bristol, PA | 214944 | 3 | 500 | 345 | 0 | 0 |
| Pennsylvania Academy of the Fine Arts | Philadelphia, PA | 214971 | 7 | 169 | 165 | 89 | 89 |
| Pennsylvania Institute of Technology | Media, PA | 214582 | 3 | 661 | 444 | 0 | 0 |
| Pennsylvania State University-Penn State Abington | Abington, PA | 214801 | 6 | 3,947 | 3,117 | 5 | 0 |
| Pennsylvania State University-Penn State Brandywine | Media, PA | 214731 | 5 | 1,488 | 1,272 | 0 | 0 |
| Philadelphia University | Philadelphia, PA | 215099 | 9 | 2,911 | 2,555 | 851 | 446 |
| Prism Career Institute-Upper Darby | Upper Darby, PA | 215433 | 4 | 543 | 513 | 0 | 0 |
| Rosemont College | Rosemont, PA | 215691 | 7 | 522 | 442 | 368 | 108 |
| Rowan University | Glassboro, NJ | 184782 | 9 | 12,022 | 10,499 | 2,756 | 1,254 |
| Roxborough Memorial Hospital School of Nursing | Philadelphia, PA | 213932 | 4 | 143 | 143 | 0 | 0 |
| Rutgers University-Camden | Camden, NJ | 186371 | 9 | 4,857 | 3,990 | 1,464 | 698 |
| Saint Charles Borromeo Seminary-Overbrook | Wynnewood, PA | 216047 | 7 | 73 | 53 | 131 | 67 |
| Saint Joseph's University | Philadelphia, PA | 215770 | 9 | 5,512 | 4,671 | 3,462 | 552 |
| Salem Community College | Carneys Point, NJ | 186469 | 3 | 1,173 | 641 | 0 | 0 |
| Strayer University-Delaware | Newark, DE | 450298 | 7 | 237 | 28 | 98 | 18 |
| Strayer University-New Jersey | Cherry Hill, NJ | 453215 | 7 | 648 | 75 | 210 | 57 |
| Strayer University-Pennsylvania | Trevose, PA | 443784 | 7 | 1,538 | 158 | 565 | 96 |
| Swarthmore College | Swarthmore, PA | 216287 | 5 | 1,542 | 1,534 | 0 | 0 |
| Talmudical Yeshiva of Philadelphia | Philadelphia, PA | 216311 | 5 | 120 | 120 | 0 | 0 |
| Temple University | Philadelphia, PA | 216339 | 9 | 28,287 | 24,990 | 9,198 | 6,817 |
| The Art Institute of Philadelphia | Philadelphia, PA | 210942 | 5 | 1,953 | 1,229 | 0 | 0 |
| The Restaurant School at Walnut Hill College | Philadelphia, PA | 215637 | 5 | 396 | 396 | 0 | 0 |
| The University of the Arts | Philadelphia, PA | 215105 | 7 | 1,754 | 1,711 | 140 | 97 |
| Thomas Jefferson University | Philadelphia, PA | 216366 | 9 | 891 | 649 | 2,715 | 1,979 |
| Universal Technical Institute of Pennsylvania Inc | Exton, PA | 445799 | 4 | 1,623 | 1,623 | 0 | 0 |
| University of Delaware | Newark, DE | 130943 | 9 | 18,951 | 17,467 | 3,729 | 2,922 |
| University of Pennsylvania | Philadelphia, PA | 215062 | 9 | 11,548 | 10,406 | 13,258 | 11,035 |
| University of Phoenix-Pennsylvania | Philadelphia, PA | 484783 | 7 | 639 | 639 | 30 | 30 |
| University of the Sciences | Philadelphia, PA | 215132 | 9 | 1,628 | 1,607 | 1,120 | 875 |
| Ursinus College | Collegeville, PA | 216524 | 5 | 1,681 | 1,662 | 0 | 0 |
| Valley Forge Christian College | Phoenixville, PA | 216542 | 7 | 850 | 603 | 35 | 7 |
| Valley Forge Military College | Wayne, PA | 216551 | 3 | 322 | 322 | 0 | 0 |
| Villanova University | Villanova, PA | 216597 | 9 | 7,118 | 6,554 | 3,617 | 1,298 |
| West Chester University of Pennsylvania | West Chester, PA | 216764 | 9 | 13,844 | 12,558 | 2,242 | 845 |
| Widener University-Delaware Campus | Wilmington, DE | 244190 | 9 | 93 | 22 | 649 | 620 |
| Widener University-Main Campus | Chester, PA | 216852 | 9 | 3,350 | 2,861 | 1,562 | 703 |
| Wilmington University | New Castle, DE | 131113 | 9 | 8,810 | 3,485 | 5,657 | 1,757 |
Number of institutions: 100 ... Total undergraduate enrollment: 314,084
Levels: 3-Assoc degree, 4-at least 2, but < 4 years, 5-Bach degree, 6-Postbacc cert, 7 Masters degree, 8 Post-masters cert, 9 Doctors degree
8. GeoPolitics go top
Updated periodically. Voting patterns, citizen voting age population, state legislative districts, congressional districts .. in this metro.
Available in subscription edition.
Notes
• All data are for current vintage county and metro definition.
• Developed by ProximityOne -- Metro Reports (888-364-7656)
• Data sources: ProximityOne, Census Bureau, Bureau of Economic Analysis, Bureau of Labor Statistics, Federal Housing Finance Agency,
National Center for Education Statistics.
Updates go top
The subscription edition updates frequently. Selected items are listed below. Register to receive update notifications.
• Overview lead narrative; quarterly & annual/March.
• Housing Price Index (section 5.4) quarterly.
• Establishments, employment & earnings (section 6.6) quarterly.
• Economic profile and personal income (section 6.1) annual/November.
• Labor market situation (section 6.7) monthly.
• Residential construction; units authorized & value (section 5.3.) monthly.
• Population by county; annual series 2010-2016 (section 4.2.) annual/July.
• Population by county; links for individual counties (section 4.2.) annual/July.
-- includes annual data 2010-2016.
-- includes components of change; race/origin; single year of age; age group summaries.
• Total population and components of change; annual/March.
• Census tracts overview section; annual/December.
• General Demographics section updated/extended; annual/December.
• Gross Domestic Product section; annual/September.
• Higher education institutions; annual/February.
• Metro & county demographic component detailed annual estimates; annual/March.
• School districts in metro & K-12 enrollment; annual/August.
More about schedule and upcoming events ... Calendar ... Upcoming Events ... Find Event
Terms of Use go top
Situation & Outlook Reports are a proprietary resource developed by ProximityOne. There is no warranty of any type associated with any aspect of this report. The user of this document is solely responsible to any use, direct or indirect, that might be made of this document.
Related Resources go top
• Metros main page
• Current estimates and projections: states to 2030, counties & metros to 2020 by age, counties & states to 2060.
• Making Custom Metropolitan Area Maps
• Rental Market Conditions by Metropolitan Area
• Metro Gross Domestic Product
• Housing Price Index
• Establishments, Employment & Earnings
• Regional Economic Information System
• ACS 2014 1-year General Demographics ... Social Characteristics ... Economic Characteristics ... Housing Characteristics
Using this Document go top
The Situation & Outlook Report, a component of the Situation & Outlook, is a core ProximityOne information resource providing insights into characteristics and trends of counties, metropolitan areas, states and the U.S. The Report also provides a gateway to drill-down demographic, economic and business data for smaller geographic areas.
Metropolitan areas include approximately 94 percent of the U.S. population -- 85 percent in metropolitan statistical areas (MSAs) and 9 percent in micropolitan statistical areas (MISAs).
About Metropolitan Areas & Principal Cities -- scroll section go top
Metropolitan Areas are designated by OMB ("Standards for Delineating Metropolitan and Micropolitan Statistical Areas") based
mainly on Census Bureau-sourced data.
Metropolitan areas are defined as Metropolitan Statistical Areas (MSA) and Micropolitan Statistical Areas (MISA).
MSAs and MISAs are also referred to a Core-Based Statistical Areas (CBSAs).
Contiguous CBSAs are defined as Combined Statistical Areas (CSA).
By definition, metropolitan areas are comprised of one or more contiguous counties. Metropolitan areas are not single cities and typically include many cities. Metropolitan areas are comprised of urban and rural areas and often have large expanses of rural territory. A business and demographic-economic synergy exists within each metro; metros often interact with adjacent metros. The demographic-economic make-up of metros vary widely and change often. See more about metros.
Principal Cities. The largest city in each metropolitan or micropolitan statistical area is designated a "principal city." Principal cities are designated by OMB based on Census-sourced data. Additional cities qualify as principal cities if specified requirements are met concerning population size and employment. The title of each metropolitan or micropolitan statistical area consists of the names of up to three of its principal cities and the name of each state into which the metropolitan or micropolitan statistical area extends. Titles of metropolitan divisions also typically are based on principal city names but in certain cases consist of county names.
One or more principal cities are designated within each Metropolitan Statistical Area (MSA) and Micropolitan Statistical Area (MISA). The term "principal city" is defined in the OMB "Standards for Delineating Metropolitan and Micropolitan Statistical Areas." A principal city is an OMB designation applied to one or more incorporated places and/or census designated places (CDPs). The OMB standards designate a Principal City (or Cities) of a Core-Based Statistical Area (CBSA) as determined by:
a) The largest incorporated place with a 2010 Census population of at least 10,000 in the CBSA or,
if no incorporated place of at least 10,000 population is present in the CBSA,
the largest incorporated place or census designated place in the CBSA; and
b) Additional places with 2010 Census population of at least 250,000 or in which 100,000 or more persons work; and
c) Additional places with 2010 Census population of 50,000-250,000,
and number of workers working in the place meets or exceeds the number of workers living in the place; and
d) Additional places with 2010 Census population of 10,000-50,000, and at least one-third the population size of the largest place,
and in which the number of workers working in the place meets or exceeds the number of workers living in the place.
ProximityOne User Group go top
Join the ProximityOne User Group to keep up-to-date with new developments relating to metros and component geography decision-making information resources. Receive updates and access to tools and resources available only to members. Use this form to join the User Group.
Support Using these Resources go top
Learn more about accessing and using demographic-economic data and related analytical tools. Join us in a Data Analytics Lab session. There is no fee for these one-hour Web sessions. Each informal session is focused on a specific topic. The open structure also provides for Q&A and discussion of application issues of interest to participants.
Additional Information go top
ProximityOne develops geographic-demographic-economic data and analytical tools and helps organizations knit together and use diverse data in a decision-making and analytical framework. We develop custom demographic/economic estimates and projections, develop geographic and geocoded address files, and assist with impact and geospatial analyses. Wide-ranging organizations use our tools (software, data, methodologies) to analyze their own data integrated with other data. Follow ProximityOne on Twitter at www.twitter.com/proximityone. Contact us (888-364-7656) with questions about data covered in this section or to discuss custom estimates, projections or analyses for your areas of interest.
Copyright © 2018 ProximityOne