

|
|
-- assessing competitive position and change -- expanding insights through data analytics -- examining components of change characteristics August 2023 .. new 2023 CBSA/metro delineations are now available as of August 2023. See more about the 2023 delineations. Core-Based Statistical Areas (CBSAs) are officially designated by OMB and composed of one or more contiguous counties and must meet a population size criteria of associated Urban Area. CBSAs are classified as the larger Metropolitan Statistical Areas (MSAs; 387 in United States and 6 in Puerto Rico) and smaller Micropolitan Statistical Areas (MISAs; (538 in United States and 4 in Puerto Rico). Use the interactive table below to view, rank, query 2023 CBSAs by component area. See the related section focused on 2020 vintage CBSAs. CBSA/Metro Mapping & GeoSpatial Analysis View and examine the 2020 and 2023 vintage CBSAs using the VDA Web GIS with the MetroDynamics GIS project. Examine metros in context of other geography. Click here to start VDA Web GIS; uses a browser, nothing to install. Use the spreadsheet/grid feature to examine the metros in a tabular manner. Two VDA GIS MetroDynamics Projects VDA GIS users may select from two similar but different MetroDynamics projects. Select either of these projects using the Project Manager screen after login. • MetroDynamics 2020 - start-up view U.S. by 2020 CBSA/MSA - a focus on subject matter tabulated for 2020 vintage CBSAs. • MetroDynamics 2023 - start-up view Fresno CA MSA -- comparing/contrasting 2020/2023 CBSAs - still includes 2020 vintage CBSAs and Census 2020 & ACS 2021 subject matter. - a focus on subject matter tabulated for 2023 vintage CBSAs. - Census will not produce Census 2020, ACS 2021 or ACS 2022 (September 2023) data for 2023 CBSAs. - ProximityOne will produce Census 2020, ACS 2021 or ACS 2022 data for 2023 CBSAs. .. providing access as files and via VDA GIS tools Comparing Fresno, CA MSA 2020 and 2023 Vintages The graphic below shows the MetroDynamics 2023 GIS project using VDA Web GIS. Many CBSAs changed between the 2020 and 2023 delineations. County(s) comprising the CBSA increased or decreased while others remained the same. The following graphic illustrates how the Fresno, CA MSA changed from one county in 2020 (black boundary) to two counties based on the 2023 delineation (bolder brown boundary). The Madera County, CA MSA was a separate MSA based on the 2020 delineation and no longer exists as a separate MSA based on the 2023 delineations. 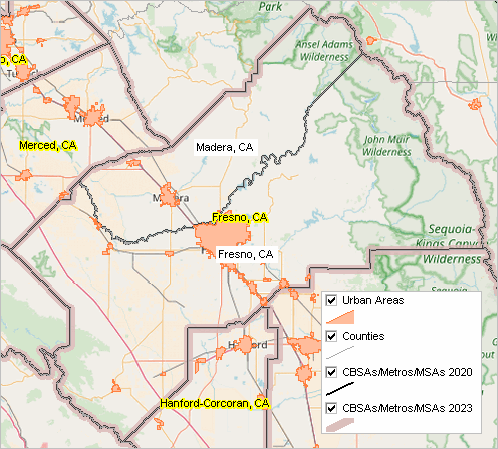 More than 93-percent of the total U.S. population live in metropolitan areas. Unlike most states and many counties, there is a business and demographic/economic synergy that exists within the metro and often interacts with adjacent metros. The geographic-demographic-economic make-up of these areas vary widely and changes often. This section provides resources, tools to examine/analyze metropolitan area geographic, demographic, economic characteristics and patterns. How might change in metros affect your organization and stakeholders? Use the interactive table below to view, query, sort, rank metros on your selected criteria. Custom Zoom Meeting Focused on Your Metro Contact me (e-mail or call 888-364-7656) to arrange a zoom meeting for your group. Demographic-economic characteristics and trends are reviewed. .. the metro, counties, cities with drill down to tracts and block groups .. examine how climate change might impact your metro between now and 2060. .. using Web and other resources participants can continue to access/use. .. presented by Warren Glimpse Using VDA Web GIS to Examine Metro Characteristics & Trends Map graphic shows patterns of change in economic prosperity .. as measured by median household income ($MHI) .. legend shows ACS2019 $MHI to ACS2021 $MHI percent change .. 513 CBSAs/metros with 65,000 population or more. .. start using VDA Web GIS with MetroDynamics project & geospatial data analytics. 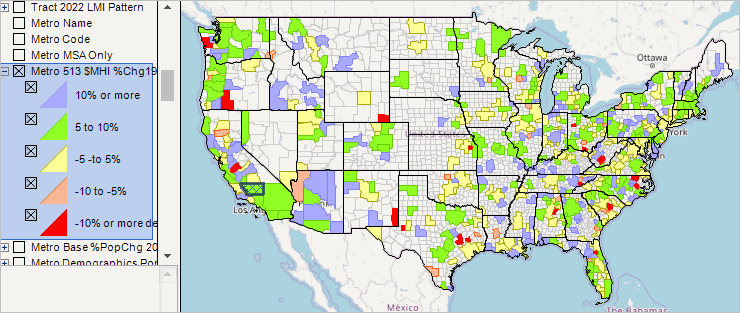 MetroDynamics GIS Project & Database -- see details. Use the interactive table below to examine metropolitan area 2020 and 2021 population and components of change. See in this section .. highlights .. about metros .. related metro data/analytical resources. Patterns of Percent Population Change 2020-21 by Metro .. Southwest metros. Click graphic for larger view; expand browser window. .. St. George, UT MISA had highest national CBSA one year percent increase. .. see related New York Times section on high growth areas like St. George despite fire risk 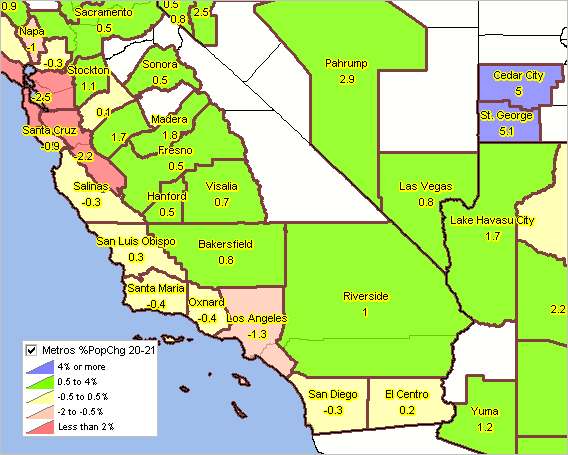 Map and geospatially analyze these data using the VDA Web GIS and VDA Desktop GIS tools. Access these and related data with a Web browser, nothing to install. Get underway today examining CBSA/Metros using interactive tables and maps/geospatial analysis. Largest 50 Metros Based on Census 2020 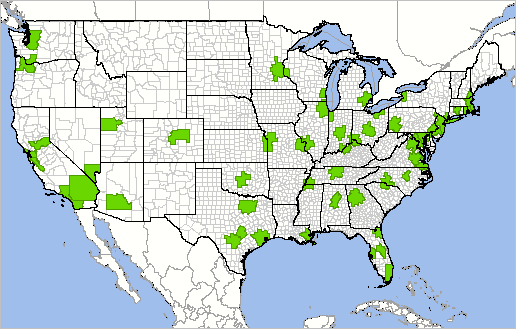 View/analyze characteristics of Core-Based Statistical Areas (CBSAs), metros, using the VDA desktop GIS and/or VDA Web GIS. See more about VDA. Relating Metros to Urban Areas using VDA Web GIS • view step-by-step procedures to develop view similar to the one shown below. • use a one-click operation to view demographics for a ZIP code or county (Census 2020 profile). Create views like shown below for metros of interest in context of other geographic areas using VDA Web GIS. This graphic shows urban areas in context of the Dallas MSA. 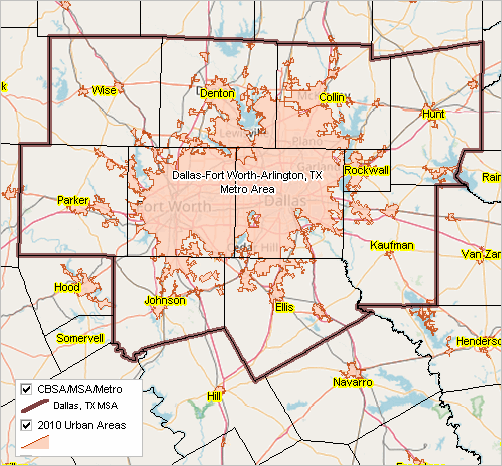 Join in the Conversation Reviewing how metros are changing ... join in the Data Analytics Web Sessions where we review and discuss these prospective changes in more detail. Every Tuesday 3:00 pm ET. Examining Metro Composition CBSAs, Metropolitan Statistical Areas (MSAs) and Micropolitan Statistical Areas (MISAs), are comprised of a set of contiguous counties. Use the interactive table below to examine annual population and components of change. These same data are available in the CV XE GIS "US1" GIS project and the VDA Mapserver integrated with other geography and demographic-economic data. In this Section • Interactive Table .. examine demographic characteristics for selected or peer group metros .. click a link to view a Situation & Outlook Report for a metro • Updates ... updated frequently, summarizing new developments • Related Sections • About Metropolitan Areas Use tools and data provided here to examine how the U.S. by metro population is changing ... is the population moving away or into metros of interest? What are the trends; what is causing the change? What are the characteristics of the population moving in and out? How might this impact your living environment and business? 2023 Vintage CBSAs/metros interactive table ... goto top View 2020 Vintage CBSAs/Metros Table below contains a row for each 2023 vintage CBSA and component areas. Click column header to sort; again to sort other direction Click ShowAll button between queries to refresh. Usage notes below table. About Core-Based Statistical Areas/Metros ... goto top The U.S. Office of Management and Budget (OMB) delineates metropolitan and micropolitan statistical areas according to standards applied to Census Bureau and related data. A metropolitan or micropolitan statistical area has a core area containing a substantial population nucleus, together with adjacent areas having a high degree of economic and social integration with that core. See 2020 Standards for Delineating Core Based Statistical Areas published in the Federal Register. The term "Core Based Statistical Area" (CBSA) refers collectively to metropolitan and micropolitan statistical areas. Each CBSA must contain at least one urban area of 10,000 or more population. Each metropolitan statistical area (MSA) must have at least one urbanized area of 50,000 or more inhabitants. Each micropolitan statistical area (MISA) must have at least one urban cluster of at least 10,000 but less than 50,000 population. The largest city in each metropolitan or micropolitan statistical area is designated a "principal city." Additional cities qualify if specified requirements are met concerning population size and employment. The title of each metropolitan or micropolitan statistical area consists of the names of up to three of its principal cities and the name of each state into which the metropolitan or micropolitan statistical area extends. Individual CBSAs (MSAs and MISAs) are defined as one or more contiguous counties. Combined Statistical Areas (CSAs) are defined as a set of two or more contiguous CBSAs. County Building Blocks. Current vintage metropolitan and micropolitan statistical area (CBSA) designations are comprised of county building blocks as defined by OMB and updated from time-to-time. Support Using these Resources .. goto top Learn more about accessing and using demographic-economic data and related analytical tools. Join us in a Data Analytics Lab session. There is no fee for these one-hour Web sessions. Each informal session is focused on a specific topic. The open structure also provides for Q&A and discussion of application issues of interest to participants. ProximityOne User Group Join the ProximityOne User Group to keep up-to-date with new developments relating to metros and component geography decision-making information resources. Receive updates and access to tools and resources available only to members. Use this form to join the User Group. Additional Information ProximityOne develops geodemographic-economic data and analytical tools and helps organizations knit together and use diverse data in a decision-making and analytical framework. We develop custom demographic/economic estimates and projections, develop geographic and geocoded address files, and assist with impact and geospatial analyses. Wide-ranging organizations use our tools (software, data, methodologies) to analyze their own data integrated with other data. Follow ProximityOne on Twitter at www.twitter.com/proximityone. Contact us (888-364-7656) with questions about data covered in this section or to discuss custom estimates, projections or analyses for your areas of interest. |
|
|