

|
|
-- tools & data to analyze neighborhood level demographics & change April 2019 .. tools and data to visually and geospatially analyze demographic-economic characteristics and trends in Puerto Rico. Use the ProximityOne CV XE GIS software and related 2019 GIS project and data resources to examine patterns and assess conditions. Use the interactive table below to view, rank, compare measures like economic prosperity at the neighborhood/census tract level. The impact of Hurricane Maria extends to some of the most current and historical data about Puerto Rico. Data presented here make use of some of those data. Looking ahead, we assemble and integrate new data for 2018/2019 and develop projections. Progressively these data will be used in models that can estimate/project the impact of alternative policy tools, assumptions and related developments. In May 2019, we introduce new Puerto Rico by municipio annual population estimates and components of change for the period 2010 through 2018, that will be used to develop projections. Relevant and consumable data are essential to help businesses grow, improve educational opportunities and better plan and operate government. See more below. Topics • Examine quarterly economic outlook by municipio by detailed type of business. .. Area updates • Start using the data access/analytics tools and data below. • Examine characteristics of neighborhoods using the interactive table below. • See about terms of use Visualizing Puerto Rico Geographic, Demographic & Economic Characteristics The following graphic shows the start-up view of the Puerto Rico GIS project (details below). Counties/municipios are shown with black boundaries in context of metros (bold boundary labeled with metro name). 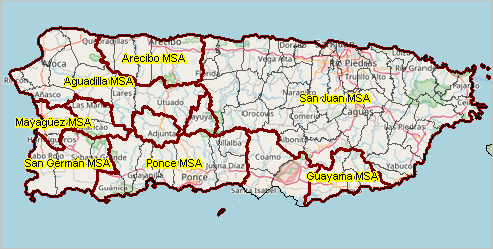 - View developed using CV XE GIS and related GIS project. Patterns of Economic Prosperity by Census Tracts/Neighborhoods .. median household income based on ACS 2017 estimates; click graphic to view larger view/legend. 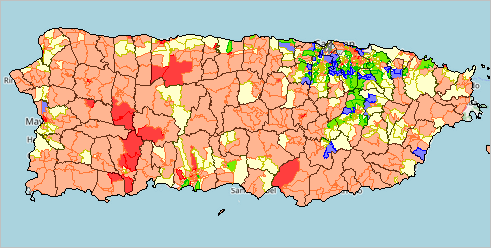 K-12 Schools & Hospitals in San Juan Area .. goto top .. illustrates zoom-in; zoom to any detail. .. hospitals red markers; click for larger view showing school level markers in legend. 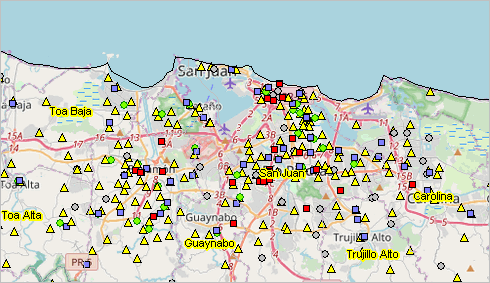 Counties/Municipios for which ACS 2017 1-year estimates were developed .. areas with 65,000 population or more with green fill pattern; click graphic for larger view. 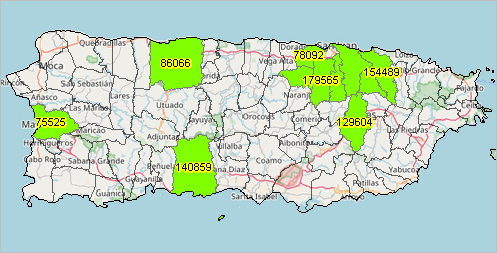 In 2017, the largest 11 municipios (based on ACS 1 year population estimates, green pattern in above view, 65,000 population or more, and listed in table below) accounted for 1,408,708 population of the total Puerto Rico population of 3,337,177 (42.2%).
Urban Areas .. goto top 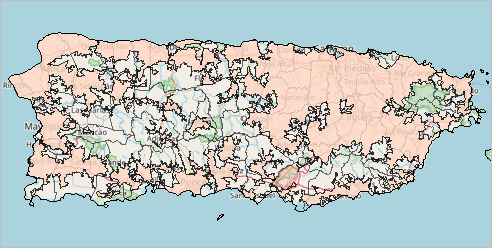 Cities/Places .. goto top 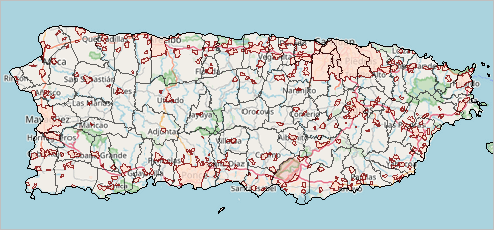 Public Use Microdata Areas PUMAs .. goto top .. create custom demographic estimates by PUMA (100,000 population or more) from microdata/PUMS files 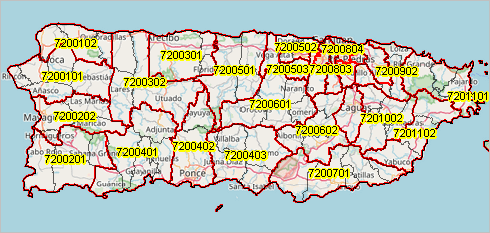 Examining Attributes of a Selected Census Tract .. goto top .. using CV XE GIS search/zoom feature, tract 72127010002 is located as shown in graphic below. .. this tract is also used as the example in the interactive table below. .. tracts are labeled with the tract code (yellow) and median household income (white). .. the detailed intersection to intersection roads layer is shown. .. the identify tool (see pointer) is used to display attributes of a selected road segment. .. the mini-profile displays attributes of the road segment based on the TIGER/Line files. 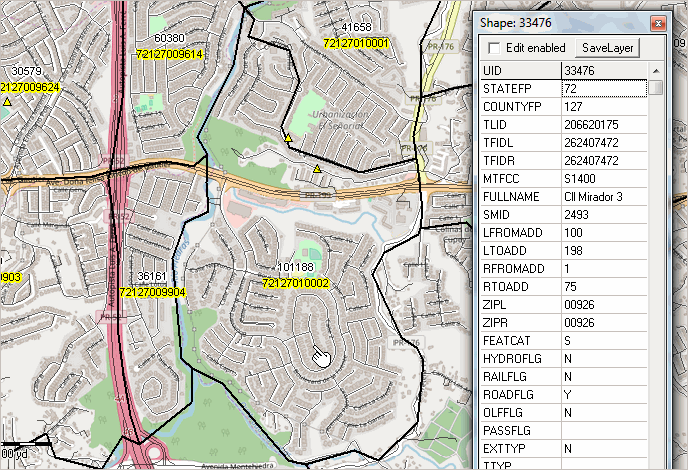 Using Census Block and Block Group Geodemographics .. goto top Puerto Rico, and the U.S. overall, are covered wall-to-wall with the low-level statistical geography of census blocks and block groups. These geographies nest within, and are coterminous with, census tracts. These relationships are shown in the graphic below; tracts: blue boundary, block groups: red boundary, blocks: black boundary. The identify tool (at pointer) is used to show mini-profile for block 72-127-010002-1004. Census block level data are available only from the decennial census/Census 2010; Block group level data are available from Census 2010, American Community Survey ... or aggregate your own data to these geographies. 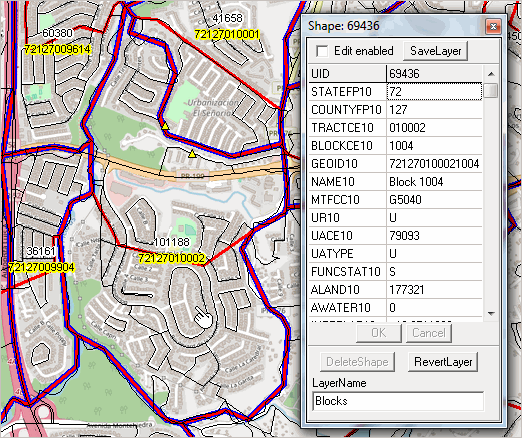 Interactive Table Use the interactive ranking table in this section to view, query, rank, compare general demographics of the population, households and families in these areas. The scroll box shown below lists each of the subject matter items available for each area via the ranking table. The number at the left of the subject matter item is also used as the short name for the subject matter item in the column header in the ranking table. Census Tract Demographics Interactive Table ACS 2017 Click ShowAll button between queries. This table shows selected subject matter items among more than 1,000 available. Click column header to sort; click again to sort other direction. See usage notes below table. Data based on ACS 2017 5 year estimates. See related interactive tables Usage Notes • Tract code column: Census 2010 census tract code structured as 11 characters: - ss (state postal code) + ccc (county FIPS code) + tttttt (Census 2010 census tract code). - all 11 characters required to uniquely identify a tract code. • Use Select Tract button to select one tract: - enter 11-character State+County FIPS code in edit box at right of Tract button. - click ShowAll button. - click Select Tract button to view/analyze selected tract. • Use StCty button to select/filter for all tracts in a county: • Click ShowAll button between specific queries. • Cells with -1 value could not be estimated (for this geography and this time frame). Subject Matter Items (Columns) in Table (scroll section)
- GEOID
- Tract - Area Name - StCty - Population - MedAge - Voting Age Population - Voting Age Population Male - Voting Age Population Female - Percent H.S. Graduates - Percent College Graduates - MHI$ - median household income - AHI$ - mean household income - MFI$ - median family income - AFI$ - mean familiy income - Housing Units - Occupied Units (households) - Vacant Units - Owner Occupied Units - Renter Occupied Units - Median Housing Value - Median Rent Creating Map Pattern Views & Visual Analysis .. goto top .. requires Windows computer with Internet connection .. requires your personal userid/password -- issued with CV Level 1 or higher or User Group. 1. Install the ProximityOne CV XE GIS ... not required in CV XE GIS already installed. ... run the CV XE GIS installer ... take all defaults during installation 2. Download the Puerto Rico GIS project fileset ... these resources available as part of the Mapping Statistical Data program; see details; user ID required ... unzip Puerto Rico GIS project files to local folder c:\pr 3. Open the c:\pr\us1_2019_sd_pr.gis project ... after completing the above steps, click File>Open>Dialog ... open the file named c:\pr\us1_2019_sd_pr.gis project 4. Done. The start-up view is similar to the graphic shown at the top of this section. Establishments, Employment & Wages by Municipio .. goto top How did the number of establishments in the information sector in the San Juan Municipio change from 2017Q1 to 2018Q3? Employment? Wages? How does that compare to other sectors, to other municipios and the Commonwealth overall? How might this change into 2020? How might this change impact you? What policy tools might be used to augment economic activity by sector and/or municipio? Answering these types of questions ... ProximityOne develops economic time series by municipio containing historical (based on data from the Bureau of Labor Statistics) and projected (developed by ProximityOne) quarterly data, updated/extended quarterly. The data are developed for all municipios and include the number of establishments, employment and average weekly wages by type of business (up to 6-digit detail NAICS category). Use ProximityOne models to examine what-if questions and alternative scenario projections. Examine business establishment patterns and trends for San Juan Municipio ... view this illustrative XLS file. This file contains a record/row for each type of business and each type of owner (e.g., private sector versus government) for the municipio; the time series values run across the columns. See the column/field descriptions list below. Compare, for example that as of 2017Q1 total private establishments numbered 10,547 with employment of 177,749 and average weekly wages of $583 (line 285) compared with 2018Q3 10,492 total private establishments, 178,481 employment and $586. These data update in June 2019. There is a approximate 6 month lag between the release of the data from the reference date to the data access date. Items in Record (scroll section)
AreaName
STAB - state abbreviation GEOID - municipio code OWNCODE - owner code (5: private) INDCODE - industry code (6 digit NAICS) AGGLVL - aggregation level SIZECODE - size code DISCCODE - disclosure code INDTITLE - industry title EST17Q1 - Establishments, 2017Q1 EMP17Q1 - Employment, 2017Q1 AWW17Q1 - Average Weekly Wages, 2017Q1 EST17Q2 - repeats EMP17Q2 AWW17Q2 EST17Q3 EMP17Q3 AWW17Q3 EST17Q4 EMP17Q4 AWW17Q4 EST18Q1 EMP18Q1 AWW18Q1 EST18Q2 EMP18Q2 AWW18Q2 EST18Q3 - Establishments, 2018Q3 - most recent reported; extends June 2019 EMP18Q3 - Employment, 2018Q3 - most recent reported; extends June 2019 AWW18Q3 - Average Weekly Wages, 2018Q3 - most recent reported; extends June 2019 EST18Q4 - Establishments, 2018Q4 - projection; updates June 2019 EMP18Q4 - Employment, 2018Q4 - projection; updates June 2019 AWW18Q4 - Average Weekly Wages, 2018Q4 - projection; updates June 2019 EST19Q1 - repeats EMP19Q1 AWW19Q1 EST19Q2 EMP19Q2 AWW19Q2 EST19Q3 EMP19Q3 AWW19Q3 EST19Q4 EMP19Q4 AWW19Q4 Area Updates .. goto top This subsection provides selected demographic-economic updates for metro areas. • Aguadilla Area • Ponce Area • San Juan Area Adjuntas MISA Aguadilla MSA • Arecibo MSA Coamo MISA Coco MISA Guayama MSA Jayuya MISA Mayagúez MSA Ponce MSA San Germán MSA San Juan MSA Santa Isabel MISA The Power of Relevant and Consumable Data .. goto top With the destructive consequences of Hurricane Maria, many buildings and infrastructure have been lost. Rebuilding has been delayed for many reasons. Some statistical programs have been abandoned. The Commonwealth had previously participated in the Census building permits program. These data give insights into where, when and what type of construction is occurring. There are no Census/Commonwealth building permits data for 2017, 2018 and now 2019. Without these data, it becomes more difficult to know the current situation and how/where things are changing. Terms of Use .. goto top Data and tools made available in this section are intended for users of the CV XE GIS software. The software and data are not authorized for redistribution except by supplemental agreement. The software and data are not authorized for business, for fee, or funded research except by supplemental agreement. There is no warranty of any type regarding any aspect of these resources. The user is solely responsible for any use made of these resources. ProximityOne User Group Join the ProximityOne User Group to keep up-to-date with new developments relating to metros and component geography decision-making information resources. Receive updates and access to tools and resources available only to members. Use this form to join the User Group. Support Using these Resources Learn more about accessing and using demographic-economic data and related analytical tools. Join us in a Data Analytics Lab session. There is no fee for these one-hour Web sessions. Each informal session is focused on a specific topic. The open structure also provides for Q&A and discussion of application issues of interest to participants. Additional Information ProximityOne develops geodemographic-economic data and analytical tools and helps organizations knit together and use diverse data in a decision-making and analytical framework. We develop custom demographic/economic estimates and projections, develop geographic and geocoded address files, and assist with impact and geospatial analyses. Wide-ranging organizations use our tools (software, data, methodologies) to analyze their own data integrated with other data. Follow ProximityOne on Twitter at www.twitter.com/proximityone. Contact us (888-364-7656) with questions about data covered in this section or to discuss custom estimates, projections or analyses for your areas of interest. |
|
|