
|
|
|
CVXE GIS Tools Data Resources Guide - projections to 2060 Related Sections - Situation & Outlook - Applications Gallery - States - Congressional District - School Districts - Counties - Cities/Places - Tracts/Neighborhoods - Block Groups - Census Blocks - Urban Areas Estimates-Projections - 2060 Demographic ... all county interactive table - 2030 Demographic-Economic - Single Year of Age GIS Thematic Mapping Visual Analysis Tools Ranking Tables National Scope Demographic Change 2000-2010 - States - Metros - Congressional District - School Districts - Counties - Cities/Places - Census Tracts |
Tracking Language Use and the Decennial Census
Since 1790, the decennial census has been arguably the single most important U.S. geographic-demographic-economic statistical data resource. Data from these decennial censuses are in daily widespread use for analysis and decision-making. The companion TIGER/Line digital map database is the underlying geographic database enabling most Web browser maps. The TIGER data helped spawn the development of Geographic Information Systems (GIS) and visual data analysis. This section illustrates use of the New York Times Chronicle tool to track language use relating to the decennial census. The Chronicle tool can be used to visualize language use in the New York Times news coverage throughout its history. The following graphics show results of using the Chronicle tool. There are additional features of the tool not shown here, notably lists of accessible NYT stories. Click graphics for larger view. Decennial Census -- all references 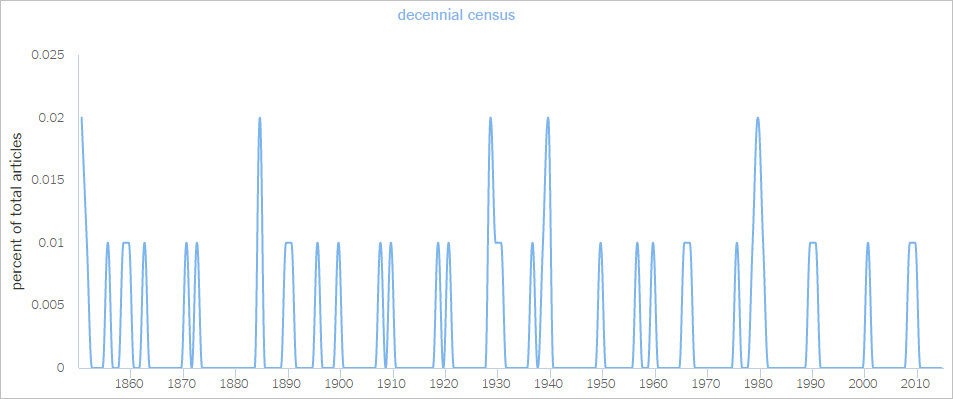 Decennial Census -- 1960 through 2010  More about Census 2010 Redistricting - Reapportionment -- a basic reason for the decennial census 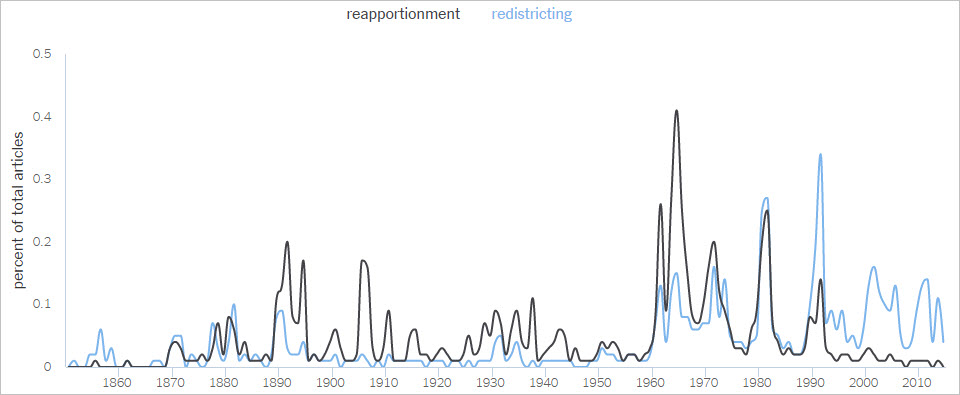 More about congressional districts ... state legislative districts Asian - Hispanic -- race/origin; decennial census is source of most detailed data on these topics 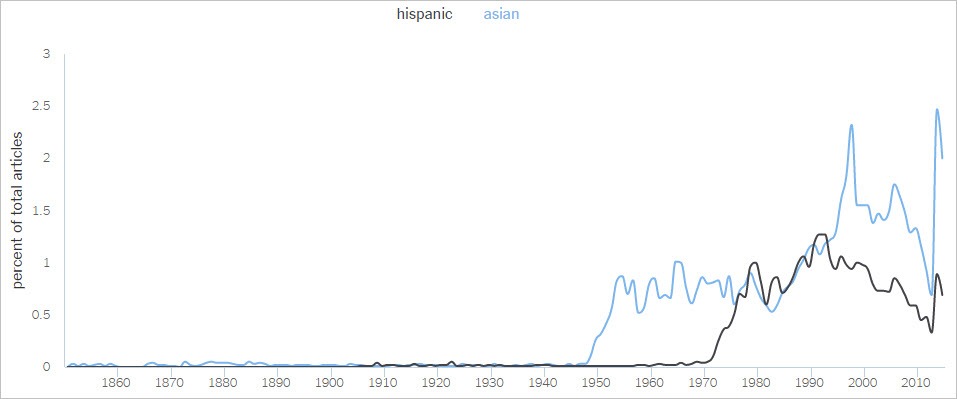 More about Asian population ... Hispanic population Integration - Segregation - Diversity -- topics making widespread use of decennial census data  More about neighborhood diversity ... USATODAY diversity analyses American Community Survey -- the "rolling annual census" introduced in 2004 .. this program will overtake the decennial census in stories in the near future. It provides annual refreshed on a wider array of topics. 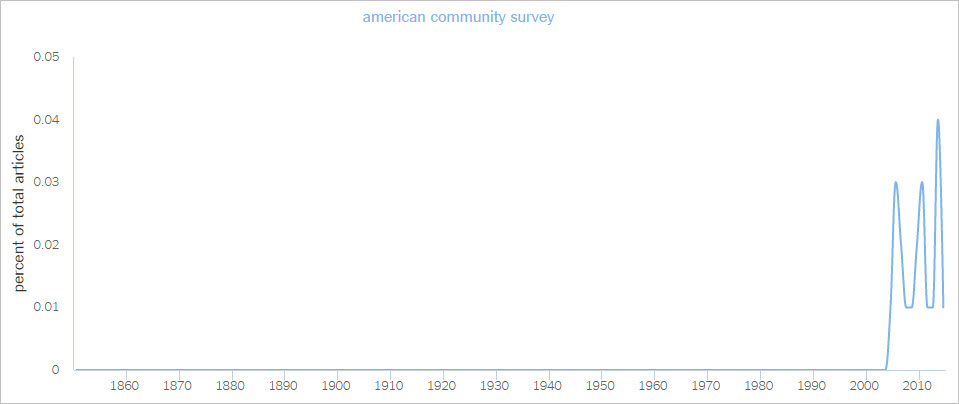 More about ACS 2013 Exactly how the decennial census has been used in stories cannot be effectively determined using the Chronicle tool. The decennial census lead-up and process of conducting and tabulation data is the basis of many stories. The use of decennial census data is yet another basis for stories. Support Using Geographic-Demographic-Economic Resources Learn more about demographic economic data and related analytical tools. Join us in a Decision-Making Information Web session. There is no fee for these Web sessions. Each informal session is focused on a specific topic. The open structure also provides for Q&A and discussion of application issues of interest to participants. ProximityOne User Group Join the ProximityOne User Group to keep up-to-date with new developments relating to geographic-demographic-economic decision-making information resources. Receive updates and access to tools and resources available only to members. Use this form to join the User Group. There is no fee. Additional Information ProximityOne develops geographic-demographic-economic data and analytical tools and helps organizations knit together and use diverse data in a decision-making and analytical framework. We develop custom demographic/economic estimates and projections, develop geographic and geocoded address files, and assist with impact and geospatial analyses. Wide-ranging organizations use our software, data and methodologies to analyze their own data integrated with other data. Follow ProximityOne on Twitter at www.twitter.com/proximityone. Contact ProximityOne (888-364-7656) with questions about data covered in this section or to discuss custom estimates, projections or analyses for your areas of interest. |
|
|