
|
|
|
Differences and similarities in USPS ZIP Code and Census Bureau ZCTAs ... and how they might impact data analytics and insights .. ZIP code data are widely used in part because we can attach personal identity to these codes and locations. They are also widely used because many data can only be tabulated, or exist by, ZIP code or it is infeasible or too expensive to convert address-based or ZIP code data to other types of geography. This section reviews ZIP Code and ZCTA relationships and provides an interactive table to view, compare and query 5-digit ZIP codes and demographic data. Demographic-economic data are now developed annually by ZIP Codes Tabulations Area (ZCTA) as a part the American Community Survey (ACS 2015). This is the only source of national scale, annually updated, data for a broad and diverse set of demographic-economic attributes. A key feature of these data is that the same set of subject matter are also tabulated for wide-ranging smaller and larger geographic areas. We are able to compare attributes for a ZIP code area with the same attributes of, for example, a neighborhood, city, school district or the U.S. The ACS data are tabulated for ZIP code areas which are similar to, but different from, the U.S. Postal Service (USPS) ZIP codes developed to deliver mail. ZCTAs are polygons whose location and area are well defined by shapefiles for use in mapping and GIS applications. USPS ZIP codes are not polygons but a set of lines and points typically not forming polygons. USPS ZIP codes correspond a set of roads, streets and specific addresses. The USPS does not provide shapefiles nor other latitude-longitude representations for USPS ZIP codes. Current vintage ZCTAs were defined for Census 2010. ZCTA boundaries do not change over time. Summary statistics developed from Census 2010 and ACS 2010 and annually thereafter are developed for these same non-changing polygon areas. There are 33,121 ZCTAs in the U.S. USPS ZIP codes change some over time in terms of boundaries and minor change occur to ZIP codes (code/numbers). There are approximately 42,000 USPS ZIP codes. Patterns of Rental Vacancy Rate by ZCTA; Detroit Area The following graphic shows rental vacancy rate (RVR) by ZCTA based on ACS 2014. ZCTAs are labeled with ZCTA code. The inset legend shows RVR values and associated color patterns. 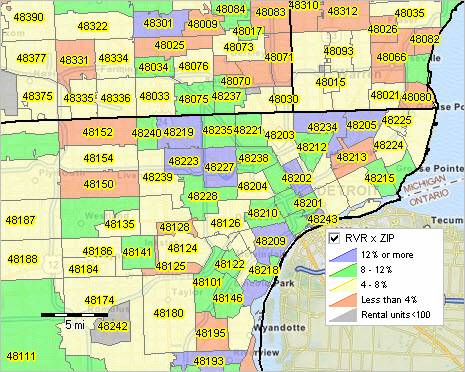 - view developed using CVGIS and related GIS project. - see related interactive table and more detail. Using the Interactive Table Use the interactive table below to view/rank/compare USPS ZIP Codes with ZCTAs. The table includes one row for each USPS ZIP Code. The type of USPS ZIP Code is shown in column 2. See usage notes below the table for a description of each column. An example using ZIP Code 85258. Click ShowAll button below table. Click Find in Name button below table using the default value of Scottsdale. Table refreshes showing Scottsdale, AZ ZIP codes. Note ZIP code 85258 shows two links. Click column 1 link to view USPS ZIP Code map/boundary. Click column 7 link to view ZCTA map/boundary. Column 8 shows that ZCTA 85258 had population of 23,342 as of Census 2010. Column 9 shows the ZCTA 85258 ACS 2015 5-year population estimate of 22,654. USPS ZIP Code & ZIP Code Tabulation Area (ZCTA) Relationship Table Click column header to sort; click again to sort other direction. See related interactive demographic-economic tables Usage Notes Column descriptions • Column 1 -- USPS ZIP Code • Column 2 -- type of USPS ZIP code. .. ZCA - ZIP code area .. POS - Post Office or USPS customer location .. MIL - Military, such as APO • Column 3 -- value of 1 for each unique occurrence of a ZCTA code. • Column 4 -- name assigned by the USPS to the USPS ZIP Code.. • Column 5 -- state USPS abbreviation. • Column 6 -- state FIPS code. • Column 7 -- ZCTA code. • Column 8 -- Census 2010 population for this ZCTA. • Column 9 -- ACS 2015 5-year population estimate this ZCTA. Related ZIP Code Sections & Resources [goto top] • Summary of ZIP Code Data Resources & Tools - http://proximityone.com/zipdata.htm • Analyzing Census Tract Demographics by ZIP Code Area - http://proximityone.com/tractzip.htm • 10 Reasons to use Census Tracts Versus ZIP Codes - http://proximityone.com/tracts_zips.htm • ZIP Code to Census Tract Equivalence Table - http://proximityone.com/ziptractequiv.htm • Housing Price Index by 3-digit ZIP code - updated quarterly - http://proximityone.com/hpizip3.htm • Housing Price Index by 5-digit ZIP code - updated annually - http://proximityone.com/hpizip.htm Support Using these Resources [goto top] Learn more about demographic economic data and related analytical tools. Join us in a Data Analytics Lab session. There is no fee for these Web sessions. Each informal session is focused on a specific topic. The open structure also provides for Q&A and discussion of application issues of interest to participants. ProximityOne User Group [goto top] Join the ProximityOne User Group to keep up-to-date with new developments relating to geographic-demographic-economic decision-making information resources. Receive updates and access to tools and resources available only to members. Use this form to join the User Group. Additional Information ProximityOne develops geodemographic-economic data and analytical tools and helps organizations knit together and use diverse data in a decision-making and analytical framework. We develop custom demographic/economic estimates and projections, develop geographic and geocoded address files, and assist with impact and geospatial analyses. Wide-ranging organizations use our tools (software, data, methodologies) to analyze their own data integrated with other data. Follow ProximityOne on Twitter at www.twitter.com/proximityone. Contact us (888-364-7656) with questions about data covered in this section or to discuss custom estimates, projections or analyses for your areas of interest. |
|
|