
|
|
|
.. examining metropolitan area dynamics ... how will the market for single family homes in the Atlanta-Sandy Springs-Roswell, GA metro change over the next 5 years? 20 years? How does the metro GDP in the Atlanta metro compare to others? What are the patterns in metro rental income and homeownership/vacancy rates? How are they trending? We examine these types of topics in this section. Stakeholders can replicate applications reviewed here for this and other metros using ProximityOne no fee resources. Metropolitan areas include approximately 94 percent of the U.S. population -- 85 percent in metropolitan statistical areas (MSAs) and 9 percent in micropolitan statistical areas (MISAs). Of 3,143 counties in the United States, 1,167 are in the 381 MSAs in the U.S. and 641 counties are in the 536 MISAs (1,335 counties are in non-metro areas). Focus on Atlanta-Sandy Springs-Roswell, GA MSA This section is focused on the Atlanta-Sandy Springs-Roswell, GA MSA; Core-Based Statistical Areas (CBSA) 12060. It is not intended to be a study of the metro but rather illustrate how relevant decision-making information (DMI) resources can be brought together to examine patterns and change and develop insights. The data, tools and methods can be applied to any metro. The Atlanta-Sandy Springs-Roswell, GA MSA is shown in the graphic below. The 30-county metropolitan statistical area is shown with bold brown boundary; counties appear with black boundaries and county name labels. The thematic pattern shows a measure of economic prosperity (median household income: MHI) by census tract. 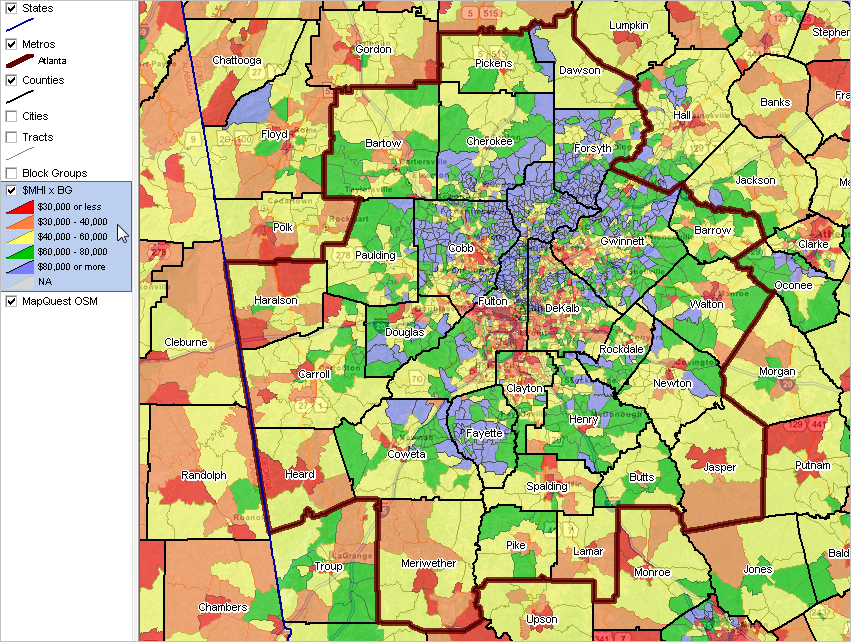 Click graphic for larger view with details; the larger view shows interval values associating MHI with income levels. Develop variations of this map view using the Mapping Georgia Neighborhood Patterns GIS resources. Metro-County Geographic-Demographic Structure The Census 2010 population of the metro was 5,286,728 (9th largest) compared to 5,522,942 (9th largest) based on the 2013 estimate. Metros of similar size include Miami-Fort Lauderdale-West Palm Beach, FL and Boston-Cambridge-Newton, MA-NH. See interactive table to examine other metros in a similar manner. Click here to view a metro by county profile for the Atlanta metro. Click the county component links below to view annual county population estimates and components of change.
• Barrow County (13013)
• Bartow County (13015) • Butts County (13035) • Carroll County (13045) • Cherokee County (13057) • Clayton County (13063) • Cobb County (13067) • Coweta County (13077) • Dawson County (13085) • DeKalb County (13089) • Douglas County (13097) • Fayette County (13113) • Forsyth County (13117) • Fulton County (13121) • Gwinnett County (13135) • Haralson County (13143) • Heard County (13149) • Henry County (13151) • Jasper County (13159) • Lamar County (13171) • Meriwether County (13199) • Morgan County (13211) • Newton County (13217) • Paulding County (13223) • Pickens County (13227) • Pike County (13231) • Rockdale County (13247) • Spalding County (13255) • Walton County (13297 Use this interactive table to view demographic attributes of these counties and rank/compare with other counties. Population Pyramids & Age-Cohort Patterns The graphic below shows the Census 2010 Fulton County population pyramid. Click graphic to view as HTML section with related Census 2010 age-gender population distribution. Fulton County, GA; Census 2010; Total population 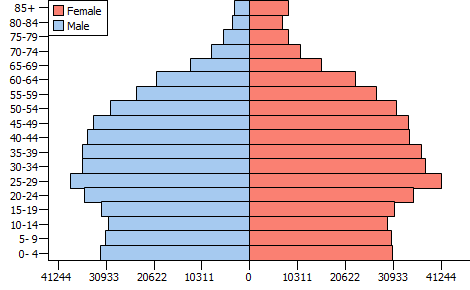 Use ChartGraphics examine population by age-gender-race/origin for any county. Metro Demographic-Economic Characteristics In 2012, the metro median household income was $54,628, percent high school graduates 87.8%, percent college graduates 35.3% and 16.6% in poverty. Use the following U.S.-state-metro interactive table to view/compare/rank compare this metro with other areas: • General Demographics -- http://proximityone.com/usstcbsa12dp1.htm • Social Characteristics -- http://proximityone.com/usstcbsa12dp2.htm • Economic Characteristics -- http://proximityone.com/usstcbsa12dp3.htm • Housing Characteristics -- http://proximityone.com/usstcbsa12dp4.htm Metro Per Capita Personal Income In 2012, the Atlanta metro had a per capita personal income (PCPI) of $40,963. This PCPI ranked 131st among all MSAs (374) and was 93.7 percent of the national average, $43,735. The 2012 PCPI reflected an increase of 2.7 percent from 2011. The 2011-2012 national change was 3.4 percent. In 2000, the PCPI of the Atlanta metro was $33,764 and ranked 33rd among all metros(374). See related interactive table. Metro Per Capita Income as a Percent of the United States 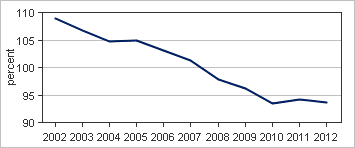
Metro Real Per Capita Personal Income View selected Atlanta metro real per capita personal income (RPPI) patterns in this interactive table. The Atlanta metro 2012 RPPI is estimated to be $40,647. The metro ranks 149th among all 381 metros, between Savannah, GA metro ($40,676) and Clarksville, TN-KY metro ($40,627). Metro Gross Domestic Product View selected Atlanta metro Gross Domestic Product (GDP) patterns in this interactive table. The Atlanta metro 2012 GDP is estimated to be $294.6 billion. The metro ranks 32nd among all 381 metros, between Boston, MA metro ($336.2 billion) and Miami, FL metro ($274.1 billion). Metro Cities & Places Click link to view profile for the metro principal cities: • Alpharetta • Atlanta • Marietta • Roswell • Sandy Springs View similar profile for any Georgia city -- Georgia Community Profiles Metro School Districts School districts play an important role in the metro dynamics. See more about the school district community. Examine characteristics of the school age population by type of enrollment by school district. The largest 6 school districts in the metro are shown in this graphic: 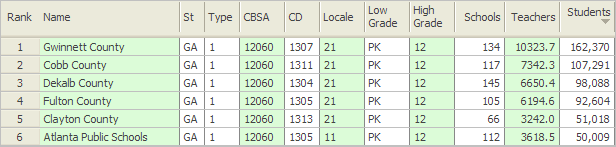 Use this interactive table to view/rank/compare all school districts. Children's Demographics Profiles by School District See more Georgia profiles • Atlanta City Schools, GA • Bibb County Schools, GA • Clayton County Schools, GA • Cobb County Schools, GA • DeKalb County Schools, GA • Fulton County Schools, GA • Gwinnett County Schools, GA Gwinnett County Public Schools, GA See largest 100 school districts. 2013-14 school year enrollment: 169,150 Map shows patterns of economic prosperity by neighborhood. .. ACS 2012 5-year median household income for district overall: $62,216. 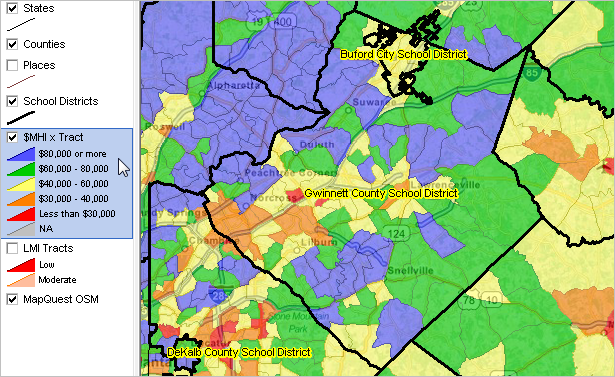 School district bold black boundary; click graphic for larger view View developed using CV XE GIS and Georgia DMI GIS Project. Click this link to view detailed 5-part demographic-economic characteristics for this school district. See related Gwinnett county projections to 2020. Comparing Among All School Districts Use the following interactive table to view/compare/rank compare school districts: • General Demographics -- http://proximityone.com/sd12dp1.htm • Social Characteristics -- http://proximityone.com/sd12dp2.htm • Economic Characteristics -- http://proximityone.com/sd12dp3.htm • Housing Characteristics -- http://proximityone.com/sd12dp4.htm About Metropolitan Areas By definition, metropolitan areas are comprised of one or more contiguous counties. Metropolitan areas are not single cities and typically include many cities. Metropolitan areas are comprised of urban and rural areas and often have large expanses of rural territory. A business and demographic-economic synergy exists within each metro; metros often interact with adjacent metros. The demographic-economic make-up of metros vary widely and change often. See more about metros. Support & DMI Web Sessions Learn more about using resources described in this section. Join us in a Decision-Making Information Web session. There is no fee for these one-hour Web sessions. Each informal session is focused on a specific topic. The open structure also provides for Q&A and discussion of application issues of interest to participants. We can address your specific questions about using metro and county demographic economic data and related applications. Additional Information ProximityOne develops geographic-demographic-economic data and analytical tools and helps organizations knit together and use diverse data in a decision-making and analytical framework. We develop custom demographic/economic estimates and projections, develop geographic and geocoded address files, and assist with impact and geospatial analyses. Wide-ranging organizations use our tools (software, data, methodologies) to analyze their own data integrated with other data. Follow ProximityOne on Twitter at www.twitter.com/proximityone. Contact ProximityOne (888-364-7656) with questions about data covered in this section or to discuss custom estimates, projections or analyses for your areas of interest. |
|
|