
|
|
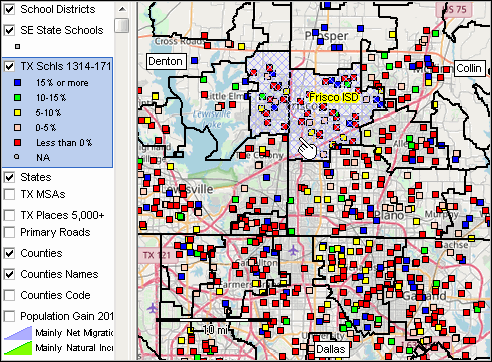
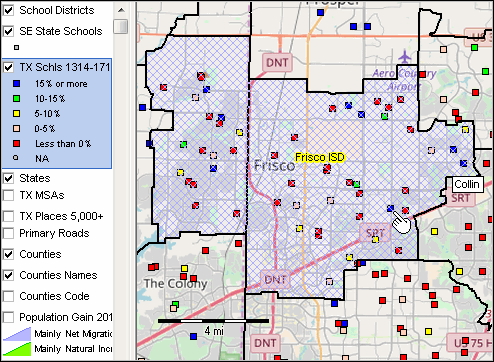
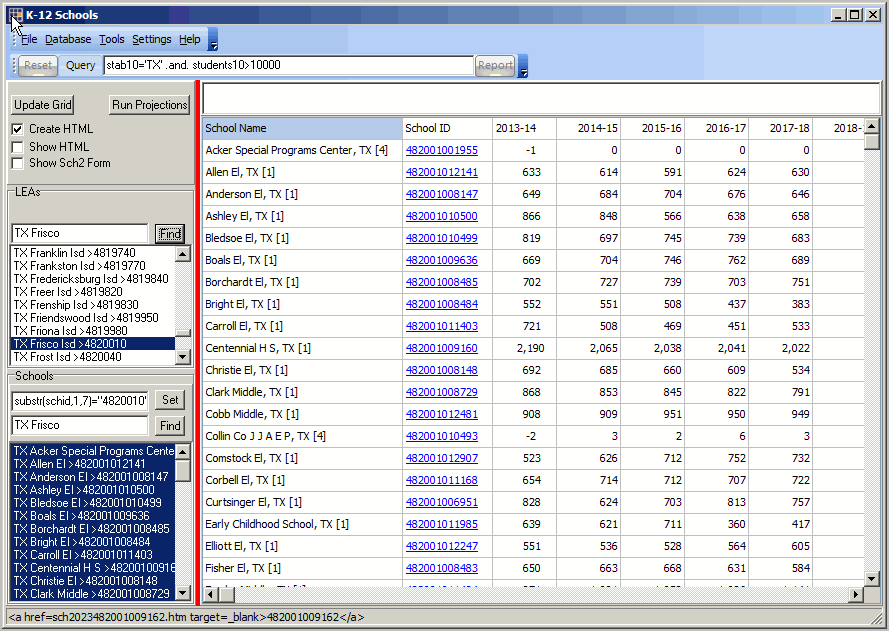
-- annual enrollment by grade projections to 2022-23 -- for each of the U.S. approximate 100,000 K-12 public schools Examine how enrollment by grade is changing year to year in K-12 schools of interest using ProximityOne 5-year enrollment projections. The ProximityOne K-12 Schools Enrollment Projections program is described in this section. Annual enrollment by grade data are included for the period 2013-14 to 2022-23 for each K-12 public school. Developed on a state-by-state basis, the national scope 2022-23 school enrollment projections will be available in August 2018; many states earlier. Contact us (mention SCH2023 in text section) or call 888.364.7656 for more information and acquire school by grade enrollment time series/projections. Projections are extended annually; new 2023-24 projections are scheduled for mid-2019. See illustrative reports below in this section. K-12 Schools Enrollment Projections (SCH2023) Components: • SCH2023 database containing the enrollment data by school • SCH2023 shapefile for use with GIS applications • K-12 schools report and analyses .. view illustrative reports below • integrated mapping and geospatial analysis using SDGIS tools Patterns of Enrollment Change by School Markers in the graphic below, locations of schools, show patterns of percent chnage in total enrollment during the period 2013-14 to 2017-18 for the northern area in the Dallas metro. Frisco ISD school district is shown with the blue cross-hatch pattern. Click graphic for larger view with details.  - view developed using CV XE GIS software and associated GIS project. Part of the power of using the school projections is that school enrollments change can be examined across/independent of school district boundaries. Some may also want to examine only schools in a particular school district. The next graphic is a zoom-in to the view shown above. Zoom-in to Frisco ISD, TX School District The graphic below shows patterns of housing units change from 2010 to 2017 for the 382 Metropolitan Statistical Areas Markers in the graphic below, locations of schools, show patterns of percent change in total enrollment during the period 2013-14 to 2017-18 for the northern area in the Dallas metro. Frisco ISD school district is shown with the blue cross-hatch pattern.  - view developed using CV XE GIS software and associated GIS project. CV XE GIS K-12 Schools Component The SCH2023 database is developed and maintained with the CV XE GIS K-12 Schools Component shown in the graphic below. Click graphic for larger view with details.  Development and maintenance features of the K-12 Schools Component is presently internal to ProximityOne. SCH2023 data access, reporting and analytical operations are available to licensed users. Illustrative Reports Examples of school/school group projection/trend reports are shown below. - click a link shown below opening a new/master page for that school group. - school groups may be a set of schools in a district, county or other area based on a query - the query used to select the schools (for example a single school district or county) is shown on the master page - the master page shows a list of all schools in the group .. schools with under 10 students are omitted in these examples - the master page shows a row for each school in the group. .. total enrollment is shown across the columns by year - click a school link in the master page to view the detailed enrollment by grade for that school. - in the school report, click the LEA code link to return to the master table - data are for illustrative use only and may differ from current vintage projections Missouri • Jackson County, MO schools .. illustrates selecting all schools in a county, irrespective of school district • Kansas City School District, MO schools Texas • Frisco ISD, TX schools • Clear Creek ISD, TX schools Virginia • Alexandria City Public Schools, VA schools • Fairfax County Public Schools, VA schools Terms of Use Data shown in this section, or via links to related pages, are for personal use only. We encourage use links to this section or specific school pages. Data are not authorized for any business or fee-based use. Licensed users may access the current vintage data. There is no warranty of any type for any use made of these data. The user is solely responsible for any use made of these data. Methodology School projections are developed using a modified age/grade-cohort generic model for each school. The model is adapted for individual schools to reflect unique characteristics of that school and location. The model uses a historical time series based on the NCES Common Core of Data (CCD). The historical CCD data are examined and updated as new information becomes available about those data. The historical CCD data are augmented typically with two years of more recent data collected from individual schools, LEAs and other education agencies ... an ongoing process. Each school is coded with census block, block group and census tract. We know the census block/tract in which the school is located. The school model takes into account the demographic-economic change in the census tracts associated with the school location. See more about census tract projections. Progressively, we integrate census tract and school cause and effect relationships to jointly determine school/tract demographics. Conditions affecting the school attendance cachement area demographics, such as housing and new residential construction are determned in this way. Where applicable/possible the model examines/integrates: • demographic change is the associated school attendance zone (SAZ) • change in other K-12 schools, charter schools and private schools in the area • feeder patterns Database Subject Matter Fields Data fields in the SCH2023 database are summarized in the scroll section below.
Support Using these Resources .. goto top Learn more about demographic economic data and related analytical tools. Join us in a Data Analytics Lab session. There is no fee for these Web sessions. Each informal session is focused on a specific topic. The open structure also provides for Q&A and discussion of application issues of interest to participants. ProximityOne User Group .. goto top Join the ProximityOne User Group to keep up-to-date with new developments relating to geographic-demographic-economic decision-making information resources. Receive updates and access to tools and resources available only to members. Use this form to join the User Group. Additional Information .. goto top ProximityOne develops geographic-demographic-economic data and analytical tools and helps organizations knit together and use diverse data in a decision-making and analytical framework. We develop custom demographic/economic estimates and projections, develop geographic and geocoded address files, and assist with impact and geospatial analyses. Wide-ranging organizations use our software, data and methodologies to analyze their own data integrated with other data. Follow ProximityOne on Twitter at www.twitter.com/proximityone. Contact ProximityOne (888-364-7656) with questions about data covered in this section or to discuss custom estimates, projections or analyses for your areas of interest. |
|
|