
|
|
|
Census Tract Demographic Economic Business Data Analytics
.. covering the U.S. wall-to-wall with more than 73,000 geographic areas, census tracts are a preferred small-area geographic level to analyze geographic, demographic and economic characteristics and trends. Coterminous with county boundaries, averaging 4,000 population, static boundaries over the decade and having annual demographic-economic updates from multiple sources ... make census tracts an important geography for data analytics. This section is focused on tools and methods to access and use census tract demographic-economic measures. Median household income ($MHI), median housing value ($MHV) and other selected items are used to illustrate operations and options. .. update in progress; some links obsolete .. This section illustrates use of census tract data from the 2019 American Community Survey (ACS2019) 5-year estimates. These are the most comprehensive demographic-economic data from the Census Bureau at the census tract level. These "5-year estimates" are centric to mid-2017. Updates. The mid-December 2019 update features the ACS2019 rather than the ACS2015 data. See related ACS2016 API tools for related methods to develop national scope ACS2016 one-year estimates for multiple types of geography. Methods described here apply to many other geographies; see related tip sections. See related section on ZIP code applications. Topics Six data access and use options are reviewed. Each method illustrates how $MHV can be analyzed/used in different contexts. • Option 1 - View the data as a thematic pattern map. • Option 2 - View, compare, rank query data in interactive tables. • Option 3 - Access data using API Tools; create datasets. • Option 4 - View $MHI in structured profile in context of related data. • Option 5 - Site analysis - view circular area profile from a location. • Option 6 - Find tract demographics based on an address. Related sections: • About census tracts • Census tracts main section • Low & Moderate Income Census Tract Data Analytics • 10 Reasons to use Census Tract versus ZIP Code Demographics • Evolution of Census Tracts: 1970-2010 • Demographic-Economic Estimates & Projections • Census tract and ZIP code equivalencing • Using census tracts versus ZIP code areas • Single year of age demographics Option 1. View the data as a thematic pattern map; use the GIS tools -- goto top Patterns of Economic Prosperity ($MHI) by Census Tract ... the following graphic shows $MHI for a portion of the Los Angeles metro. Accommodating different demographic-economic thresholds/patterns, different legend color/data intervals are used. The pattern layer is set to 80% transparency enabling a view of earth features. Click graphic for larger view, more detail and legend color/data intervals; expand browser window for best quality view.  - View developed using CV XE GIS and related GIS project. Additional Illustrative Tract Maps • Allegheny County, PA Tracts (42003) Create neighborhood/tract thematic pattern maps on your computer using no fee State by neighborhood GIS projects. See more information. Option 2. Use interactive tables -- goto top - go to http://proximityone.com/tracts15dp3.htm (5-year estimates) - median housing value is item H088; see in item list above interactive table. - scroll left on the table until H088 appears in the header column - this column shows the 2015 ACS 5-year estimate for H088 for all census tracts - see usage notes below table. All U.S. by census tract interactive tables: • General Demographics • Social Characteristics • Economic Characteristics • Housing Characteristics Option 3. Use the API tools/operations -- goto top - 5-year estimates for census tracts ... - median housing value ($MHV) is item B25077_001E. - click this link to get B25077_001E (median housing value) using the API tool. - this API call retrieves data for all tracts in a specified state .. the following URL is used in above link; note use of California FIPS state code 06 (rightmost characters) .. https://api.census.gov/data/2019/acs/acs5?get=NAME,B01001_001E,B25011_001E&for=tract:*&in=state:06 .. line/row 1 ... [["B25077_001E","NAME","state","county","tract"], .. line/row 2 ... ["1000001","Census Tract 4001, Alameda County, California","06","001","400100"], .. line/row 3 ... ["886400","Census Tract 4002, Alameda County, California","06","001","400200"], - median housing value appears on the left, then "name", then geocodes (link with shapefile). - note line/row 2 shows the $MHV for tract 06-001-400100 shows as 1000001 -- $1,000,001 .. this is the top-code value. .. in tracts where the true $MHV exceeds $1,000,000, the top code value of 1000001 is used. - optionally save this file and import the data into a preferred program. - more about API tools. - more about using 1-year and 5-year estimates. Extending option 3 ... accessing race, origin and $MHV for each tract in a state ... click on these example APIs to access data for all tracts in California (substitute your state FIPS code of interest) .. get extended subject matter for all tracts in California .. might require 10 seconds. Items used in these API calls: .. B01003_001E - Total population Age .. B01001_011E -- Male: 25 to 29 years (illustrating age cohort access) .. B01001_035E -- Female: 25 to 29 years (illustrating age cohort access) Race/Origin .. B02001_002E - White alone .. B02001_003E - Black or African American alone .. B02001_004E - American Indian and Alaska Native alone .. B02001_005E - Asian alone .. B02001_006E - Native Hawaiian and Other Pacific Islander alone .. B02001_007E - Some other race alone .. B02001_008E - Two or more races .. B03001_003E - Hispanic (of any race) Income .. B19013_001E - Median household income ($) .. B19113_001E - Median family income ($) Housing & Households .. B25001_001E - Total housing units .. B25002_002E - Occupied housing units (households) .. B19001_017E -- Households with household income $200,000 or more .. B25003_002E -- Owner Occupied housing units .. B25075_023E --- Housing units value $500,000 to $749,999 (owner occupied) .. B25075_024E --- Housing units with value $750,000 to $999,999 (owner occupied) .. B25075_025E --- Housing units with value $1,000,000 or more (owner occupied) .. B25002_003E - Vacant housing units .. B25077_001E - Median housing value ($) - owner occupied units .. B25064_001E - Median gross rent ($) - renter occupied units Reference & Related Resources: • Table Shells - xls - use to determine items tabulated/available • Appendices - xls - use to determine "by block group" availability • 5-year estimates table lookup file - xls - item sequences & tables relationships • Summary File Technical Documentation - pdf • Questionnaire pdf • 2014-2015 Data Profile Comparison - xls - some items differ between years • Tabulation Area Geography - htm • 2015 U.S. Gazetteer Files ... geography in these files matches the 2019 American Community Survey data Option 4. View the median housing value in context of other attributes for a census tract -- goto top - click this link -- this page shows demographic profile items for one tract relative to one county. • click a tract link on that page to view a selected tract profile. • when the report displays, scroll down in the table to the housing value section. • these profiles can be prepared for any tract. Option 5. Using the SiteAnalysis Tool -- goto top - dynamically/visually analyze patterns/characteristics using Site Analysis Tools. - view shows drill-down to tracts in Los Angeles area; click graphic to view zoom-out of location. - as the 1 mile radius is selected, the number of owner-occupied units by value are displayed in table at right. .. H085 $300,000 to $499,999 .. H086 $500,000 to $999,999 .. H087 $1,000,000 or more - there are 6,818 owner occupied housing units with values of $1 million or more in cross-hatched tracts. .. optionally cherry-pick tracts. - 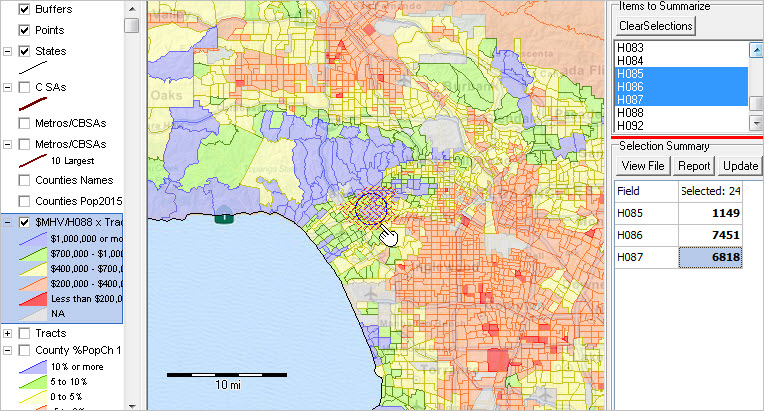 . .- View developed using CVXEGIS SiteAnalysis tool and related GIS project. Option 6. Lookup census tract demographics based on an address -- goto top
Enter address details ...
See information about content displayed below. Refresh page to remove content displayed below.
Click Find to show results demographic-economic characteristics and geocodes ... may require 5-10 seconds after clicking Find. ... tested for use with Firefox, Safari, Internet Explorer & Chrome. About the Data Content and Structure When the Find button (above) is clicked, this page refreshes with returned data based on your query -- the values entered/selected in the section above the Find button. The first portion of the data displayed provide a structured display of selected subject matter items (ACS 5-year estimates) for the type of geography selected (e.g. tracts) for that area in which the address is located. The scope of those items could be substantially expanded. Following that portion of the display are the geographic attributes displayed as JSON output resulting from the geocoder processing of the address. This is the display content below the text "Summary of address sent and matched results:". Importance of Census Tracts for Data Analytics Census tracts are important in data analytics for many reasons. • Covering the U.S. wall-to-wall, census tracts are the preferred "small area" geography for superior data analytics. • The Census Bureau now produces annual tract demographic-economic data from the American Community Survey; .. there is an evolving time-series at the tract level creating new analytical opportunities. • Originally developed to equivalence neighborhoods, many still do. • Defined by the Census Bureau in collaboration with local groups, .. tracts typically reflect boundaries meaningful for local area analysis. • Defined generally for use with each new decennial census, most tract boundaries are stable .. and non-changing for ten years and many much longer. • Designed to average 4,000 population, .. there are more than twice as many census tracts (73,056) than ZIP code areas (33,129). • Tract boundaries are well-defined; unlike ZIP code areas which are subject to multi-sourced geographic definitions. • Many data developers (e.g., epidemiologists) use census tract geography to tabulate their own small area data .. enabling more effective use of those data with Census Bureau census tract data. • A statistical geographic area (in contrast to politically defined areas), .. census tracts are coterminous with counties; .. data at the census tract level can be aggregated to the county level. • Small area estimates for tracts are typically more reliable than for block groups. .. census tracts are comprised on one or more coterminous block groups. .. on average, a census tract is comprised of three block groups. • Census tracts are used by many Federal, state and local governments for compliance and program management. Support Using these Resources Learn more about demographic economic data and related analytical tools. Join us in the Data Analytics Lab sessions. There is no fee for these Web sessions. Each informal session is focused on a specific topic. The open structure also provides for Q&A and discussion of application issues of interest to participants. ProximityOne User Group Join the ProximityOne User Group to keep up-to-date with new developments relating to geographic-demographic-economic decision-making information resources. Receive updates and access to tools and resources available only to members. Use this form to join the User Group. Additional Information ProximityOne develops geographic-demographic-economic data and analytical tools and helps organizations knit together and use diverse data in a decision-making and analytical framework. We develop custom demographic/economic estimates and projections, develop geographic and geocoded address files, and assist with impact and geospatial analyses. Wide-ranging organizations use our software, data and methodologies to analyze their own data integrated with other data. Follow ProximityOne on Twitter at www.twitter.com/proximityone. Contact ProximityOne (888-364-7656) with questions about data covered in this section or to discuss custom estimates, projections or analyses for your areas of interest. |
|
|