|
|
Decision-Making Information

|
ProximityOne
information resources & solutions
(888) DMI-SOLN
(888) 364-7656
Visual analysis with ProximityOne tools
click graphic for info; hover to pause
Data Analytics Blog
Mapping Statistical Data
Support & Technical Assistance
help using these resources
|
Characteristics of the U.S. Population & Housing
-- demographic-economic characteristics and patterns
The United States median household income was $51,371 in 2012 and $53,657 in 2014 -- a change of $2,286 (4.5%).
These are the most recent estimates and based on the American Community Survey (ACS).
What about other attributes? The population who spoke a language other than English "not very well" in 2012 was approximately 25 million --
that number increased by approximately 500 thousand between 2012 and 2014 -- an example of other subject matter. The table and data provided in this section provides much more detail.
ACS provides annual data. Data for 2012 and 2014 are used here as 1) the 2014 data are the most recent and
2) comparing change over two years might provide improved insights as compared to a 1-year change.
There are many statistical programs that provide wide-ranging measures of U.S. demographic-economic attributes.
Among the many important features of the ACS data is this unique feature:
the ACS data provides largely the same scope of subject matter at the national level down to the block group level.
Block groups cover the U.S. wall-to-wall with detailed geographic granularity (217,000 areas).
For example, compare the U.S. ACS 2012 or 2014 5-year estimates.
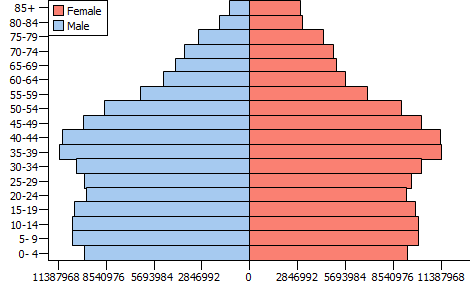
Longer-term Demographic Patterns
The following population pyramids show patterns of the
U.S. population for 2000 and 2010. The graphics shown population by age (5-year age group, y-axis) and gender (female, red; male, blue).
Click graphics for larger view and more detail. See pyramids for each/all states
|
2000

|
2010
|
United States 2012-2014 Characteristics & Patterns
The Census 2010 population of the United States
was 308,745,538.
The table shown below provides updated demographics developed by ProximityOne using data from ACS.
For areas of 65,000 population or more, ACS 1-year estimates are tabulated, as shown in this table.
For smaller population areas (and for all areas), ACS 5-year estimates are also tabulated.
All ACS data are estimates and subject to errors of estimation and other errors.
See more about comparing these data over time.
Corresponding tables for selected areas:
United States
• United States
-- xls
-- 1-year -- 2012-2014 (same data as shown below)
• United States
-- xls
-- 5-year -- 2012-2014
Texas
• State of Texas
-- xls
-- 1-year -- 2012-2014
• State of Texas
-- xls
-- 5-year -- 2012-2014
School Districts
• Dallas ISD
-- xls
-- 1-year -- 2012-2014
• Dallas ISD
-- xls
-- 5-year -- 2012-2014
United States Demographic-Economic Characteristics -- 2012-2014
| | -- ACS 2012 1 year -- | -- ACS 2014 1 year -- | -- Change 2012-14 --
| | | Value | Percent | Value | Percent | Value | Percent |
| Total Population | 313,914,040 | 100.00 | 318,857,056 | 100.00 | 4,943,016 | 1.57 |
| Male | 154,436,243 | 49.20 | 156,890,101 | 49.20 | 2,453,858 | 1.59 |
| Female | 159,477,797 | 50.80 | 161,966,955 | 50.80 | 2,489,158 | 1.56 |
| Age | | | | | | |
| Under 5 years | 19,910,326 | 6.34 | 19,773,010 | 6.20 | -137,316 | -0.69 |
| 5-9 years | 20,480,578 | 6.52 | 20,563,575 | 6.45 | 82,997 | 0.41 |
| 10-14 years | 20,777,987 | 6.62 | 20,749,801 | 6.51 | -28,186 | -0.14 |
| 15-19 years | 21,550,469 | 6.87 | 21,347,017 | 6.69 | -203,452 | -0.94 |
| 20-24 years | 22,463,182 | 7.16 | 22,698,029 | 7.12 | 234,847 | 1.05 |
| 25-34 years | 42,100,846 | 13.41 | 43,323,099 | 13.59 | 1,222,253 | 2.90 |
| 35-44 years | 40,698,086 | 12.96 | 40,751,359 | 12.78 | 53,273 | 0.13 |
| 45-54 years | 44,204,952 | 14.08 | 43,353,277 | 13.60 | -851,675 | -1.93 |
| 55-59 years | 20,622,207 | 6.57 | 21,314,688 | 6.68 | 692,481 | 3.36 |
| 60-64 years | 17,964,930 | 5.72 | 18,768,308 | 5.89 | 803,378 | 4.47 |
| 65-74 years | 24,004,760 | 7.65 | 26,418,204 | 8.29 | 2,413,444 | 10.05 |
| 75-84 years | 13,302,316 | 4.24 | 13,750,719 | 4.31 | 448,403 | 3.37 |
| 85+ years | 5,833,401 | 1.86 | 6,045,970 | 1.90 | 212,569 | 3.64 |
| Median age | 37.40 | | 37.70 | | 0.30 | 0.80 |
| Race/Origin | | | | | | |
| One Race | 304,840,426 | 97.11 | 309,251,285 | 96.99 | 4,410,859 | 1.45 |
| White | 231,992,377 | 73.90 | 233,963,128 | 73.38 | 1,970,751 | 0.85 |
| Black/African American | 39,623,138 | 12.62 | 40,379,066 | 12.66 | 755,928 | 1.91 |
| American Indian/Alaska Native | 2,563,505 | 0.82 | 2,601,714 | 0.82 | 38,209 | 1.49 |
| Asian | 15,555,530 | 4.96 | 16,686,960 | 5.23 | 1,131,430 | 7.27 |
| Native Hawaiian/Pacific Islander | 543,198 | 0.17 | 557,154 | 0.17 | 13,956 | 2.57 |
| Some other race | 14,562,678 | 4.64 | 15,063,263 | 4.72 | 500,585 | 3.44 |
| Two or more races | 9,073,614 | 2.89 | 9,605,771 | 3.01 | 532,157 | 5.86 |
| Hispanic (of any race) | 52,961,017 | 16.87 | 55,279,452 | 17.34 | 2,318,435 | 4.38 |
| Households by Type | | | | | | |
| Total households | 115,969,540 | 100.00 | 117,259,427 | 100.00 | 1,289,887 | 1.11 |
| Families | 76,509,262 | 65.97 | 77,152,072 | 65.80 | 642,810 | 0.84 |
| Nonfamily households | 39,460,278 | 34.03 | 40,107,355 | 34.20 | 647,077 | 1.64 |
| Average Household Size | 2.64 | | 2.65 | | 0.01 | 0.38 |
| Average Family Size | 3.25 | | 3.26 | | 0.01 | 0.31 |
| Relationship | | | | | | |
| Population in households | 305,885,362 | 97.44 | 310,792,895 | 97.47 | 4,907,533 | 1.60 |
| School Enrollment | | | | | | |
| Population 3 & over enrolled | 83,085,860 | 100.00 | 82,063,714 | 100.00 | -1,022,146 | -1.23 |
| Nursery school, preschool | 5,040,851 | 6.07 | 4,884,849 | 5.95 | -156,002 | -3.09 |
| Kindergarten | 4,246,155 | 5.11 | 4,201,566 | 5.12 | -44,589 | -1.05 |
| Elementary school (grades 1-8) | 32,875,346 | 39.57 | 32,974,291 | 40.18 | 98,945 | 0.30 |
| High school (grades 9-12) | 17,013,441 | 20.48 | 17,008,157 | 20.73 | -5,284 | -0.03 |
| College or graduate school | 23,910,067 | 28.78 | 22,994,851 | 28.02 | -915,216 | -3.83 |
| Educational Attainment | | | | | | |
| Population 25 years & over | 208,731,498 | 100.00 | 213,725,624 | 100.00 | 4,994,126 | 2.39 |
| Less than 9th grade | 12,072,306 | 5.78 | 12,063,864 | 5.64 | -8,442 | -0.07 |
| 9th to 12th grade, no diploma | 16,409,962 | 7.86 | 15,928,170 | 7.45 | -481,792 | -2.94 |
| High school graduate (incl equiv) | 58,495,661 | 28.02 | 59,249,552 | 27.72 | 753,891 | 1.29 |
| Some college, no degree | 44,399,937 | 21.27 | 44,799,481 | 20.96 | 399,544 | 0.90 |
| Associate's degree | 16,611,110 | 7.96 | 17,429,531 | 8.16 | 818,421 | 4.93 |
| Bachelor's degree | 37,969,084 | 18.19 | 39,864,014 | 18.65 | 1,894,930 | 4.99 |
| Graduate or professional degree | 22,773,438 | 10.91 | 24,391,012 | 11.41 | 1,617,574 | 7.10 |
| Percent high school graduate or higher | 86.40 | | 86.90 | | 0.50 | 0.58 |
| Percent bachelor's degree or higher | 29.10 | | 30.10 | | 1.00 | 3.44 |
| Residence 1 year ago | 310,212,755 | 100.00 | 315,095,393 | 100.00 | 4,882,638 | 1.57 |
| Same house | 263,612,596 | 84.98 | 268,147,625 | 85.10 | 4,535,029 | 1.72 |
| Different house in U.S. | 44,766,942 | 14.43 | 44,905,563 | 14.25 | 138,621 | 0.31 |
| Same county | 27,913,580 | 9.00 | 27,290,363 | 8.66 | -623,217 | -2.23 |
| Different county | 16,853,362 | 5.43 | 17,615,200 | 5.59 | 761,838 | 4.52 |
| Same state | 9,783,017 | 3.15 | 10,281,031 | 3.26 | 498,014 | 5.09 |
| Different state | 7,070,345 | 2.28 | 7,334,169 | 2.33 | 263,824 | 3.73 |
| Abroad | 1,833,217 | 0.59 | 2,042,205 | 0.65 | 208,988 | 11.40 |
| Language Spoken at Home | | | | | | |
| Population 5 years & over | 294,003,714 | 100.00 | 299,084,046 | 100.00 | 5,080,332 | 1.73 |
| English only | 232,126,499 | 78.95 | 235,905,559 | 78.88 | 3,779,060 | 1.63 |
| Language other than English | 61,877,215 | 21.05 | 63,178,487 | 21.12 | 1,301,272 | 2.10 |
| Speak English less than very well | 25,088,697 | 8.53 | 25,592,758 | 8.56 | 504,061 | 2.01 |
| Spanish | 38,325,155 | 13.04 | 39,254,342 | 13.12 | 929,187 | 2.42 |
| Speak English less than very well | 16,149,456 | 5.49 | 16,388,318 | 5.48 | 238,862 | 1.48 |
| Employment Status | | | | | | |
| Population 16 years & over | 248,601,283 | 100.00 | 253,588,947 | 100.00 | 4,987,664 | 2.01 |
| In labor force | 158,729,043 | 63.85 | 160,532,722 | 63.30 | 1,803,679 | 1.14 |
| Civilian labor force | 157,703,368 | 63.44 | 159,550,452 | 62.92 | 1,847,084 | 1.17 |
| Employed | 142,921,687 | 57.49 | 148,019,908 | 58.37 | 5,098,221 | 3.57 |
| Unemployed | 14,781,681 | 5.95 | 11,530,544 | 4.55 | -3,251,137 | -21.99 |
| Armed forces | 1,025,675 | 0.41 | 982,270 | 0.39 | -43,405 | -4.23 |
| Not in labor force | 89,872,240 | 36.15 | 93,056,225 | 36.70 | 3,183,985 | 3.54 |
| Civilian labor force | 157,703,368 | 63.44 | 159,550,452 | 62.92 | 1,847,084 | 1.17 |
| Percent unemployed | 9.40 | | 7.20 | | -2.20 | -23.40 |
| Employment by Industry | | | | | | |
| Civilian employed population 16 years & over | 142,921,687 | 100.00 | 148,019,908 | 100.00 | 5,098,221 | 3.57 |
| Agriculture, forestry, fishing & hunting, mining | 2,830,729 | 1.98 | 2,963,918 | 2.00 | 133,189 | 4.71 |
| Construction | 8,802,312 | 6.16 | 9,292,826 | 6.28 | 490,514 | 5.57 |
| Manufacturing | 14,988,864 | 10.49 | 15,216,294 | 10.28 | 227,430 | 1.52 |
| Wholesale trade | 3,785,841 | 2.65 | 4,063,468 | 2.75 | 277,627 | 7.33 |
| Retail trade | 16,639,780 | 11.64 | 17,065,344 | 11.53 | 425,564 | 2.56 |
| Transportation, warehousing, utilities | 7,020,960 | 4.91 | 7,327,146 | 4.95 | 306,186 | 4.36 |
| Information | 2,975,482 | 2.08 | 3,222,160 | 2.18 | 246,678 | 8.29 |
| Finance, insurance, real estate | 9,414,894 | 6.59 | 9,614,483 | 6.50 | 199,589 | 2.12 |
| Professional, scientific, management | 15,591,744 | 10.91 | 16,438,747 | 11.11 | 847,003 | 5.43 |
| Education & health care | 33,113,097 | 23.17 | 34,091,965 | 23.03 | 978,868 | 2.96 |
| Arts, entertainment, recreation | 13,697,912 | 9.58 | 14,536,953 | 9.82 | 839,041 | 6.13 |
| Other services | 7,118,937 | 4.98 | 7,289,277 | 4.92 | 170,340 | 2.39 |
| Public administration | 6,941,135 | 4.86 | 6,897,327 | 4.66 | -43,808 | -0.63 |
| Household Income | | | | | | |
| Total households | 115,969,540 | 100.00 | 117,259,427 | 100.00 | 1,289,887 | 1.11 |
| Less than $10,000 | 8,885,815 | 7.66 | 8,536,754 | 7.28 | -349,061 | -3.93 |
| $10,000 to $14,999 | 6,550,068 | 5.65 | 6,160,917 | 5.25 | -389,151 | -5.94 |
| $15,000 to $24,999 | 12,889,311 | 11.11 | 12,355,825 | 10.54 | -533,486 | -4.14 |
| $25,000 to $34,999 | 12,033,359 | 10.38 | 11,784,411 | 10.05 | -248,948 | -2.07 |
| $35,000 to $49,999 | 15,971,542 | 13.77 | 15,796,840 | 13.47 | -174,702 | -1.09 |
| $50,000 to $74,999 | 20,866,034 | 17.99 | 20,885,791 | 17.81 | 19,757 | 0.09 |
| $75,000 to $99,999 | 13,779,990 | 11.88 | 14,102,565 | 12.03 | 322,575 | 2.34 |
| $100,000 to $149,999 | 14,366,700 | 12.39 | 15,329,084 | 13.07 | 962,384 | 6.70 |
| $150,000 to $199,999 | 5,345,408 | 4.61 | 6,043,692 | 5.15 | 698,284 | 13.06 |
| $200,000 or more | 5,281,313 | 4.55 | 6,263,548 | 5.34 | 982,235 | 18.60 |
| Median household income | 51,371 | | 53,657 | | 2,286 | 4.45 |
| Mean household income | 71,317 | | 75,591 | | 4,274 | 5.99 |
| Percent Families & People in Poverty | | | | | | |
| All families | 11.80 | | 11.30 | | -0.50 | -4.24 |
| All people | 15.90 | | 15.50 | | -0.40 | -2.52 |
| Housing Occupancy | | | | | | |
| Total housing units | 132,452,249 | 100.00 | 133,962,970 | 100.00 | 1,510,721 | 1.14 |
| Occupied housing units | 115,969,540 | 87.56 | 117,259,427 | 87.53 | 1,289,887 | 1.11 |
| Vacant housing units | 16,482,709 | 12.44 | 16,703,543 | 12.47 | 220,834 | 1.34 |
| Homeowner vacancy rate | 2.00 | | 1.90 | | -0.10 | -5.00 |
| Rental vacancy rate | 6.80 | | 6.30 | | -0.50 | -7.35 |
| Units in Structure | | | | | | |
| Total housing units | 132,452,249 | 100.00 | 133,962,970 | 100.00 | 1,510,721 | 1.14 |
| 1-unit, detached | 81,554,643 | 61.57 | 82,391,900 | 61.50 | 837,257 | 1.03 |
| 1-unit, attached | 7,695,788 | 5.81 | 7,718,465 | 5.76 | 22,677 | 0.29 |
| 2 units | 5,006,114 | 3.78 | 5,053,183 | 3.77 | 47,069 | 0.94 |
| 3 or 4 units | 5,880,296 | 4.44 | 5,964,467 | 4.45 | 84,171 | 1.43 |
| 5 to 9 units | 6,311,130 | 4.76 | 6,531,053 | 4.88 | 219,923 | 3.48 |
| 10 to 19 units | 5,927,271 | 4.48 | 6,102,907 | 4.56 | 175,636 | 2.96 |
| 20 or more units | 11,465,984 | 8.66 | 11,630,169 | 8.68 | 164,185 | 1.43 |
| Mobile home, boat, RV etc. | 8,510,590 | 6.43 | 8,462,461 | 6.32 | -48,129 | -0.57 |
| Year Structure Built | | | | | | |
| Total housing units | 132,452,249 | 100.00 | 133,962,970 | 100.00 | 1,510,721 | 1.14 |
| 2010 or later | 1,199,560 | 0.91 | 2,723,663 | 2.03 | 1,524,103 | 127.06 |
| 2000 to 2009 | 19,799,406 | 14.95 | 19,599,180 | 14.63 | -200,226 | -1.01 |
| 1990 to 1999 | 18,348,209 | 13.85 | 18,770,589 | 14.01 | 422,380 | 2.30 |
| 1980 to 1989 | 18,326,856 | 13.84 | 18,346,964 | 13.70 | 20,108 | 0.11 |
| 1970 to 1979 | 20,944,138 | 15.81 | 20,974,330 | 15.66 | 30,192 | 0.14 |
| 1960 to 1969 | 14,577,453 | 11.01 | 14,741,022 | 11.00 | 163,569 | 1.12 |
| 1950 to 1959 | 14,397,367 | 10.87 | 14,243,850 | 10.63 | -153,517 | -1.07 |
| 1940 to 1949 | 7,072,019 | 5.34 | 7,029,981 | 5.25 | -42,038 | -0.59 |
| 1939 or earlier | 17,787,241 | 13.43 | 17,533,391 | 13.09 | -253,850 | -1.43 |
| Housing Tenure | | | | | | |
| Occupied housing units | 115,969,540 | 100.00 | 117,259,427 | 100.00 | 1,289,887 | 1.11 |
| Owner-occupied | 74,119,256 | 63.91 | 73,991,995 | 63.10 | -127,261 | -0.17 |
| Renter-occupied | 41,850,284 | 36.09 | 43,267,432 | 36.90 | 1,417,148 | 3.39 |
| Avg household size, owner-occupied | 2.70 | | 2.71 | | 0.01 | 0.37 |
| Avg household size, renter-occupied | 2.53 | | 2.55 | | 0.02 | 0.79 |
| Year Householder Moved Into Unit | | | | | | |
| Occupied housing units | 115,969,540 | 100.00 | 117,259,427 | 100.00 | 1,289,887 | 1.11 |
| 2010 or later | 31,507,002 | 27.17 | 45,069,381 | 38.44 | 13,562,379 | 43.05 |
| 2000 to 2009 | 45,461,532 | 39.20 | 36,624,354 | 31.23 | -8,837,178 | -19.44 |
| 1990 to 1999 | 18,996,653 | 16.38 | 17,383,494 | 14.82 | -1,613,159 | -8.49 |
| 1980 to 1989 | 9,200,406 | 7.93 | 8,447,356 | 7.20 | -753,050 | -8.18 |
| 1970 to 1979 | 6,071,721 | 5.24 | 5,616,819 | 4.79 | -454,902 | -7.49 |
| 1969 or earlier | 4,732,226 | 4.08 | 4,118,023 | 3.51 | -614,203 | -12.98 |
| Occupants per room | | | | | | |
| 1.00 or less | 112,132,529 | 96.69 | 113,329,360 | 96.65 | 1,196,831 | 1.07 |
| 1.01 to 1.50 | 2,710,941 | 2.34 | 2,793,845 | 2.38 | 82,904 | 3.06 |
| 1.51 or more | 1,126,070 | 0.97 | 1,136,222 | 0.97 | 10,152 | 0.90 |
| Housing Value (owner occupied units) | 74,119,256 | 100.00 | 73,991,995 | 100.00 | -127,261 | -0.17 |
| Less than $50,000 | 6,784,356 | 9.15 | 7,252,803 | 9.80 | 468,447 | 6.90 |
| $50,000 to $99,999 | 12,100,148 | 16.33 | 10,984,718 | 14.85 | -1,115,430 | -9.22 |
| $100,000 to $149,999 | 12,245,474 | 16.52 | 11,238,389 | 15.19 | -1,007,085 | -8.22 |
| $150,000 to $199,999 | 11,370,120 | 15.34 | 10,866,782 | 14.69 | -503,338 | -4.43 |
| $200,000 to $299,999 | 13,393,416 | 18.07 | 13,431,171 | 18.15 | 37,755 | 0.28 |
| $300,000 to $499,999 | 11,068,593 | 14.93 | 11,936,757 | 16.13 | 868,164 | 7.84 |
| $500,000 to $999,999 | 5,696,677 | 7.69 | 6,510,385 | 8.80 | 813,708 | 14.28 |
| $1,000,000 or more | 1,460,472 | 1.97 | 1,770,990 | 2.39 | 310,518 | 21.26 |
| Median | 171,900 | | 181,200 | | 9,300 | 5.41 |
| Selected Monthly Owner Costs (SMOC) | | | | | | |
| Housing units with a mortgage | 48,726,257 | 100.00 | 47,174,889 | 100.00 | -1,551,368 | -3.18 |
| Less than $300 | 100,603 | 0.21 | 120,134 | 0.25 | 19,531 | 19.41 |
| $300 to $499 | 907,617 | 1.86 | 839,536 | 1.78 | -68,081 | -7.50 |
| $500 to $699 | 2,791,709 | 5.73 | 2,630,795 | 5.58 | -160,914 | -5.76 |
| $700 to $999 | 7,617,103 | 15.63 | 7,423,684 | 15.74 | -193,419 | -2.54 |
| $1,000 to $1,499 | 14,002,995 | 28.74 | 13,763,213 | 29.17 | -239,782 | -1.71 |
| $1,500 to $1,999 | 9,658,799 | 19.82 | 9,372,071 | 19.87 | -286,728 | -2.97 |
| $2,000 or more | 13,647,431 | 28.01 | 13,025,456 | 27.61 | -621,975 | -4.56 |
| Median | 1,460 | | 1,454 | | -6 | -0.41 |
| Gross Rent | | | | | | |
| Occupied units paying rent | 39,629,329 | 100.00 | 40,975,355 | 100.00 | 1,346,026 | 3.40 |
| Less than $200 | 721,831 | 1.82 | 577,389 | 1.41 | -144,442 | -20.01 |
| $200 to $299 | 1,276,784 | 3.22 | 1,261,010 | 3.08 | -15,774 | -1.24 |
| $300 to $499 | 3,266,904 | 8.24 | 2,885,512 | 7.04 | -381,392 | -11.67 |
| $500 to $749 | 9,127,518 | 23.03 | 8,349,065 | 20.38 | -778,453 | -8.53 |
| $750 to $999 | 9,634,214 | 24.31 | 9,876,661 | 24.10 | 242,447 | 2.52 |
| $1,000 to $1,499 | 10,001,083 | 25.24 | 11,155,248 | 27.22 | 1,154,165 | 11.54 |
| $1,500 or more | 5,600,995 | 14.13 | 6,870,470 | 16.77 | 1,269,475 | 22.67 |
| Median | 884 | | 934 | | 50 | 5.66 |
| | | | | | |
Support Using these Resources
Learn more about demographic economic data and related analytical tools.
Join us in a Data Analytics Lab session.
There is no fee for these Web sessions.
Each informal session is focused on a specific topic.
The open structure also provides for Q&A and discussion of application issues of interest to participants.
ProximityOne User Group
Join the ProximityOne User Group
to keep up-to-date with new developments relating to geographic-demographic-economic decision-making information resources.
Receive updates and access to tools and resources available only to members.
Use this form to join the User Group.
Additional Information
ProximityOne develops geographic-demographic-economic data and analytical tools and helps organizations knit together and use diverse data in a decision-making and analytical framework. We develop custom demographic/economic estimates and projections, develop geographic and geocoded address files, and assist with impact and geospatial analyses.
Wide-ranging organizations use our software, data and methodologies to analyze their own data integrated with other data.
Follow ProximityOne on Twitter at
www.twitter.com/proximityone.
Contact ProximityOne (888-364-7656) with questions about data covered in this section or to discuss custom estimates, projections or analyses for your areas of interest.
|
